

The DOI matches its Crossref record; 32 of the 32 references it cites were found in a registry or an index.
Engineering a Brain Cancer Chip for High-throughput Drug Screening
Open accessAbstract
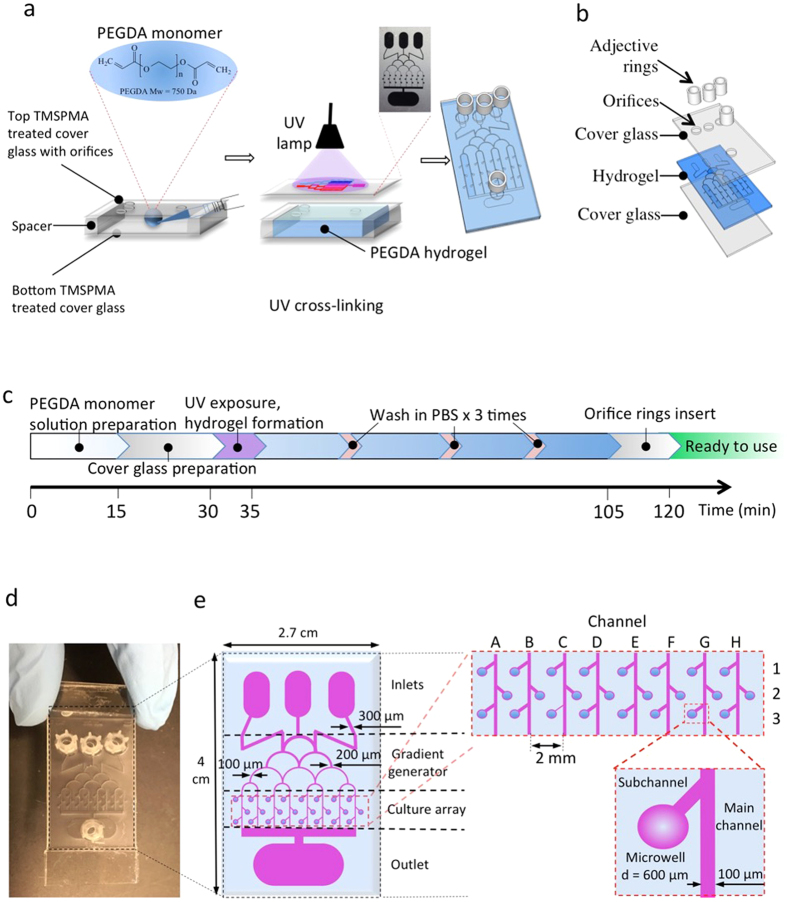
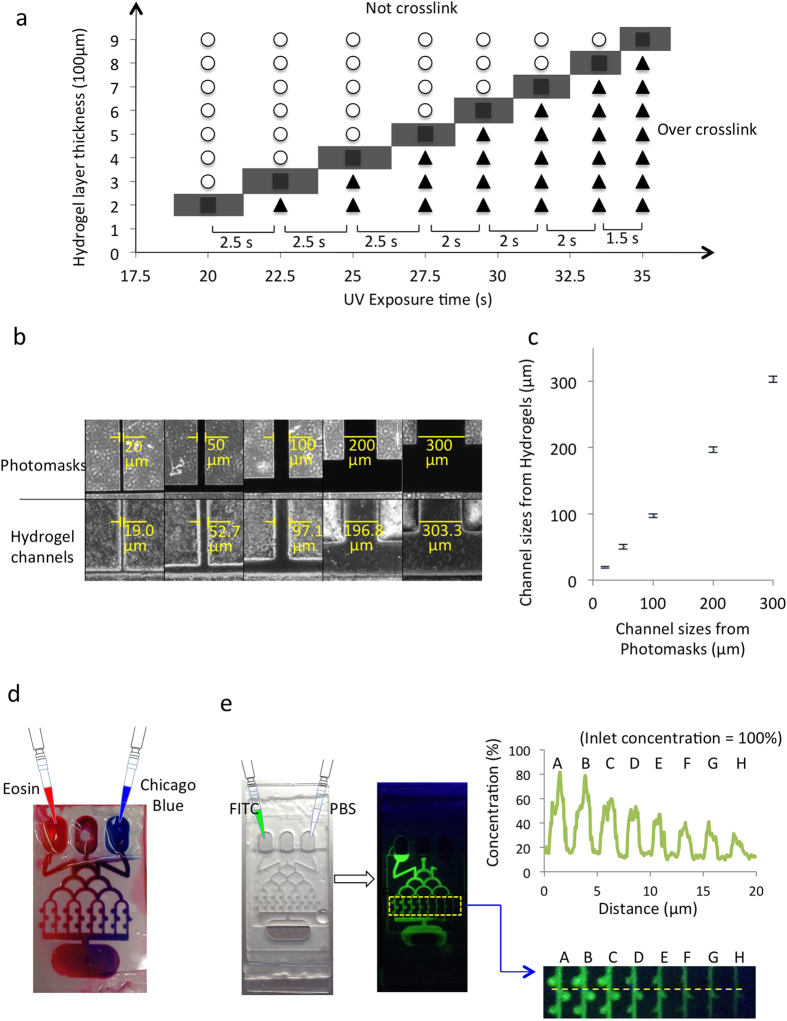
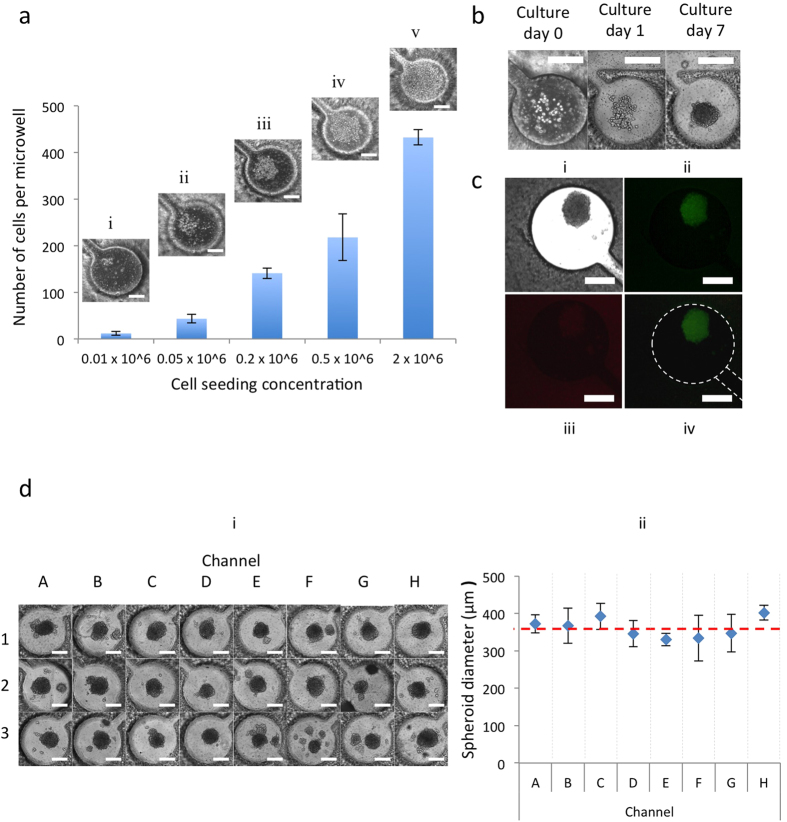
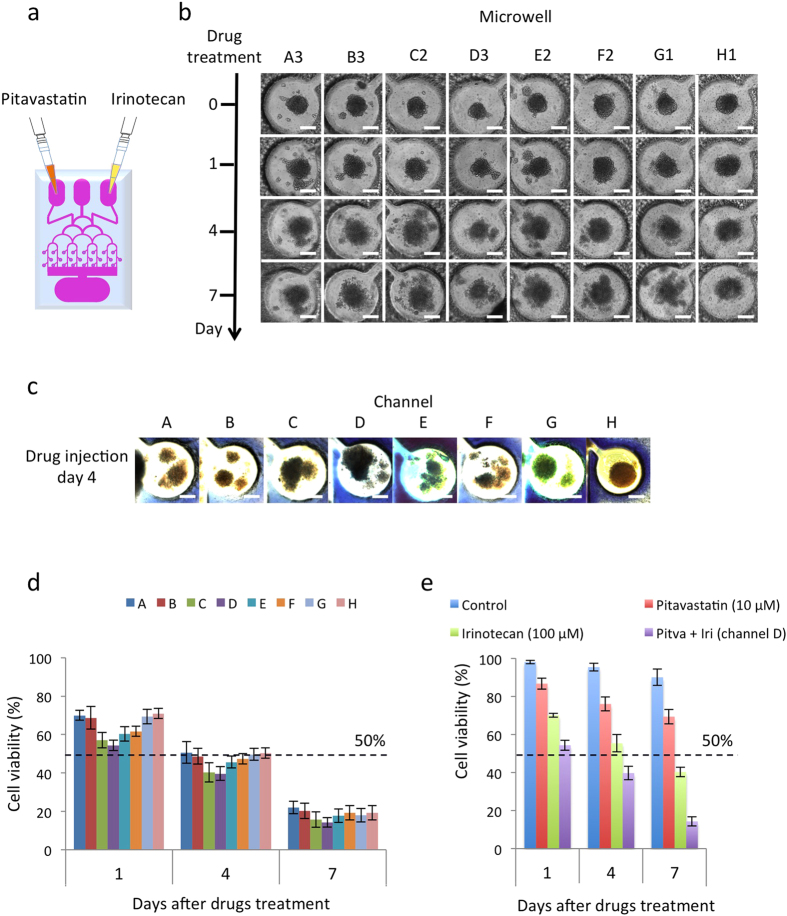
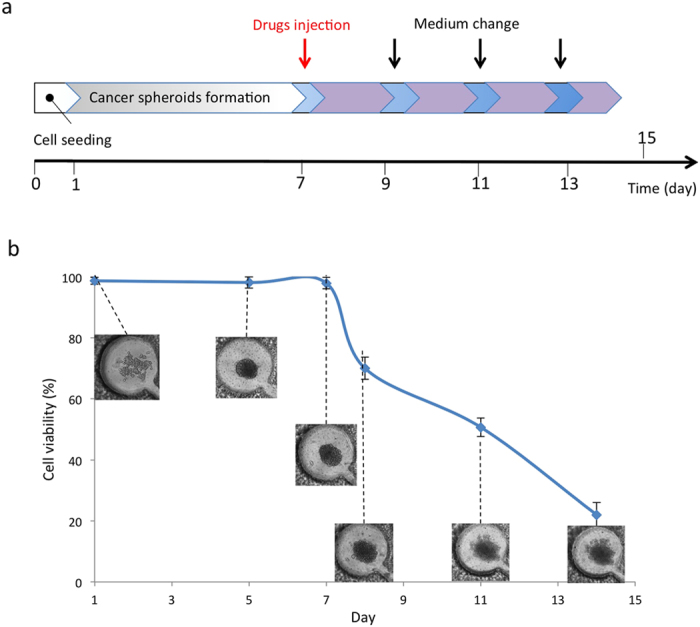
Glioblastoma multiforme (GBM) is the most common and malignant of all human primary brain cancers, in which drug treatment is still one of the most effective treatments. However, existing drug discovery and development methods rely on the use of conventional two-dimensional (2D) cell cultures, which have been proven to be poor representatives of native physiology. Here, we developed a novel three-dimensional (3D) brain cancer chip composed of photo-polymerizable poly(ethylene) glycol diacrylate (PEGDA) hydrogel for drug screening. This chip can be produced after a few seconds of photolithography and requires no silicon wafer, replica molding, and plasma bonding like microfluidic devices made of poly(dimethylsiloxane) (PDMS). We then cultured glioblastoma cells (U87), which formed 3D brain cancer tissues on the chip, and used the GBM chip to perform combinatorial treatment of Pitavastatin and Irinotecan. The results indicate that this chip is capable of high-throughput GBM cancer spheroids formation, multiple-simultaneous drug administration, and a massive parallel testing of drug response. Our approach is easily reproducible, and this chip has the potential to be a powerful platform in cases such as high-throughput drug screening and prolonged drug release. The chip is also commercially promising for other clinical applications, including 3D cell culture and micro-scale tissue engineering.
Overview
The claims and statistics of this paper haven’t been checked yet.
Run the check — free, no account needed. It reads the open-access text and checks the sources it cites.
Integrity signals
Registry
Cites
Statistics
Figures
Verification
Claims the paper makes
The claims and statistics of this paper haven’t been checked yet.
Run the check — free, no account needed. It reads the open-access text and checks the sources it cites.
Claims other papers make about this one
Each is checked against this paper’s own text: does it say what the citing paper says it does?
In the citing paper
“They injected mepitastatin and irinotecan into the cells, and the results showed that this model can be used as a glioma chip model for drug screening and release tests.”
From Tumor-on-a-chip: from bioinspired design to biomedical application (2021) · cites this paper as [197]
Self-check
Percentages, sums and reported differences re-computed from the paper’s own numbers.
The self-check needs the paper’s full text.
Citations
Cites
Radiotherapy Plus Concomitant and Adjuvant Temozolomide for Glioblastoma
Stupp, R., Mason, W. P., van den Bent, M. J., Weller, M., Fisher, B., Taphoorn, M. J. B., Belanger, K., Brandes, A. A., Marosi, C., Bogdahn, U., et al. (2005) · New England Journal of Medicine · doi:10.1056/nejmoa043330 · Cited by 21,807
Siegel, R. L., Miller, K. D., & Jemal, A. (2015) · CA A Cancer Journal for Clinicians · doi:10.3322/caac.21254 · Cited by 11,854
Drug combination studies and their synergy quantification using the Chou-Talalay method
Chou, T.-C. (2010) · Cancer Research · doi:10.1158/0008-5472.can-09-1947 · Cited by 5,739
Reconstituting organ-level lung functions on a chip
Huh, D., Matthews, B. D., Mammoto, A., Montoya-Zavala, M., Hsin, H. Y., & Ingber, D. E. (2010) · Science · doi:10.1126/science.1188302 · Cited by 4,250
Monolithic Microfabricated Valves and Pumps by Multilayer Soft Lithography
Unger, M., Chou, H.-P., Thorsen, T., Scherer, A., & Quake, S. R. (2000) · Science · doi:10.1126/science.288.5463.113 · Cited by 4,016
Engineering Flows in Small Devices: Microfluidics Toward a Lab-on-a-Chip
Stone, H. A., Stroock, A. D., & Ajdari, A. (2003) · Annual Review of Fluid Mechanics · doi:10.1146/annurev.fluid.36.050802.122124 · Cited by 3,744
Lab-on-a-chip: microfluidics in drug discovery
Dittrich, P. S., & Manz, A. (2006) · Nature Reviews Drug Discovery · doi:10.1038/nrd1985 · Cited by 1,852
Hydrogels in controlled release formulations: Network design and mathematical modeling
Lin, C., & Metters, A. T. (2006) · Advanced Drug Delivery Reviews · doi:10.1016/j.addr.2006.09.004 · Cited by 1,774
Impact of high-throughput screening in biomedical research
Macarron, R., Banks, M. N., Bojanic, D., Burns, D. J., Cirovic, D. A., Garyantes, T., Green, D. V. S., Hertzberg, R. P., Janzen, W. P., Paslay, J. W., et al. (2011) · Nature Reviews Drug Discovery · doi:10.1038/nrd3368 · Cited by 1,364
Targeting brain cancer: advances in the molecular pathology of malignant glioma and medulloblastoma
Huse, J. T., & Holland, E. C. (2010) · Nature reviews. Cancer · doi:10.1038/nrc2818 · Cited by 783
Cited by
Sorted by citations
Functional and Biomimetic Materials for Engineering of the Three-Dimensional Cell Microenvironment
Huang, G., Li, F., Zhao, X., Ma, Y., Li, Y., Lin, M., Jin, G., Lu, T. J., Genin, G. M., & Xu, F. (2017) · Chemical Reviews · doi:10.1021/acs.chemrev.7b00094 · Cited by 825
Self-citationApplication of microfluidic chip technology in pharmaceutical analysis: A review
Cui, P., & Wang, S. (2018) · Journal of Pharmaceutical Analysis · doi:10.1016/j.jpha.2018.12.001 · Cited by 401
Digital Light Processing Based Three-dimensional Printing for Medical Applications
Zhang, J., Hu, Q., Wang, S., Tao, J., & Gou, M. (2019) · International Journal of Bioprinting · doi:10.18063/ijb.v6i1.242 · Cited by 359
Advances in Hydrogels in Organoids and Organs‐on‐a‐Chip
Liu, H., Wang, Y., Cui, K., Guo, Y., Zhang, X., & Qin, J. (2019) · Advanced Materials · doi:10.1002/adma.201902042 · Cited by 361
Shirure, V. S., Bi, Y., Curtis, M. B., Lezia, A., Goedegebuure, M. M., Goedegebuure, S. P., Aft, R., Fields, R. C., & George, S. C. (2018) · Lab on a Chip · doi:10.1039/c8lc00596f · Cited by 316
Metadata
- Authors
- Fan, Y., Nguyen, D. T., Akay, Y., Xu, F., & Akay, M.
- Affiliations
- University of Houston (US)
- Xi'an Jiaotong University (CN)
- Corresponding author
- Akay, Metin
- Venue
- Scientific Reports
- Published
- 2016-05-06
- Volume
- 6
- Issue
- 1
- Pages
- 25062-25062
- ISSN
- 2045-2322 (ISSN-L)
- PMC
- PMC4858657
- OpenAlex
- W2346064008
- Cited by
- 216
- References
- 32
- Citations by year
- 2026: 9 · 2025: 17 · 2024: 18 · 2023: 22 · 2022: 29 · 2021: 32 · 2020: 23 · 2019: 23 · 2018: 23 · 2017: 14 · 2016: 6
- FWCI
- 10.59
- Type
- journal article
- Language
- en
- Open access
- gold
- doi.org
- Locations
- Scientific Reports (publishedVersion, cc-by)
- PubMed Central (publishedVersion, cc-by)
- PubMed (publishedVersion)
- Topics
- Physical Sciences › Engineering › Biomedical Engineering › 3D Printing in Biomedical Research
- Physical Sciences › Engineering › Biomedical Engineering › Microfluidic and Capillary Electrophoresis Applications
- Physical Sciences › Materials Science › Biomaterials › Hydrogels: synthesis, properties, applications
- Keywords
- glioblastoma, high-throughput drug screening, PEGDA hydrogel, U87 glioblastoma cells, tumor spheroids, pitavastatin, irinotecan, combination therapy, photolithography, microfluidics, 3D cell culture, drug release
- MeSH terms
- Antineoplastic Agents, Brain Neoplasms, Drug Evaluation, Preclinical, Humans, Reproducibility of Results, Spheroids, Cellular, Cell Culture Techniques, Cell Line, Tumor, High-Throughput Screening Assays
About these checks
Registry, retraction, Cites and statistics results are computed, not judged, with one exception: a printed reference that no index lists is read once by a model before it counts as a citation error. Claims are extracted by a model and kept only when their quote appears verbatim in the text; each cited source is then checked, with a model’s help, for whether it says what the claim relies on. Those verdicts can be wrong — read the claim’s quote and the cited source before relying on one.
Statistics and arithmetic are recomputed, not judged.
Confidence bands are shown only for fields calibrated on our annotated test set. None is calibrated yet, so no band is shown.
What counts as a claim ›How we measure confidence ›How we check this ›
Are you an author, or do you see a problem with this page? Request a review
