Cited by 246SARS-CoV-2 and COVID-19 ResearchCOVID-19 Clinical Research StudiesAnimal Virus Infections Studies

The DOI matches its Crossref record; 87 of the 88 references it cites were found in a registry or an index, and 1 are not checked yet.

SARS-CoV-2 spreads through cell-to-cell transmission

Open access

Published version of a preprint

Abstract

Significance: It is currently unknown if SARS-CoV-2 can spread through cell–cell contacts, and if so, the underlying mechanisms and implications. In this work, we show, by using lentiviral pseudotyped virus, that the spike protein of SARS-CoV-2 mediates the viral cell-to-cell transmission, with an efficiency higher than that of SARS-CoV. We also find that cell–cell fusion contributes to cell-to-cell transmission, yet ACE2 is not absolutely required. While the authentic variants of concern (VOCs) B.1.1.7 (alpha) and B.1.351 (beta) differ in cell-free infectivity from wild type and from each other, these VOCs have similar cell-to-cell transmission capability and exhibit differential sensitivity to neutralization by vaccinee sera. Results from our study will contribute to a better understanding of SARS-CoV-2 spread and pathogenesis.

Overview

The claims and statistics of this paper haven’t been checked yet.

Run the check — free, no account needed. It reads the open-access text and checks the sources it cites.

A few free checks a day · papers already verified open instantly · results are public

Integrity signals

Registry

Crossref · 10.1073/pnas.2111400119

Cites

87 of 88 references verified0 citation errors · 0 not checkable

Statistics

Figures

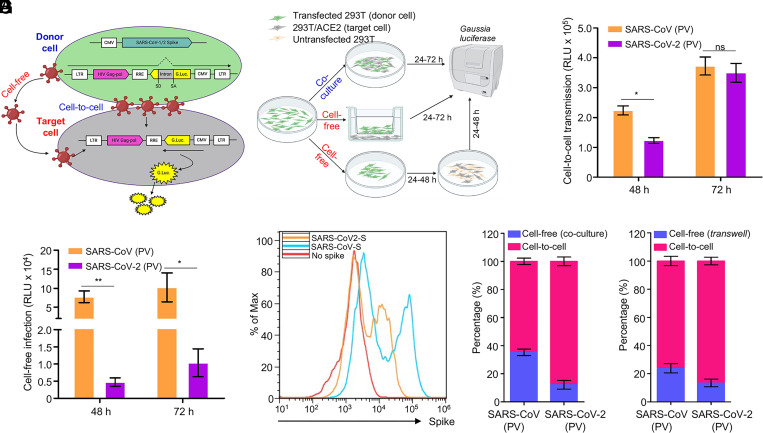
Fig. 1. The spike protein of SARS-CoV-2 and SARS-CoV mediates cell-to-cell transmission of HIV-1 lentiviral pseudotypes. (A and B) Schematic representations of cell-to-cell and cell-free infection assays (see details in Materials and Methods). Briefly, the inGluc-based lentiviral pseudotypes bearing spike were produced in 293T cells, which were cocultured with the target cells (293T/ACE2) for cell-to-cell transmission; the Gluc activity of cocultured cells was measured over time (A). Cell-free infection was performed by harvesting virus from the same number of producer cells, followed by infecting 293T/ACE2 target cells in the presence of the same number of untransfected 293T cells; alternatively, cell-free infection was carried out in Transwell plates, from which Gluc activity was measured (B). (C) Comparison of cell-to-cell transmission mediated by SARS-CoV-2 or SARS-CoV spike. Results shown were from six independent experiments, with cell-free infection measured at 48 and 72 h after coculture; the portion of cell-free infection was excluded (n = 6). (D) Comparison of cell-free infection mediated by SARS-CoV-2 or SARS-CoV spike. Results were from six independent experiments (n = 6). (E) The expression level of spike proteins on the plasma membrane of donor cells was measured by flow cytometry using a polycolonal antibody T62, which detects both SARS-CoV-2 and SARS-CoV. (F and G) The calculated ratios between cell-to-cell and cell-free infection mediated by SARS-CoV-2 or SARS-CoV-2 spike. Results from cell coculture are shown in F and from Transwell plates shown in G (n = ∼3 to 6). PV, pseudotyped virus. *P < 0.05, **P < 0.01 . ns, not significant.
Fig. 1. The spike protein of SARS-CoV-2 and SARS-CoV mediates cell-to-cell transmission of HIV-1 lentiviral pseudotypes. (A and B) Schematic representations of cell-to-cell and cell-free infection assays (see details in Materials and Methods). Briefly, the inGluc-based lentiviral pseudotypes bearing spike were produced in 293T cells, which were cocultured with the target cells (293T/ACE2) for cell-to-cell transmission; the Gluc activity of cocultured cells was measured over time (A). Cell-free infection was performed by harvesting virus from the same number of producer cells, followed by infecting 293T/ACE2 target cells in the presence of the same number of untransfected 293T cells; alternatively, cell-free infection was carried out in Transwell plates, from which Gluc activity was measured (B). (C) Comparison of cell-to-cell transmission mediated by SARS-CoV-2 or SARS-CoV spike. Results shown were from six independent experiments, with cell-free infection measured at 48 and 72 h after coculture; the portion of cell-free infection was excluded (n = 6). (D) Comparison of cell-free infection mediated by SARS-CoV-2 or SARS-CoV spike. Results were from six independent experiments (n = 6). (E) The expression level of spike proteins on the plasma membrane of donor cells was measured by flow cytometry using a polycolonal antibody T62, which detects both SARS-CoV-2 and SARS-CoV. (F and G) The calculated ratios between cell-to-cell and cell-free infection mediated by SARS-CoV-2 or SARS-CoV-2 spike. Results from cell coculture are shown in F and from Transwell plates shown in G (n = ∼3 to 6). PV, pseudotyped virus. *P < 0.05, **P < 0.01 . ns, not significant.CC BY · PubMed Central
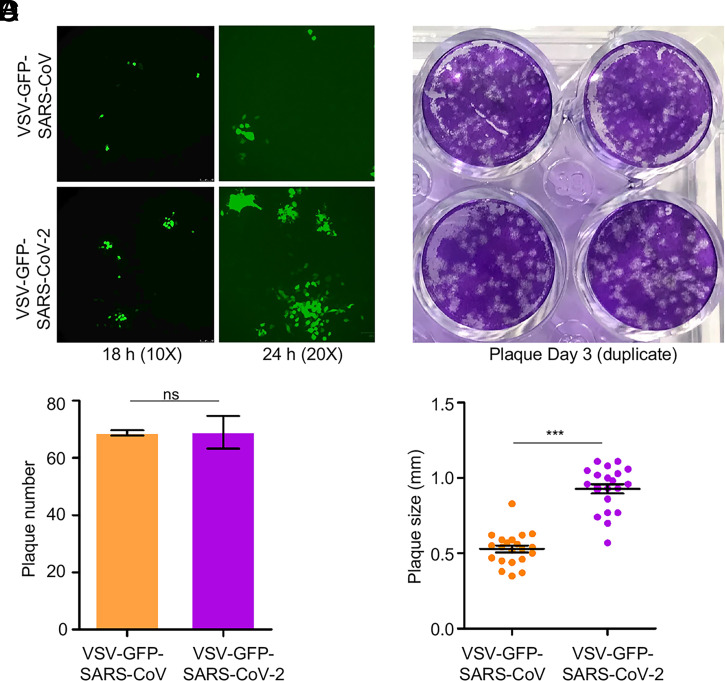
Fig. 2. rVSV expressing SARS-CoV-2 spike spreads faster than does rVSV bearing SARS-CoV spike. Vero-E6 cells were infected with rVSV-GFP-SARS-CoV-2 or SARS-CoV (MOI = 0.01); 1 h postinfection, cells were washed with PBS and cultured in the presence of 1% methylcellulose. Photos were taken at 18 h and 24 h (A). After 72 h of infection, cells were fixed with 3.7% paraformaldehyde (PFA) and stained with crystal violet (B). The number and size of plaques are plotted in C and D, respectively. ***P < 0.001. ns, not significant.
Fig. 2. rVSV expressing SARS-CoV-2 spike spreads faster than does rVSV bearing SARS-CoV spike. Vero-E6 cells were infected with rVSV-GFP-SARS-CoV-2 or SARS-CoV (MOI = 0.01); 1 h postinfection, cells were washed with PBS and cultured in the presence of 1% methylcellulose. Photos were taken at 18 h and 24 h (A). After 72 h of infection, cells were fixed with 3.7% paraformaldehyde (PFA) and stained with crystal violet (B). The number and size of plaques are plotted in C and D, respectively. ***P < 0.001. ns, not significant.CC BY · PubMed Central
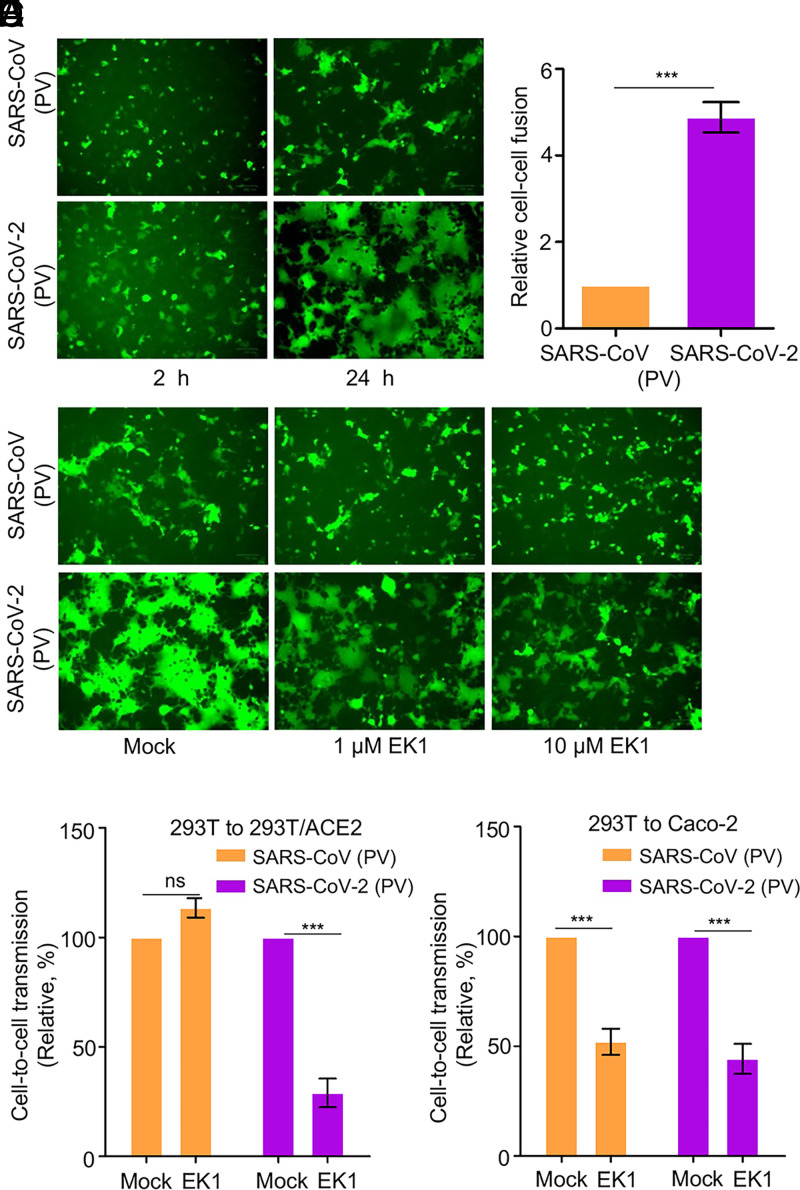
Fig. 3. Cell–cell fusion mediated by SARS-CoV and SARS-CoV-2 spike contributes to cell-to-cell transmission. (A) Syncytia formation mediated by the spike of SARS-CoV-2 or SARS-CoV. The 293T donor cells were cotransfected with plasmids encoding SARS-CoV-2 or SARS-CoV spike, lentiviral NL4-3 inGluc vector, and eGFP. After 24 h posttransfection, the donor cells were cocultured with target 293T/ACE2 cells at a 1:1 ratio, with fusion monitored over time and photos taken after 2 h and 24 h, respectively. (B) Quantification of cell–cell fusion. The 293T cells were transfected with plasmids encoding tet-off or SARS-CoV or SARS-CoV-2 spike and cocultured with target 293FT-mCAT-Gluc cells, which were transfected with a plasmid expressing ACE2; Gluc activity was measured from the supernatant of cocultured cells at 24 h and 48 h, respectively. Relative fusion was plotted by setting the fusion activity of SARS-CoV as 1.0. (C–E) Fusion inhibitor EK1 inhibits cell–cell fusion of SARS-CoV-2 spike, in accordance with its effect on cell-to-cell transmission. Effect of EK1 on syncytia formation induced by SARS-CoV-2 spike (C); photos were taken at 24 h. Effects of EK1 on SARS-CoV-2 or SARS-CoV infection from 293T to 293T/ACE2 (D) or from 293T to Caco-2 (E). Transfected 293T donor cells were cocultured with 293T/ACE2 or Caco-2 cells in the presence or absence of 10 µM EK1, and Gluc activity was measured at 24 to 72 h after coculture. Results from three to six independent experiments were averaged and plotted as relative values by setting the mock control as 100% (n = ∼3 to 6). PV, pseudotyped virus. ***P < 0.001. ns, not significant.
Fig. 3. Cell–cell fusion mediated by SARS-CoV and SARS-CoV-2 spike contributes to cell-to-cell transmission. (A) Syncytia formation mediated by the spike of SARS-CoV-2 or SARS-CoV. The 293T donor cells were cotransfected with plasmids encoding SARS-CoV-2 or SARS-CoV spike, lentiviral NL4-3 inGluc vector, and eGFP. After 24 h posttransfection, the donor cells were cocultured with target 293T/ACE2 cells at a 1:1 ratio, with fusion monitored over time and photos taken after 2 h and 24 h, respectively. (B) Quantification of cell–cell fusion. The 293T cells were transfected with plasmids encoding tet-off or SARS-CoV or SARS-CoV-2 spike and cocultured with target 293FT-mCAT-Gluc cells, which were transfected with a plasmid expressing ACE2; Gluc activity was measured from the supernatant of cocultured cells at 24 h and 48 h, respectively. Relative fusion was plotted by setting the fusion activity of SARS-CoV as 1.0. (C–E) Fusion inhibitor EK1 inhibits cell–cell fusion of SARS-CoV-2 spike, in accordance with its effect on cell-to-cell transmission. Effect of EK1 on syncytia formation induced by SARS-CoV-2 spike (C); photos were taken at 24 h. Effects of EK1 on SARS-CoV-2 or SARS-CoV infection from 293T to 293T/ACE2 (D) or from 293T to Caco-2 (E). Transfected 293T donor cells were cocultured with 293T/ACE2 or Caco-2 cells in the presence or absence of 10 µM EK1, and Gluc activity was measured at 24 to 72 h after coculture. Results from three to six independent experiments were averaged and plotted as relative values by setting the mock control as 100% (n = ∼3 to 6). PV, pseudotyped virus. ***P < 0.001. ns, not significant.CC BY · PubMed Central
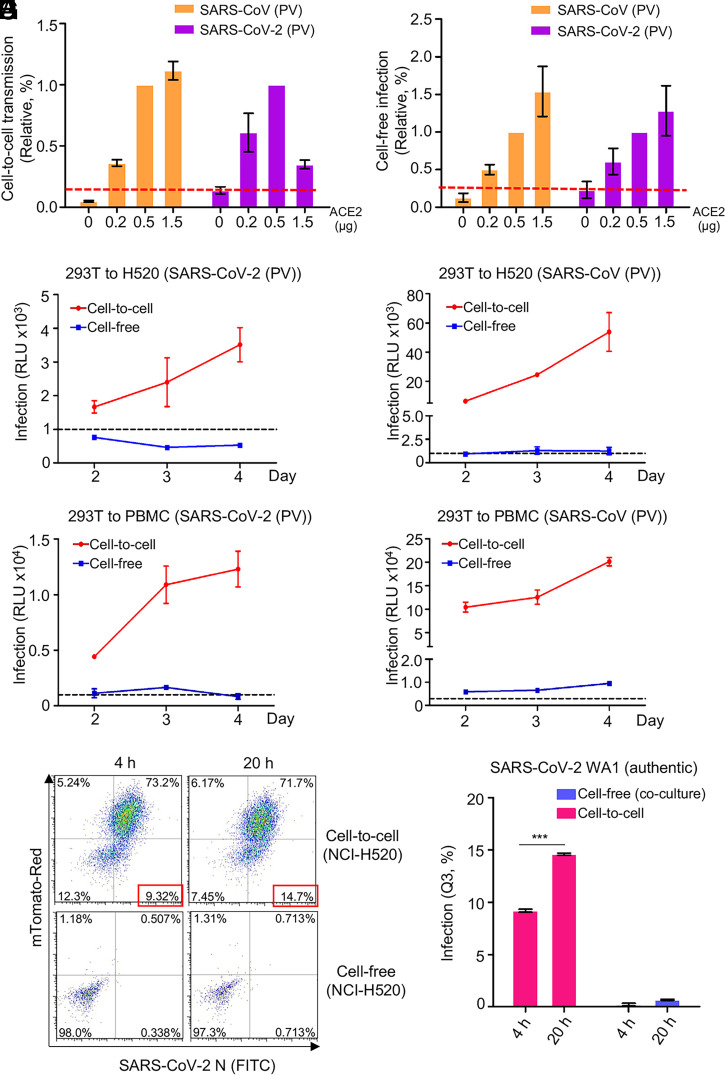
Fig. 4. ACE2 enhances cell-to-cell transmission but is not absolutely required. (A and B) Cell-to-cell and cell-free infection were performed as described for Figs. 1 and 3 except that target cells were 293T transfected with different amounts of a plasmid encoding ACE2. Relative rates of cell-to-cell transmission and cell-free infection were calculated by setting the values of 0.5 µg ACE2 to 1.0 (A and B, n = 3). (C–F) Experiments were carried out as described for Figs. 1 and 3 except that target cells were H520 and human PBMCs (n = 3 for each). (G) Vero-ACE2-TMPRSS2-mTomato (Red) cells were infected with MOI = 0.01 of authentic SARS-CoV-2 WT (USA-WA1/2020) for 18 h, followed by coculturing of the donor NCI-H520 cells for another 4 h or 20 h. Cells were fixed and stained with an anti–SARS-CoV-2 N protein for flow cytometric analysis. The same number of NCI-H520 cells were infected with the WT SARS-CoV-2 harvested from the SARS-CoV-2–infected donor Vero-ACE2-TMPRSS2-mTomato cells for 4 h or 20 h for cell-free infection and analyzed by flow cytometry. (H) Results of Q3 quadrant analyses were plotted. ***P < 0.001. PV, pseudotyped virus.
Fig. 4. ACE2 enhances cell-to-cell transmission but is not absolutely required. (A and B) Cell-to-cell and cell-free infection were performed as described for Figs. 1 and 3 except that target cells were 293T transfected with different amounts of a plasmid encoding ACE2. Relative rates of cell-to-cell transmission and cell-free infection were calculated by setting the values of 0.5 µg ACE2 to 1.0 (A and B, n = 3). (C–F) Experiments were carried out as described for Figs. 1 and 3 except that target cells were H520 and human PBMCs (n = 3 for each). (G) Vero-ACE2-TMPRSS2-mTomato (Red) cells were infected with MOI = 0.01 of authentic SARS-CoV-2 WT (USA-WA1/2020) for 18 h, followed by coculturing of the donor NCI-H520 cells for another 4 h or 20 h. Cells were fixed and stained with an anti–SARS-CoV-2 N protein for flow cytometric analysis. The same number of NCI-H520 cells were infected with the WT SARS-CoV-2 harvested from the SARS-CoV-2–infected donor Vero-ACE2-TMPRSS2-mTomato cells for 4 h or 20 h for cell-free infection and analyzed by flow cytometry. (H) Results of Q3 quadrant analyses were plotted. ***P < 0.001. PV, pseudotyped virus.CC BY · PubMed Central
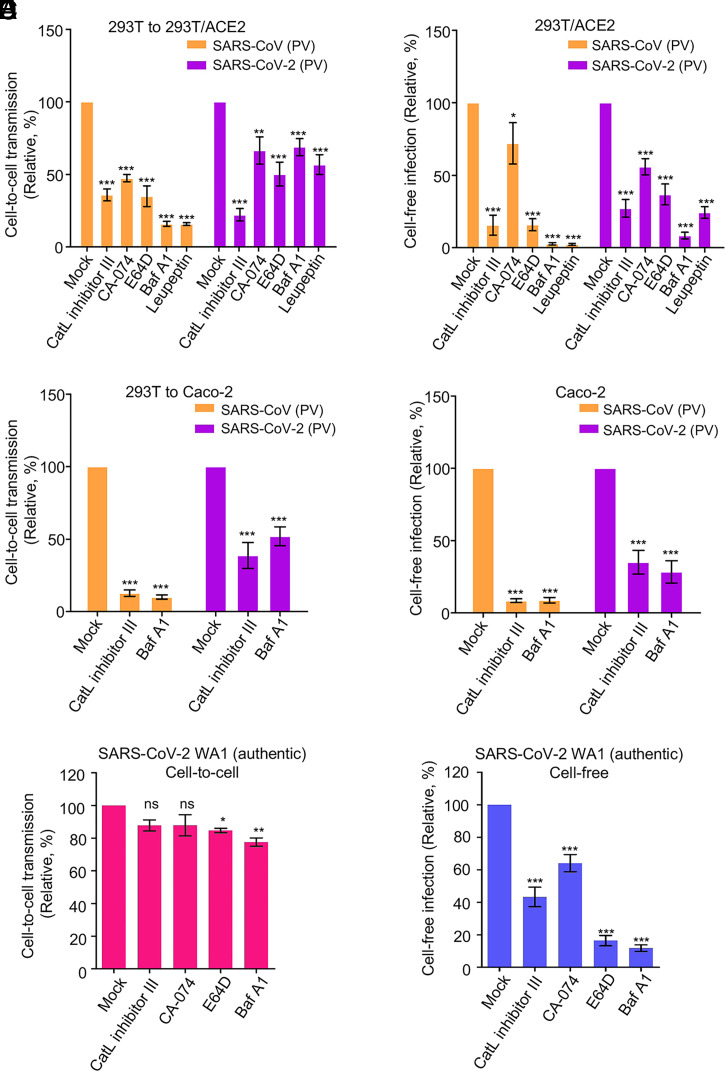
Fig. 5. Endosomal entry pathway is involved in cell-to-cell transmission. Effect of endosomal entry inhibitors on cell-to-cell and cell-free infection of SARS-CoV-2 and SARS-CoV. Experiments were carried out as described in Fig. 1 C and D, except that indicated inhibitors were present during the infection period. The concentrations of inhibitors used were as follows: 1 µM or 5 µM Cat L inhibitor III, 1 µM or 5 µM CA-074, 10 µM or 30 µM E-64D, 25 nM or 50 nM BafA1, and 20 µM or 50 µM leupeptin. (A and B) Effect in 293T cells. (C and D) Effect in Caco-2 cells. In all experiments, Gluc activity was measured at 48 and 72 h after infection, and rates of relative infection were plotted by setting the values of mock infection without drugs to 100. Results were from approximately four to six independent experiments. (E and F) Effect of inhibitor treatments on cell-to-cell and cell-free infection of authentic SARS-CoV-2 (USA-WA1/2020). Note that Vero-ACE2-TMPRSS2-mTomato (Red) cells served as donor cells, and Vero-ACE2-TMPRSS2 cells served as target cells (n = 3). PV, pseudotyped virus. *P < 0.05, **P < 0.01, ***P < 0.001. ns, not significant.
Fig. 5. Endosomal entry pathway is involved in cell-to-cell transmission. Effect of endosomal entry inhibitors on cell-to-cell and cell-free infection of SARS-CoV-2 and SARS-CoV. Experiments were carried out as described in Fig. 1 C and D, except that indicated inhibitors were present during the infection period. The concentrations of inhibitors used were as follows: 1 µM or 5 µM Cat L inhibitor III, 1 µM or 5 µM CA-074, 10 µM or 30 µM E-64D, 25 nM or 50 nM BafA1, and 20 µM or 50 µM leupeptin. (A and B) Effect in 293T cells. (C and D) Effect in Caco-2 cells. In all experiments, Gluc activity was measured at 48 and 72 h after infection, and rates of relative infection were plotted by setting the values of mock infection without drugs to 100. Results were from approximately four to six independent experiments. (E and F) Effect of inhibitor treatments on cell-to-cell and cell-free infection of authentic SARS-CoV-2 (USA-WA1/2020). Note that Vero-ACE2-TMPRSS2-mTomato (Red) cells served as donor cells, and Vero-ACE2-TMPRSS2 cells served as target cells (n = 3). PV, pseudotyped virus. *P < 0.05, **P < 0.01, ***P < 0.001. ns, not significant.CC BY · PubMed Central
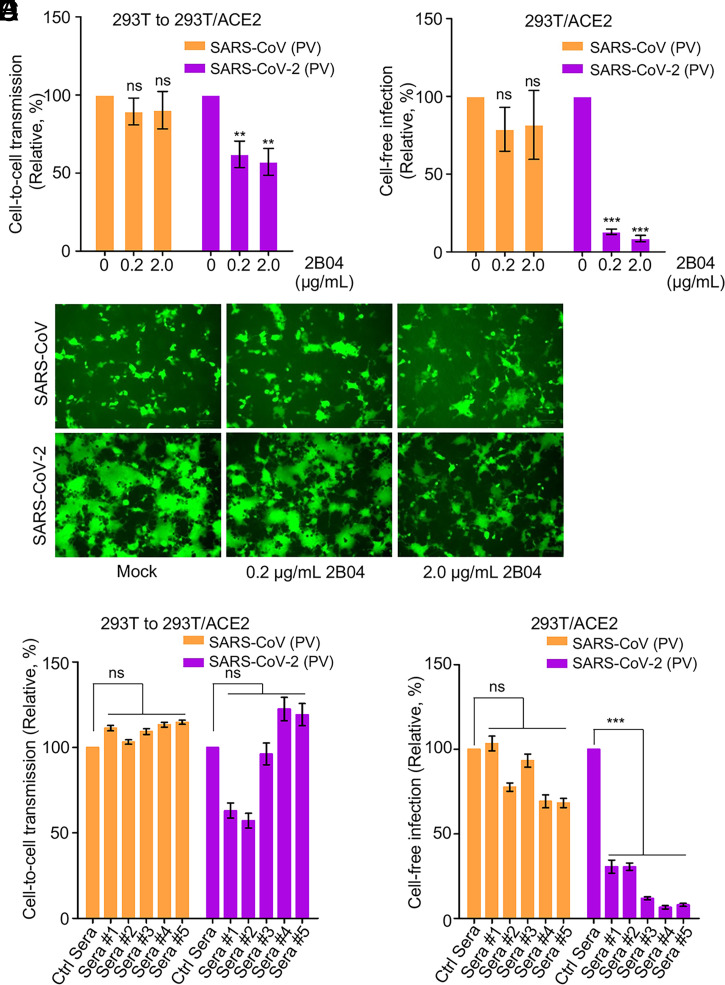
Fig. 6. Cell-to-cell transmission of SARS-CoV-2 is refractory to inhibition by neutralizing antibody and COVID-19 convalescent plasma. (A–C) Effects of SARS-CoV-2 monoclonal antibody 2B04 on cell-to-cell transmission, cell-free infection, and cell–cell fusion mediated by SARS-CoV-2 or SARS-CoV-2 spike. The experiments were carried out as described in Fig. 1 C and D, except that 0.2 µg/mL or 2 µg/mL 2B04 were included during the infection period. Relative infections were plotted by setting the values of mock infection without 2B04 to100% for statistical analyses (A and B). The photos of syncytia formation were taken at 18 h after coculture and presented (C). (D and E) Effect of COVID-19 sera on cell-to-cell and cell-free infection of SARS-CoV-2 and SARS-CoV. Experiments were performed as described as above, except five diluted COVID-19 sera were included during the infection period. Effect on cell-to-cell (D) and cell-free (E) infection of SARS-CoV or SARS-CoV-2 were summarized and plotted by setting the values of mock infection control to 100% (n = ∼3 to 4). PV, pseudotyped virus. **P < 0.01, ***P < 0.001. ns, not significant.
Fig. 6. Cell-to-cell transmission of SARS-CoV-2 is refractory to inhibition by neutralizing antibody and COVID-19 convalescent plasma. (A–C) Effects of SARS-CoV-2 monoclonal antibody 2B04 on cell-to-cell transmission, cell-free infection, and cell–cell fusion mediated by SARS-CoV-2 or SARS-CoV-2 spike. The experiments were carried out as described in Fig. 1 C and D, except that 0.2 µg/mL or 2 µg/mL 2B04 were included during the infection period. Relative infections were plotted by setting the values of mock infection without 2B04 to100% for statistical analyses (A and B). The photos of syncytia formation were taken at 18 h after coculture and presented (C). (D and E) Effect of COVID-19 sera on cell-to-cell and cell-free infection of SARS-CoV-2 and SARS-CoV. Experiments were performed as described as above, except five diluted COVID-19 sera were included during the infection period. Effect on cell-to-cell (D) and cell-free (E) infection of SARS-CoV or SARS-CoV-2 were summarized and plotted by setting the values of mock infection control to 100% (n = ∼3 to 4). PV, pseudotyped virus. **P < 0.01, ***P < 0.001. ns, not significant.CC BY · PubMed Central
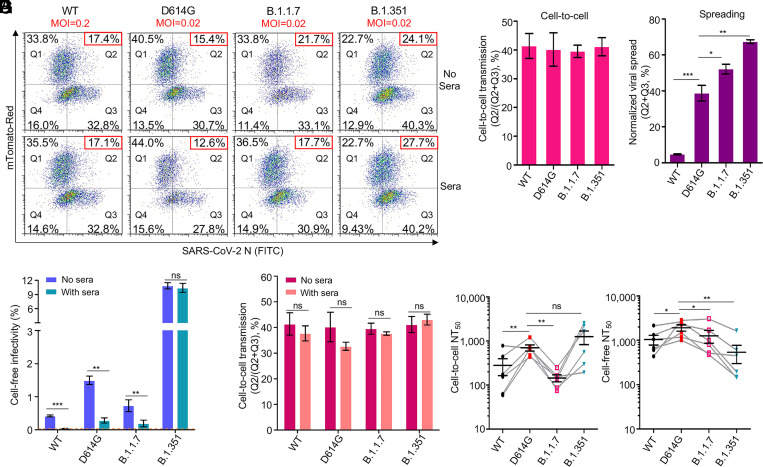
Fig. 7. Cell-to-cell transmission of SARS-CoV-2 VOCs and sensitivity to neutralization by vaccinee sera. (A–E) The cell-to-cell transmission capability of authentic SARS-CoV-2 WT, D614G, B.1.1.7, and B.1.351 in the presence or absence of vaccinee sera. Donor Vero-ACE2 cells were infected with WT SARS-CoV-2 (MOI = 0.2), D614G (MOI = 0.02), B.1.1.7 (MOI = 0.02), and B.1.351 (MOI = 0.02) for 20 h, followed by coculturing with target Vero-mTomato (Red) cells in the presence or absence of pooled mRNA vaccinee sera (three from Moderna and three from Pfizer) for 6 h. Cells were fixed and stained with anti–SARS-CoV-2 N protein and analyzed by flow cytometry. Representative flow cytometric analyses of infected cells are shown in A, with the newly infected target Vero-mTomato (Red) cells (Q2) as indicative of cell-to-cell transmission. The relative cell-to-cell transmission efficiency was calculated by dividing the rate of Vero-mTomato-Red positive cells (Q2) by the rate of total infected donor and target cells (Q2+Q3) (B, n = 3). The MOI-normalized total viral spread in both donor and target cells (Q2+Q3) is shown in C (n = 3). The supernatant from the initial 20-h infection of donor cells was used to infect target Vero-mTomato-Red cells for 6 h as the measurement of cell-free viral infectivity, either in the presence or absence of the pooled vaccinee sera, and infected cells were analyzed by flow cytometry (D) (n = 3). The pooled vaccinee sera were also added to the cocultured Vero-ACE2 and Vero-mTomato-Red cells as described in A to determine their effect on cell-to-cell transmission (E). (F and G) The calculated NT50 values of vaccine sera against cell-to-cell transmission and cell-free infection of lentiviral pseudotypes bearing individual spike of VOCs. Experimental procedures were the same as described in Fig. 6 D and E, except that all comparisons were made relative to the D614G variant (n = 6). *P < 0.05, **P < 0.01, ***P < 0.001. ns, not significant.
Fig. 7. Cell-to-cell transmission of SARS-CoV-2 VOCs and sensitivity to neutralization by vaccinee sera. (A–E) The cell-to-cell transmission capability of authentic SARS-CoV-2 WT, D614G, B.1.1.7, and B.1.351 in the presence or absence of vaccinee sera. Donor Vero-ACE2 cells were infected with WT SARS-CoV-2 (MOI = 0.2), D614G (MOI = 0.02), B.1.1.7 (MOI = 0.02), and B.1.351 (MOI = 0.02) for 20 h, followed by coculturing with target Vero-mTomato (Red) cells in the presence or absence of pooled mRNA vaccinee sera (three from Moderna and three from Pfizer) for 6 h. Cells were fixed and stained with anti–SARS-CoV-2 N protein and analyzed by flow cytometry. Representative flow cytometric analyses of infected cells are shown in A, with the newly infected target Vero-mTomato (Red) cells (Q2) as indicative of cell-to-cell transmission. The relative cell-to-cell transmission efficiency was calculated by dividing the rate of Vero-mTomato-Red positive cells (Q2) by the rate of total infected donor and target cells (Q2+Q3) (B, n = 3). The MOI-normalized total viral spread in both donor and target cells (Q2+Q3) is shown in C (n = 3). The supernatant from the initial 20-h infection of donor cells was used to infect target Vero-mTomato-Red cells for 6 h as the measurement of cell-free viral infectivity, either in the presence or absence of the pooled vaccinee sera, and infected cells were analyzed by flow cytometry (D) (n = 3). The pooled vaccinee sera were also added to the cocultured Vero-ACE2 and Vero-mTomato-Red cells as described in A to determine their effect on cell-to-cell transmission (E). (F and G) The calculated NT50 values of vaccine sera against cell-to-cell transmission and cell-free infection of lentiviral pseudotypes bearing individual spike of VOCs. Experimental procedures were the same as described in Fig. 6 D and E, except that all comparisons were made relative to the D614G variant (n = 6). *P < 0.05, **P < 0.01, ***P < 0.001. ns, not significant.CC BY · PubMed Central

Verification

Claims the paper makes

The claims and statistics of this paper haven’t been checked yet.

Run the check — free, no account needed. It reads the open-access text and checks the sources it cites.

A few free checks a day · papers already verified open instantly · results are public

Claims other papers make about this one

Each is checked against this paper’s own text: does it say what the citing paper says it does?

Self-check

Percentages, sums and reported differences re-computed from the paper’s own numbers.

The self-check needs the paper’s full text.

Citations

Cites

Show all 87 references

Research works printed but not linked: 3

  1. 10.1016/j.cell.2020.02.058 · DOI · Paper page
  2. 10.15252/embj.2020105114 · DOI
  3. 10.2307/3870221 · DOI

Cited by

Sorted by citations

See all 246

Metadata

Authors
Zeng, C., Evans, J. P., King, T., Zheng, Y.-M., Oltz, E. M., Whelan, S. P. J., Saif, L. J., Peeples, M. E., & Liu, S.-L.
Affiliations
  • The Ohio State University (US)
  • Nationwide Children's Hospital (US)
  • Washington University in St. Louis (US)
Corresponding author
Liu, Shan-Lu
Venue
Proceedings of the National Academy of Sciences
Published
2021-12-22
Volume
119
Issue
1
ISSN
  • 0027-8424 (ISSN-L)
  • 1091-6490
OpenAlex
W4206481051
Cited by
246
References
87
Citations by year
2026: 23 · 2025: 23 · 2024: 57 · 2023: 70 · 2022: 62 · 2021: 11
FWCI
15.84
Type
journal article
Language
en
Open access
Locations
  • Proceedings of the National Academy of Sciences (publishedVersion, cc-by)
  • bioRxiv (Cold Spring Harbor Laboratory) (acceptedVersion, cc-by-nc)
  • PubMed Central (publishedVersion, cc-by)
  • PubMed (publishedVersion)
  • PubMed Central (submittedVersion, cc-by-nc)
  • Digital Commons@Becker (Washington University School of Medicine) (submittedVersion, cc-by)
  • ImmPort
Funders
  • HHS | NIH | National Institute of Allergy and Infectious Diseases (AI112381, AI150473)
  • HHS | NIH | National Cancer Institute (U54CA260582)
Topics
  • Health Sciences › Medicine › Infectious Diseases › SARS-CoV-2 and COVID-19 Research
  • Health Sciences › Medicine › Infectious Diseases › COVID-19 Clinical Research Studies
  • Life Sciences › Agricultural and Biological Sciences › Animal Science and Zoology › Animal Virus Infections Studies
Keywords
SARS-CoV-2, cell-to-cell transmission, spike protein, SARS-CoV, cell-cell fusion, endosomal membrane fusion, ACE2, neutralizing antibodies, variants of concern, Alpha variant, Beta variant, virus transmission

About these checks

Registry, retraction, Cites and statistics results are computed, not judged, with one exception: a printed reference that no index lists is read once by a model before it counts as a citation error. Claims are extracted by a model and kept only when their quote appears verbatim in the text; each cited source is then checked, with a model’s help, for whether it says what the claim relies on. Those verdicts can be wrong — read the claim’s quote and the cited source before relying on one.

Statistics and arithmetic are recomputed, not judged.

Confidence bands are shown only for fields calibrated on our annotated test set. None is calibrated yet, so no band is shown.

What counts as a claim ›How we measure confidence ›How we check this ›

Are you an author, or do you see a problem with this page? Request a review