

The DOI matches its Crossref record; 3 of the 3 references it cites were found in a registry or an index.
Partial entropy decomposition reveals higher-order information structures in human brain activity
Abstract
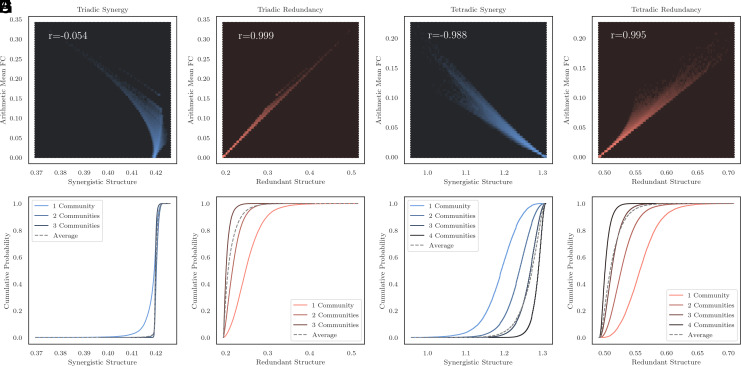
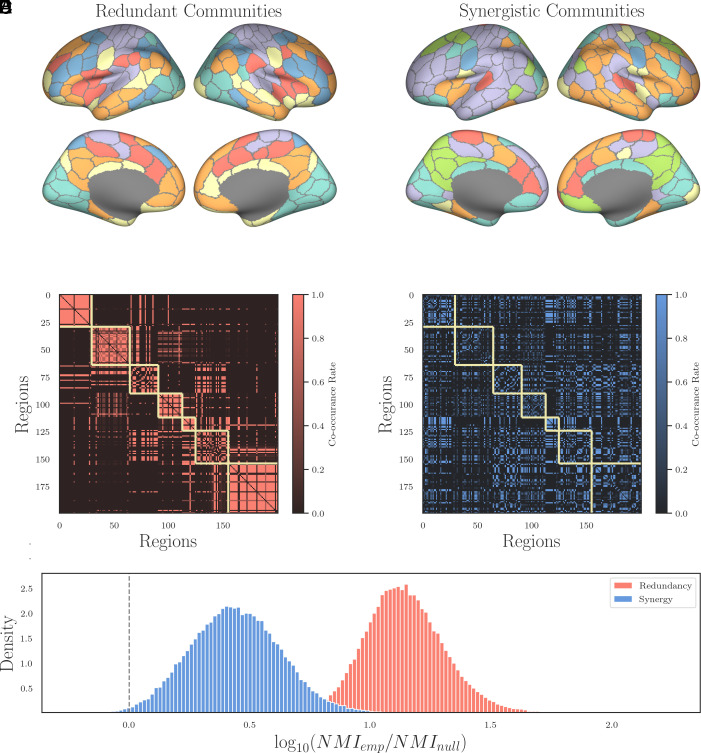
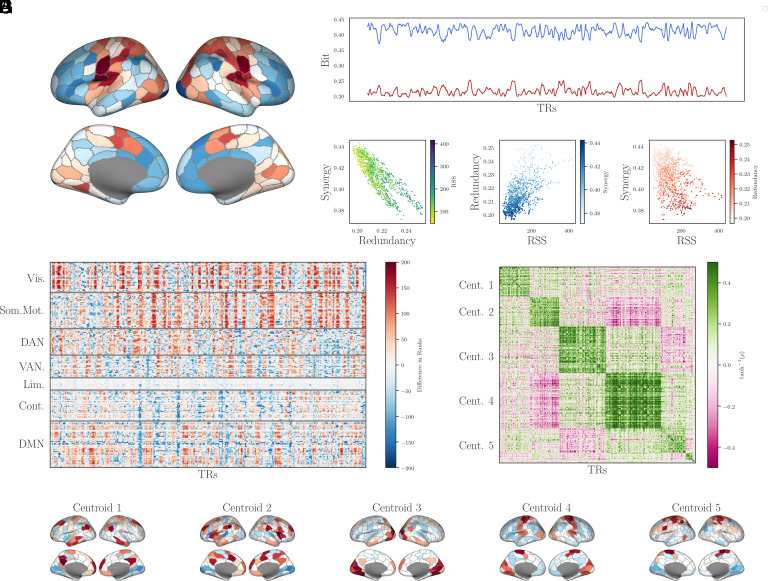
The standard approach to modeling the human brain as a complex system is with a network, where the basic unit of interaction is a pairwise link between two brain regions. While powerful, this approach is limited by the inability to assess higher-order interactions involving three or more elements directly. In this work, we explore a method for capturing higher-order dependencies in multivariate data: the partial entropy decomposition (PED). Our approach decomposes the joint entropy of the whole system into a set of nonnegative atoms that describe the redundant, unique, and synergistic interactions that compose the system’s structure. PED gives insight into the mathematics of functional connectivity and its limitation. When applied to resting-state fMRI data, we find robust evidence of higher-order synergies that are largely invisible to standard functional connectivity analyses. Our approach can also be localized in time, allowing a frame-by-frame analysis of how the distributions of redundancies and synergies change over the course of a recording. We find that different ensembles of regions can transiently change from being redundancy-dominated to synergy-dominated and that the temporal pattern is structured in time. These results provide strong evidence that there exists a large space of unexplored structures in human brain data that have been largely missed by a focus on bivariate network connectivity models. This synergistic structure is dynamic in time and likely will illuminate interesting links between brain and behavior. Beyond brain-specific application, the PED provides a very general approach for understanding higher-order structures in a variety of complex systems.
Overview
The claims and statistics of this paper haven’t been checked yet.
Run the check — free, no account needed. It reads the open-access text and checks the sources it cites.
Integrity signals
Registry
Cites
Statistics
Figures
Verification
Claims the paper makes
The claims and statistics of this paper haven’t been checked yet.
Run the check — free, no account needed. It reads the open-access text and checks the sources it cites.
Claims other papers make about this one
Each is checked against this paper’s own text: does it say what the citing paper says it does?
In the citing paper
“our analyses of real fMRI recordings with Gaussian PID confirm that previous reports of synergy in cross-area brain interactions are genuine and not due to biased estimates”
From Sampling bias corrections for discrete and Gaussian partial information decompositions (2026) · cites this paper as [95]
Self-check
Percentages, sums and reported differences re-computed from the paper’s own numbers.
The self-check needs the paper’s full text.
Citations
Cites
The Human Connectome: A Structural Description of the Human Brain
Sporns, O., Tononi, G., & Kötter, R. (2005) · PLoS Computational Biology · doi:10.1371/journal.pcbi.0010042 · Cited by 3,260
Self-citationShine, J. M., Bissett, P. G., Bell, P. T., Koyejo, O., Balsters, J. H., Gorgolewski, K. J., Moodie, C. A., & Poldrack, R. A. (2016) · Neuron · doi:10.1016/j.neuron.2016.09.018 · Cited by 886
Signature of consciousness in the dynamics of resting-state brain activity
Barttfeld, P., Uhrig, L., Sitt, J. D., Sigman, M., Jarraya, B., & Dehaene, S. (2015) · Proceedings of the National Academy of Sciences · doi:10.1073/pnas.1418031112 · Cited by 670
Research works printed but not linked: 58
- O. Sporns Networks of the Brain (MIT Press 2010). · DOI
- A. Fornito A. Zalesky E. Bullmore Fundamentals of Brain Network Analysis (Elsevier 2016).
- 10.1002/hbm.460020107 · DOI · Paper page
- 10.1073/pnas.0504136102 · DOI · Paper page
- 10.1016/j.neuroimage.2009.10.003 · DOI · Paper page
- 10.1371/journal.pbio.0020369 · DOI
- 10.1016/j.physrep.2009.11.002 · DOI · Paper page
- 10.1038/s41567-021-01371-4 · DOI
- 10.1038/s41567-022-01548-5 · DOI
- A. I. Luppi A synergistic workspace for human consciousness revealed by integrated information decomposition. bioRxiv [Preprint] (2020). https://www.biorxiv.org/content/10.1101/2020.11.25.398081v3.full (Accessed 28 March 2023). · DOI
- 10.1089/brain.2020.0982 · DOI
- P. L. Williams R. D. Beer Nonnegative decomposition of multivariate information. arXiv [Preprint] (2010). http://arxiv.org/abs/1004.2515 [math-ph physics:physics q-bio]. · arXiv
- A. J. Gutknecht, M. Wibral, A. Makkeh, Bits and pieces: Understanding information decomposition from part-whole relationships and formal logic. Proc. R. Soc. A: Math. Phys. Eng. Sci. 477, 20210110 (2021). · DOI
- R. A. A. Ince The partial entropy decomposition: Decomposing multivariate entropy and mutual information via pointwise common surprisal. arXiv [Preprint] (2017). http://arxiv.org/abs/1702.01591 [cs math q-bio stat] (Accessed 14 March 2021). · arXiv
- 10.1038/s42003-023-04843-w · DOI · Paper page
- 10.1103/PhysRevE.103.032149 · DOI
- 10.3390/e24030403 · DOI
- 10.1103/PhysRevE.100.032305 · DOI
- 10.3390/e22020216 · DOI
- T. M. Cover J. A. Thomas Elements of Information Theory (John Wiley& Sons 2012)
- O. M. Cliff, L. Novelli, B. D. Fulcher, J. M. Shine, J. T. Lizier, Assessing the significance of directed and multivariate measures of linear dependence between time series. Phys. Rev. Appl. 3, 013145 (2021).
- 10.1147/rd.41.0066 · DOI
- 10.1016/j.physleta.2011.10.066 · DOI
- 10.1063/1.3637494 · DOI
- 10.1073/pnas.91.11.5033 · DOI · Paper page
- 10.1016/j.neuroimage.2013.05.041 · DOI · Paper page
- 10.1162/netn_a_00182 · DOI
- 10.1103/PhysRevE.71.065103 · DOI
- 10.1038/s41598-018-21352-7 · DOI
- 10.1007/978-3-030-36687-2_24 · DOI
- 10.1152/jn.00338.2011 · DOI · Paper page
- 10.1038/s41593-022-01070-0 · DOI · Paper page
- 10.1073/pnas.2005531117 · DOI
- R. Betzel Hierarchical organization of spontaneous co-fluctuations in densely-sampled individuals using fMRI. Netw. Neurosci. (2023). https://doi.org/10.1162/netn_a_00321. · DOI
- J. C. Tanner et al. Synchronous high-amplitude co-fluctuations of functional brain networks during movie-watching (2022). · DOI
- 10.1073/pnas.2109380118 · DOI
- 10.1016/j.neuroimage.2022.118993 · DOI
- 10.3389/fnins.2021.787068 · DOI
- 10.1073/pnas.1314922110 · DOI · Paper page
- 10.1016/j.neuroimage.2012.02.001 · DOI
- 10.1198/000313001753272286 · DOI
- 10.1126/sciadv.aat7603 · DOI · Paper page
- 10.1136/jnnp-2014-308350 · DOI · Paper page
- 10.1016/j.neurobiolaging.2011.06.024 · DOI
- 10.1038/s41467-019-12658-9 · DOI · Paper page
- 10.1016/j.neuroimage.2022.119591 · DOI
- 10.1016/S0375-9601(97)00855-4 · DOI
- 10.3390/e25010054 · DOI
- 10.1093/ije/dyv341 · DOI
- 10.1162/netn_a_00092 · DOI
- P. Wollstadt S. Schmitt M. Wibral A rigorous information-theoretic definition of redundancy and relevancy in feature selection based on (partial) information decomposition. arXiv [Preprint] (2021). http://arxiv.org/abs/2105.04187 [cs math] (Accessed 3 June 2021). · arXiv
- T. F. Varley, E. Hoel, Emergence as the conversion of information: A unifying theory. Philos. Trans. Royal Soc.: A Math. Phys. Eng. Sci. 380, 20210150 (2022).
- 10.1038/s41467-022-34714-7 · DOI
- A. Santoro, F. Battiston, G. Petri, E. Amico, Higher-order organization of multivariate time series. Nat. Phys. 19, 221–229 (2023).
- K. Schick-Poland A partial information decomposition for discrete and continuous variables. arXiv [Preprint] (2021). http://arxiv.org/abs/2106.12393 [cs math] (Accessed 23 January 2022). · arXiv
- 10.1371/journal.pcbi.1008418 · DOI
- 10.1371/journal.pone.0282950 · DOI
- 10.3390/e24070930 · DOI
Cited by
Sorted by citations
Sampling bias corrections for discrete and Gaussian partial information decompositions
Lorenz, G. M., Engel, N. M., Koçillari, L., Celotto, M., Orsenigo, D., Curreli, S., Malerba, S. B., Engel, A. K., Kayser, C., Fellin, T., et al. (2026) · Patterns · doi:10.1016/j.patter.2026.101619 · Cited by 9
Metadata
- Authors
- Varley, T. F., Pope, M., Grazia, M., Joshua, & Sporns, O.
- Affiliations
- School of Informatics, Computing and Engineering, Indiana University, Bloomington, IN 47405
- Department of Psychological and Brain Sciences, Indiana University, Bloomington, IN 47405
- Venue
- Proceedings of the National Academy of Sciences
- Publisher
- National Academy of Sciences
- Published
- 2023-07-19
- Volume
- 120
- Issue
- 30
- ISSN
- 0027-8424
- 1091-6490
- PMC
- PMC10372615
- Cited by
- 103
- References
- 3
- Language
- en
- Funders
- National Science Foundation (1735095)
About these checks
Registry, retraction, Cites and statistics results are computed, not judged, with one exception: a printed reference that no index lists is read once by a model before it counts as a citation error. Claims are extracted by a model and kept only when their quote appears verbatim in the text; each cited source is then checked, with a model’s help, for whether it says what the claim relies on. Those verdicts can be wrong — read the claim’s quote and the cited source before relying on one.
Statistics and arithmetic are recomputed, not judged.
Confidence bands are shown only for fields calibrated on our annotated test set. None is calibrated yet, so no band is shown.
What counts as a claim ›How we measure confidence ›How we check this ›
Are you an author, or do you see a problem with this page? Request a review
