Cited by 139

The DOI matches its Crossref record.

Polarized Distribution of Endogenous Rac1 and RhoA at the Cell Surface

Michaely, Peter A., Mineo, Chieko, Ying, Yun-shu, Anderson, Richard G.W.·1999·Journal of Biological Chemistry

Overview

The claims and statistics of this paper haven’t been checked yet.

Run the check — free, no account needed. It reads the open-access text and checks the sources it cites.

A few free checks a day · papers already verified open instantly · results are public

Integrity signals

Registry

Crossref · 10.1074/jbc.274.30.21430

Cites

Statistics

Figures

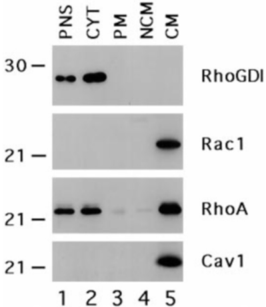
FIG. 1 Rac1, RhoA are enriched in the caveolae membrane fraction. Cell lysates from serum-starved Rat-1B fibroblasts were prepared using method 1. Postnuclear supernatant ( PNS ), cytosol ( CYT ), plasma membrane ( PM ), noncaveolae membrane ( NCM ), and caveolae membrane ( CM ) were separated by gel electrophoresis (3 m g/lane), transferred to PVDF membrane, and immunoblotted with the indicated antibodies.
FIG. 1 Rac1, RhoA are enriched in the caveolae membrane fraction. Cell lysates from serum-starved Rat-1B fibroblasts were prepared using method 1. Postnuclear supernatant ( PNS ), cytosol ( CYT ), plasma membrane ( PM ), noncaveolae membrane ( NCM ), and caveolae membrane ( CM ) were separated by gel electrophoresis (3 m g/lane), transferred to PVDF membrane, and immunoblotted with the indicated antibodies.CC-BY · From the PDF
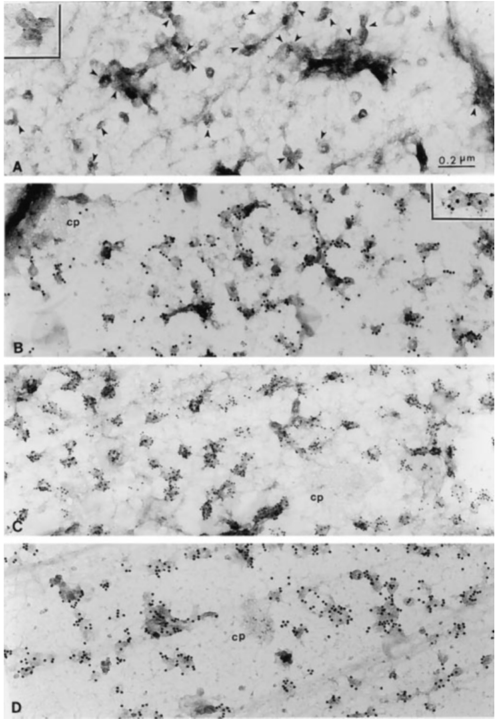
FIG. 2 Immunogold co-localization of RhoA and caveolin-1. Plasma membranes from the upper surface of normal human fibroblasts were attached to formvar-coated grids as described (11) and used in either single labeling ( A and C ) or double labeling ( B and D ) protocols. A and C , membranes were incubated for 60 min in the presence of either a RhoA mAb ( A ) or a caveolin-1 pAb ( C ) followed by gold-conjugated anti-mouse IgG (5 nm) or gold-conjugated anti-rabbit IgG (15 nm), respectively. B and D , membranes were double-labeled with a caveolin-1 pAb (15-nm gold) and a RhoA mAb (5-nm gold) ( B ) or a caveolin-1 pAb (15-nm gold) and a clathrin mAb (5 nm) ( D ) as described. Bar , 0.2 m m.
FIG. 2 Immunogold co-localization of RhoA and caveolin-1. Plasma membranes from the upper surface of normal human fibroblasts were attached to formvar-coated grids as described (11) and used in either single labeling ( A and C ) or double labeling ( B and D ) protocols. A and C , membranes were incubated for 60 min in the presence of either a RhoA mAb ( A ) or a caveolin-1 pAb ( C ) followed by gold-conjugated anti-mouse IgG (5 nm) or gold-conjugated anti-rabbit IgG (15 nm), respectively. B and D , membranes were double-labeled with a caveolin-1 pAb (15-nm gold) and a RhoA mAb (5-nm gold) ( B ) or a caveolin-1 pAb (15-nm gold) and a clathrin mAb (5 nm) ( D ) as described. Bar , 0.2 m m.CC-BY · From the PDF
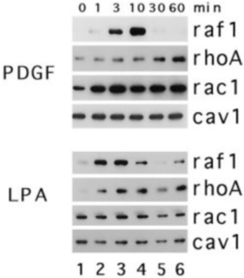
FIG. 3 Effects of PDGF and LPA on the recruitment of Rac1 and RhoA to caveolae membrane of Rat-1B cells. Serum-starved Rat-1 cells were incubated in the presence of either 20 ng/ml PDGF or 100 m M LPA in Dulbecco's modified Eagle's medium at 37 °C for the indicated times. Caveolae fractions were then prepared from cell lysates made by method 1, separated by gel electrophoresis (5 m g/lane), transferred to PVDF membrane, and immunoblotted with antibodies directed against the indicated proteins. Cav1 , caveolin-1.
FIG. 3 Effects of PDGF and LPA on the recruitment of Rac1 and RhoA to caveolae membrane of Rat-1B cells. Serum-starved Rat-1 cells were incubated in the presence of either 20 ng/ml PDGF or 100 m M LPA in Dulbecco's modified Eagle's medium at 37 °C for the indicated times. Caveolae fractions were then prepared from cell lysates made by method 1, separated by gel electrophoresis (5 m g/lane), transferred to PVDF membrane, and immunoblotted with antibodies directed against the indicated proteins. Cav1 , caveolin-1.CC-BY · From the PDF
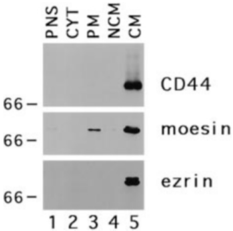
FIG. 4 Caveolae fractions are enriched in ezrin, moesin and CD44. Lysates of serum-starved normal human fibroblasts were prepared by method 1 and used to isolate postnuclear supernatant ( PNS ), cytosol ( CYT ), plasma membrane ( PM ), noncaveolae membrane ( NCM ), and caveolae membrane ( CM ) as described. Samples (5 m g/lane) of each fraction were separated by gel electrophoresis, transferred to PVDF membranes, and immunoblotted with the indicated antibodies. Equivalent results were obtained with the ezrin and moesin antibodies using fractions from Rat-1B cells. The CD44 antibody, however, did not recognize any band in Rat-1 cells.
FIG. 4 Caveolae fractions are enriched in ezrin, moesin and CD44. Lysates of serum-starved normal human fibroblasts were prepared by method 1 and used to isolate postnuclear supernatant ( PNS ), cytosol ( CYT ), plasma membrane ( PM ), noncaveolae membrane ( NCM ), and caveolae membrane ( CM ) as described. Samples (5 m g/lane) of each fraction were separated by gel electrophoresis, transferred to PVDF membranes, and immunoblotted with the indicated antibodies. Equivalent results were obtained with the ezrin and moesin antibodies using fractions from Rat-1B cells. The CD44 antibody, however, did not recognize any band in Rat-1 cells.CC-BY · From the PDF
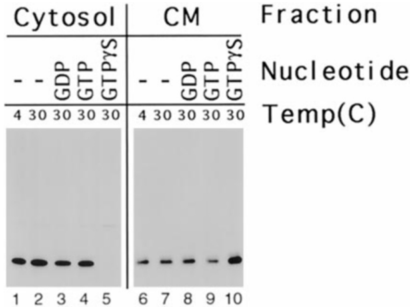
FIG. 5 GTP g S stimulates movement of RhoA from cytosol to caveolae. Cell lysates of Rat-1B cells were prepared by method 2 and divided into equal portions (1 ml). Either no additions were made to these lysates ( lanes 1 , 2 , 6 , and 7 ) or 1 mM GDP ( lanes 3 and 8 ), 1 mM GTP ( lanes 4 and 9 ), or 100 m M GTP g S ( lanes 5 and 10 ) was added, and the samples were incubated either at 4 °C ( lanes 1 and 6 ) or 30 °C ( lanes 2-5 and 7-10 ) for 30 min. Cytosol ( lanes 1-5 ) and caveolae ( lanes 6-10 ) fractions were prepared, separated by gel electrophoresis (cytosol, 50 m g/lane; caveolae, 5 m g/lane), transferred to PVDF membrane, and probed with anti-RhoA IgG.
FIG. 5 GTP g S stimulates movement of RhoA from cytosol to caveolae. Cell lysates of Rat-1B cells were prepared by method 2 and divided into equal portions (1 ml). Either no additions were made to these lysates ( lanes 1 , 2 , 6 , and 7 ) or 1 mM GDP ( lanes 3 and 8 ), 1 mM GTP ( lanes 4 and 9 ), or 100 m M GTP g S ( lanes 5 and 10 ) was added, and the samples were incubated either at 4 °C ( lanes 1 and 6 ) or 30 °C ( lanes 2-5 and 7-10 ) for 30 min. Cytosol ( lanes 1-5 ) and caveolae ( lanes 6-10 ) fractions were prepared, separated by gel electrophoresis (cytosol, 50 m g/lane; caveolae, 5 m g/lane), transferred to PVDF membrane, and probed with anti-RhoA IgG.CC-BY · From the PDF
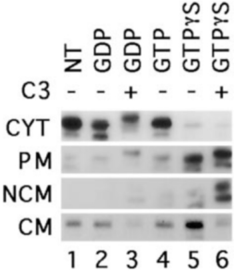
FIG. 6 Exoenzyme C3 shifts RhoA from the caveolae to the noncaveolae membrane. Cell lysates of serum-starved Rat-1 cells were prepared by method 2. The lysates were incubated in the presence ( lanes 3 and 6 ) or absence ( lanes 1 , 2 , 4 , and 5 ) of exoenzyme C3 (5 m g/ml) for 10 min at 30 °C followed by an incubation in the absence ( lane 1 ) or presence ( lanes 2-6 ) of the indicated nucleotide (1 mM GDP, 1 mM GDP, 1 mM GTP, 100 m M GTP g S) for an additional 30 min at 30 °C. The lysate was then fractionated into cytosol (50 m g/lane), plasma membrane (20 m g/lane), noncaveolae membrane (20 m g/lane), and caveolae membrane (5 m g/lane), separated by gel electrophoresis, transferred to PVDF membrane, and immunoblotted with anti-RhoA IgG. The two RhoA bands in lane 6 correspond to the ribosylated RhoA ( upper band ) and a ribosylated degradation product of RhoA (compare with the degraded and undegraded RhoA bands in plasma membrane, lane 5 ). Exposure times were as follows: cytosol, 10 s; plasma membrane, 1 min; noncaveolae membrane, 3 min; caveolae membrane, 10 s. PNS , postnuclear supernatant; CYT , cytosol; PM , plasma membrane; NCM , noncaveolae membrane; CM , caveolae membrane.
FIG. 6 Exoenzyme C3 shifts RhoA from the caveolae to the noncaveolae membrane. Cell lysates of serum-starved Rat-1 cells were prepared by method 2. The lysates were incubated in the presence ( lanes 3 and 6 ) or absence ( lanes 1 , 2 , 4 , and 5 ) of exoenzyme C3 (5 m g/ml) for 10 min at 30 °C followed by an incubation in the absence ( lane 1 ) or presence ( lanes 2-6 ) of the indicated nucleotide (1 mM GDP, 1 mM GDP, 1 mM GTP, 100 m M GTP g S) for an additional 30 min at 30 °C. The lysate was then fractionated into cytosol (50 m g/lane), plasma membrane (20 m g/lane), noncaveolae membrane (20 m g/lane), and caveolae membrane (5 m g/lane), separated by gel electrophoresis, transferred to PVDF membrane, and immunoblotted with anti-RhoA IgG. The two RhoA bands in lane 6 correspond to the ribosylated RhoA ( upper band ) and a ribosylated degradation product of RhoA (compare with the degraded and undegraded RhoA bands in plasma membrane, lane 5 ). Exposure times were as follows: cytosol, 10 s; plasma membrane, 1 min; noncaveolae membrane, 3 min; caveolae membrane, 10 s. PNS , postnuclear supernatant; CYT , cytosol; PM , plasma membrane; NCM , noncaveolae membrane; CM , caveolae membrane.CC-BY · From the PDF
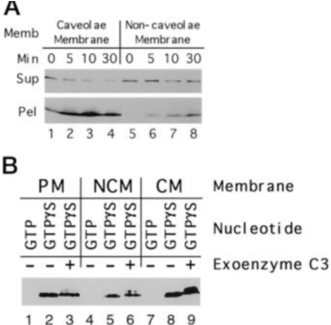
FIG. 7 Recruitment of RhoA to purified caveolae membrane. A , cell lysates from serum-starved Rat-1B cells were prepared by method 2. Cytosol, noncaveolae membrane, and caveolae membrane were isolated as described. Cytosol (250 m g) was mixed with 10 m g of either noncaveolae or caveolae membrane in buffer C and incubated for the indicated time at 30 °C. At the end of the incubation, membranes were separated from cytosol by centrifugation. The entire membrane pellet and a 40m l sample of the supernatant fraction were separated by gel electrophoresis, transferred to PVDF, and immunoblotted with antiRhoA IgG. B , cytosol (250 m g) and membranes (10 m g) were mixed and incubated in the presence ( lanes 3 , 6 , and 9 ) or absence ( lanes 1 , 2 , 4 , 5 , 7 , and 8 ) of exoenzyme C3 (5 m g) for 10 min at 30 °C before the addition of either 1 mM GTP or 100 m M GTP g S and further incubation for 30 min at 30 °C. The plasma membrane ( PM ), noncaveolae ( NCM ), and caveolae ( CM ) were isolated, separated by gel electrophoresis, transferred to PVDF membrane, and immunoblotted with anti-RhoA IgG.
FIG. 7 Recruitment of RhoA to purified caveolae membrane. A , cell lysates from serum-starved Rat-1B cells were prepared by method 2. Cytosol, noncaveolae membrane, and caveolae membrane were isolated as described. Cytosol (250 m g) was mixed with 10 m g of either noncaveolae or caveolae membrane in buffer C and incubated for the indicated time at 30 °C. At the end of the incubation, membranes were separated from cytosol by centrifugation. The entire membrane pellet and a 40m l sample of the supernatant fraction were separated by gel electrophoresis, transferred to PVDF, and immunoblotted with antiRhoA IgG. B , cytosol (250 m g) and membranes (10 m g) were mixed and incubated in the presence ( lanes 3 , 6 , and 9 ) or absence ( lanes 1 , 2 , 4 , 5 , 7 , and 8 ) of exoenzyme C3 (5 m g) for 10 min at 30 °C before the addition of either 1 mM GTP or 100 m M GTP g S and further incubation for 30 min at 30 °C. The plasma membrane ( PM ), noncaveolae ( NCM ), and caveolae ( CM ) were isolated, separated by gel electrophoresis, transferred to PVDF membrane, and immunoblotted with anti-RhoA IgG.CC-BY · From the PDF
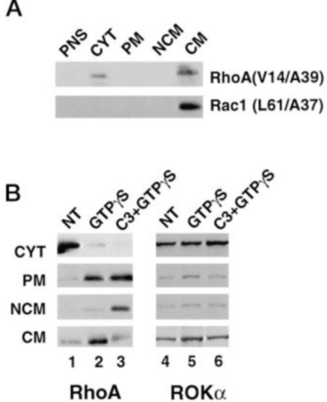
FIG. 8 Localization of RhoA and Rac1 to caveolae does not depend on effector interactions. A , Rat-1 cells were transiently transfected either with Myc-tagged RhoA (V14/A39) or Rac1 (L61/A37) cDNA. Cells were grown to confluence and fractionated into postnuclear supernatant ( PNS ), cytosol ( CYT ), plasma membrane ( PM ), noncaveolae membrane ( NCM ), or caveolae membrane ( CM ). Samples were separated and immunoblotted with a Myc mAb. B , cell lysates were prepared from Rat-1 cells and incubated in the presence of either buffer, GTP g S or C3 plus GTP g S, using the same conditions as described in the legend to Fig. 4. The lysates were fractionated, and each fraction was processed for immunoblotting with either a ROK a mAb ( lanes 4-6 ) or a RhoA mAb ( lanes 1-3 ).
FIG. 8 Localization of RhoA and Rac1 to caveolae does not depend on effector interactions. A , Rat-1 cells were transiently transfected either with Myc-tagged RhoA (V14/A39) or Rac1 (L61/A37) cDNA. Cells were grown to confluence and fractionated into postnuclear supernatant ( PNS ), cytosol ( CYT ), plasma membrane ( PM ), noncaveolae membrane ( NCM ), or caveolae membrane ( CM ). Samples were separated and immunoblotted with a Myc mAb. B , cell lysates were prepared from Rat-1 cells and incubated in the presence of either buffer, GTP g S or C3 plus GTP g S, using the same conditions as described in the legend to Fig. 4. The lysates were fractionated, and each fraction was processed for immunoblotting with either a ROK a mAb ( lanes 4-6 ) or a RhoA mAb ( lanes 1-3 ).CC-BY · From the PDF
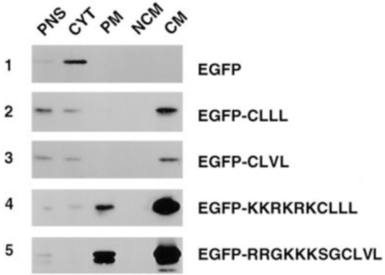
FIG. 9 Prenylation is sufficient to localize a protein to caveolae. Cells, transiently expressing EGFP, EGFP-CLVL, EGFP-CLLL, EGFP-RRGKKKCLVL, or EGFP-KKRKRKCLLL, were harvested and fractionated as described. Samples (5 m g) of postnuclear supernatant ( PNS ), cytosol ( CYT ), plasma membrane ( PM ), noncaveolae membrane ( NCM ), and caveolae membrane ( CM ) were processed for immunoblotting using a green fluorescent protein mAb.
FIG. 9 Prenylation is sufficient to localize a protein to caveolae. Cells, transiently expressing EGFP, EGFP-CLVL, EGFP-CLLL, EGFP-RRGKKKCLVL, or EGFP-KKRKRKCLLL, were harvested and fractionated as described. Samples (5 m g) of postnuclear supernatant ( PNS ), cytosol ( CYT ), plasma membrane ( PM ), noncaveolae membrane ( NCM ), and caveolae membrane ( CM ) were processed for immunoblotting using a green fluorescent protein mAb.CC-BY · From the PDF

Verification

Claims the paper makes

The claims and statistics of this paper haven’t been checked yet.

Run the check — free, no account needed. It reads the open-access text and checks the sources it cites.

A few free checks a day · papers already verified open instantly · results are public

Claims other papers make about this one

Each is checked against this paper’s own text: does it say what the citing paper says it does?

Self-check

Percentages, sums and reported differences re-computed from the paper’s own numbers.

The self-check needs the paper’s full text.

Citations

Cites

No references could be resolved yet.

Research works printed but not linked: 27

  1. Hall, 1998, Science, 279, 509, 10.1126/science.279.5350.509 · DOI
  2. Ridley, 1992, Cell, 70, 401, 10.1016/0092-8674(92)90164-8 · DOI
  3. Ridley, 1992, Cell, 70, 389, 10.1016/0092-8674(92)90163-7 · DOI
  4. Van Aelst, 1997, Genes Dev., 11, 2295, 10.1101/gad.11.18.2295 · DOI
  5. Bokoch, 1994, J. Biol. Chem., 269, 31674, 10.1016/S0021-9258(18)31748-4 · DOI
  6. Takahashi, 1997, J. Biol. Chem., 272, 23371, 10.1074/jbc.272.37.23371 · DOI
  7. Ueda, 1990, J. Biol. Chem., 265, 9373, 10.1016/S0021-9258(19)38859-3 · DOI · Paper page
  8. Tsukita, 1994, J. Cell Biol., 126, 391, 10.1083/jcb.126.2.391 · DOI
  9. Fujisawa, 1998, J. Biol. Chem., 273, 18943, 10.1074/jbc.273.30.18943 · DOI
  10. Smart, 1995, Proc. Natl. Acad. Sci. U. S. A., 92, 10104, 10.1073/pnas.92.22.10104 · DOI
  11. Sanan, 1991, J. Histochem. Cytochem., 39, 1017, 10.1177/39.8.1906908 · DOI
  12. Mineo, 1996, J. Biol. Chem., 271, 11930, 10.1074/jbc.271.20.11930 · DOI
  13. Mackay, 1997, J. Cell Biol., 138, 927, 10.1083/jcb.138.4.927 · DOI
  14. Fleming, 1996, J. Biol. Chem., 271, 33067, 10.1074/jbc.271.51.33067 · DOI
  15. Sekine, 1989, J. Biol. Chem., 264, 8602, 10.1016/S0021-9258(18)81834-8 · DOI
  16. Leung, 1996, Mol. Cell. Biol., 16, 5313, 10.1128/MCB.16.10.5313 · DOI
  17. Anderson, 1998, Annu. Rev. Biochem., 67, 199, 10.1146/annurev.biochem.67.1.199 · DOI
  18. Hirao, 1996, J. Cell Biol., 135, 37, 10.1083/jcb.135.1.37 · DOI
  19. Sargiacomo, 1993, J. Cell Biol., 122, 789, 10.1083/jcb.122.4.789 · DOI
  20. Gingras, 1998, Biochem. Biophys. Res. Commun., 247, 888, 10.1006/bbrc.1998.8885 · DOI
  21. Eggli, 1995, J. Histochem. Cytochem., 43, 689, 10.1177/43.7.7608523 · DOI
  22. Pike, 1996, J. Biol. Chem., 271, 26453, 10.1074/jbc.271.43.26453 · DOI
  23. Sehr, 1998, Biochemistry, 37, 5296, 10.1021/bi972592c · DOI
  24. Shaul, 1996, J. Biol. Chem., 271, 6518, 10.1074/jbc.271.11.6518 · DOI
  25. Mineo, 1997, J. Biol. Chem., 272, 10345, 10.1074/jbc.272.16.10345 · DOI
  26. Liu, 1996, J. Biol. Chem., 271, 10299, 10.1074/jbc.271.17.10299 · DOI
  27. Liu, 1997, Proc. Natl. Acad. Sci. U. S. A., 94, 13666, 10.1073/pnas.94.25.13666 · DOI

Cited by

See all 139

Metadata

Authors
Michaely, P. A., Mineo, C., Ying, Y.-S., & Anderson, R. G. W.
Venue
Journal of Biological Chemistry
Publisher
Elsevier BV
Published
1999-07
Volume
274
Issue
30
Pages
21430-21436
ISSN
0021-9258
Cited by
139
References
0
Language
en

About these checks

Registry, retraction, Cites and statistics results are computed, not judged, with one exception: a printed reference that no index lists is read once by a model before it counts as a citation error. Claims are extracted by a model and kept only when their quote appears verbatim in the text; each cited source is then checked, with a model’s help, for whether it says what the claim relies on. Those verdicts can be wrong — read the claim’s quote and the cited source before relying on one.

Statistics and arithmetic are recomputed, not judged.

Confidence bands are shown only for fields calibrated on our annotated test set. None is calibrated yet, so no band is shown.

What counts as a claim ›How we measure confidence ›How we check this ›

Are you an author, or do you see a problem with this page? Request a review

How to cite

Cite CoChat for the checks on this page, and the paper for its own findings.

This page
CoChat. (2026). Citation check: Polarized Distribution of Endogenous Rac1 and RhoA at the Cell Surface. https://app.cochat.ai/papers/10.1074/jbc.274.30.21430
The paper
Michaely, P. A., Mineo, C., Ying, Y.-S., & Anderson, R. G. W. (1999). Polarized Distribution of Endogenous Rac1 and RhoA at the Cell Surface. Journal of Biological Chemistry. https://doi.org/10.1074/jbc.274.30.21430