

The DOI matches its Crossref record; 5 of the 5 references it cites were found in a registry or an index.
Liquid–liquid phase separation of tau protein: The crucial role of electrostatic interactions
Overview
The claims and statistics of this paper haven’t been checked yet.
Run the check — free, no account needed. It reads the open-access text and checks the sources it cites.
Integrity signals
Registry
Cites
Statistics
Figures
Verification
Claims the paper makes
The claims and statistics of this paper haven’t been checked yet.
Run the check — free, no account needed. It reads the open-access text and checks the sources it cites.
Claims other papers make about this one
Each is checked against this paper’s own text: does it say what the citing paper says it does?
In the citing paper
“However, the molecular determinants of tau phase separation remain unclear.”
From A Proline-Rich-Domain-Binding Single Domain Antibody Selectively Inhibits RNA-Induced Phase Separation of Tau (2026) · cites this paper as [15]
In the citing paper
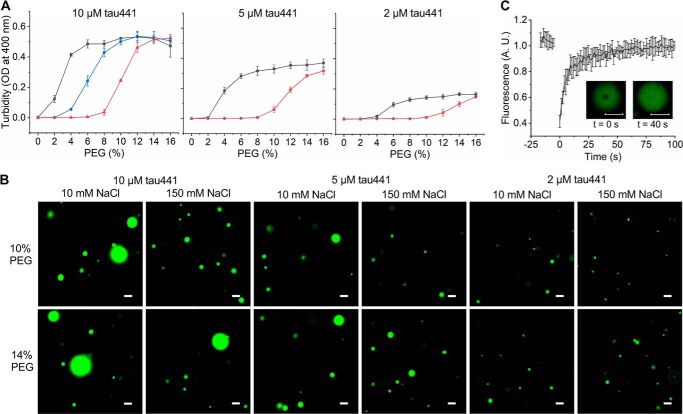
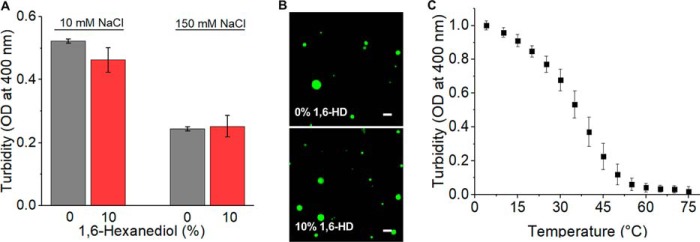
“We demonstrated that tau phase separation in the presence of PEG is modulated by NaCl under the conditions of this study, as previously shown, but not by hexanediol.15”
From A Proline-Rich-Domain-Binding Single Domain Antibody Selectively Inhibits RNA-Induced Phase Separation of Tau (2026) · cites this paper as [15]
In the citing paper
“We demonstrated that tau phase separation in the presence of PEG is modulated by NaCl under the conditions of this study, as previously shown, but not by hexanediol.15”
From A Proline-Rich-Domain-Binding Single Domain Antibody Selectively Inhibits RNA-Induced Phase Separation of Tau (2026) · cites this paper as [15]
In the citing paper
“Tau:RNA coacervates assemble via electrostatic interactions between positive charges in Tau and negative charges in RNA molecules (Lin et al, 2019) or between oppositely charged Tau domains (Boyko et al, 2019), which infers a sensitivity to the ion concentration in the buffer system.”
From Molecular crowding and RNA synergize to promote phase separation, microtubule interaction, and seeding of Tau condensates (2022) · cites this paper as Boyko et al, 2019
Self-check
Percentages, sums and reported differences re-computed from the paper’s own numbers.
The self-check needs the paper’s full text.
Citations
Cites
Tau-mediated neurodegeneration in Alzheimer’s disease and related disorders
Ballatore, C., Lee, V. M.-Y., & Trojanowski, J. Q. (2007) · Nature Reviews Neuroscience · doi:10.1038/nrn2194 · Cited by 2,174
Ambadipudi, S., Biernat, J., Riedel, D., Mandelkow, E., & Zweckstetter, M. (2017) · Nature Communications · doi:10.1038/s41467-017-00480-0 · Cited by 782
Local Nucleation of Microtubule Bundles through Tubulin Concentration into a Condensed Tau Phase
Hernández-Vega, A., Braun, M., Scharrel, L., Jahnel, M., Wegmann, S., Hyman, B. T., Alberti, S., Diez, S., & Hyman, A. A. (2017) · Cell Reports · doi:10.1016/j.celrep.2017.08.042 · Cited by 395 · cited 3×
“Nevertheless, a remarkable finding of one of these studies (which was based solely on microscopic observations) was that LLPS of Sf9 cell– derived tau is inhibited by hexanediol and shows very high resistance to salts, suggesting a major role of hydrophobic interactions (11) (even though salt sensitivity was reported…”
Relationship of sequence and phase separation in protein low-complexity regions
Martin, E. W., & Mittag, T. (2018) · Biochemistry · doi:10.1021/acs.biochem.8b00008 · Cited by 389
Acetylation Disfavors Tau Phase Separation
Ferreon, J. C., Jain, A., Choi, K.-J., Tsoi, P. S., MacKenzie, K. R., Jung, S. Y., & Ferreon, A. C. (2018) · International Journal of Molecular Sciences · doi:10.3390/ijms19051360 · Cited by 183
Research works printed but not linked: 28
- Mandelkow, 2012, Biochemistry and cell biology of Tau protein in neurofibrillary degeneration, Cold Spring Harb. Perspect. Med, 2, a006247, 10.1101/cshperspect.a006247 · DOI
- Wang, 2016, Tau in physiology and pathology, Nat. Rev. Neurosci, 17, 5, 10.1038/nrn.2015.1 · DOI · Paper page
- Guo, 2017, Roles of tau protein in health and disease, Acta Neuropathol, 133, 665, 10.1007/s00401-017-1707-9 · DOI · Paper page
- Banani, 2017, Biomolecular condensates: organizers of cellular biochemistry, Nat. Rev. Mol. Cell Biol, 18, 285, 10.1038/nrm.2017.7 · DOI
- Shin, 2017, Liquid phase condensation in cell physiology and disease, Science, 357, eaaf4382, 10.1126/science.aaf4382 · DOI
- Uversky, 2017, Protein intrinsic disorder-based liquid–liquid phase transitions in biological systems: complex coacervates and membrane-less organelles, Adv. Colloid Interface Sci, 239, 97, 10.1016/j.cis.2016.05.012 · DOI
- Boeynaems, 2018, Protein phase separation: a new phase in cell biology, Trends Cell Biol, 28, 420, 10.1016/j.tcb.2018.02.004 · DOI
- Nedelsky, 2019, Bridging biophysics and neurology: aberrant phase transitions in neurodegenerative disease, Nat. Rev. Neurol, 15, 272, 10.1038/s41582-019-0157-5 · DOI
- Elbaum-Garfinkle, 2019, Matter over mind: liquid phase separation and neurodegeneration, J. Biol. Chem, 294, 7160, 10.1074/jbc.REV118.001188 · DOI
- Wegmann, 2018, Tau protein liquid–liquid phase separation can initiate tau aggregation, EMBO J, 37, e98049, 10.15252/embj.201798049 · DOI · Paper page
- Zhang, 2017, RNA stores tau reversibly in complex coacervates, PLoS Biol, 15, e2002183, 10.1371/journal.pbio.2002183 · DOI · Paper page
- Lin, 2018, Narrow equilibrium window for complex coacervation of tau and RNA under cellular conditions, Elife, 8, e42571, 10.7554/eLife.42571 · DOI · Paper page
- Molliex, 2015, Phase separation by low complexity domains promotes stress granule assembly and drives pathological fibrillization, Cell, 163, 123, 10.1016/j.cell.2015.09.015 · DOI · Paper page
- Lin, 2015, Formation and maturation of phase-separated liquid droplets by RNA-binding proteins, Mol. Cell, 60, 208, 10.1016/j.molcel.2015.08.018 · DOI
- Babinchak, 2019, The role of liquid-liquid phase separation in aggregation of the TDP-43 low complexity domain, J. Biol. Chem, 294, 6306, 10.1074/jbc.RA118.007222 · DOI
- Fulton, 1982, How crowded is the cytoplasm?, Cell, 30, 345, 10.1016/0092-8674(82)90231-8 · DOI · Paper page
- Kroschwald, 2015, Promiscuous interactions and protein disaggregases determine the material state of stress-inducible RNP granules, Elife, 4, e06807, 10.7554/eLife.06807 · DOI
- Li, 2018, The physical forces mediating self-association and phase-separation in the C-terminal domain of TDP-43, Biochim. Biophys. Acta Proteins Proteomics, 1866, 214, 10.1016/j.bbapap.2017.10.001 · DOI
- Ribbeck, 2002, The permeability barrier of nuclear pore complexes appears to operate via hydrophobic exclusion, EMBO J, 21, 2664, 10.1093/emboj/21.11.2664 · DOI
- Burke, 2015, Residue-by-residue view of in vitro FUS granules that bind the C-terminal domain of RNA polymerase II, Mol. Cell, 60, 231, 10.1016/j.molcel.2015.09.006 · DOI · Paper page
- Quiroz, 2015, Sequence heuristics to encode phase behaviour in intrinsically disordered protein polymers, Nat. Mater, 14, 1164, 10.1038/nmat4418 · DOI · Paper page
- Mair, 2016, FLEXITau: quantifying post-translational modifications of Tau protein in vitro and in human disease, Anal. Chem, 88, 3704, 10.1021/acs.analchem.5b04509 · DOI
- Gomes, 2019, The molecular language of membraneless organelles, J. Biol. Chem, 294, 7115, 10.1074/jbc.TM118.001192 · DOI
- Wang, 2018, A molecular grammar governing the driving forces for phase separation of prion-like RNA binding proteins, Cell, 174, 688, 10.1016/j.cell.2018.06.006 · DOI
- Zhu, 2015, Hyperphosphorylation of intrinsically disordered tau protein induces an amyloidogenic shift in its conformational ensemble, PLoS One, 10, e0120416, 10.1371/journal.pone.0120416 · DOI
- Despres, 2017, Identification of the Tau phosphorylation pattern that drives its aggregation, Proc. Natl. Acad. Sci. U.S.A, 114, 9080, 10.1073/pnas.1708448114 · DOI
- Barghorn, 2005, Purification of recombinant Tau protein and preparation of Alzheimer-paired helical filaments in vitro, Methods Mol. Biol, 299, 35
- Holehouse, 2017, CIDER: resources to analyze sequence-ensemble relationships of intrinsically disordered proteins, Biophys. J, 112, 16, 10.1016/j.bpj.2016.11.3200 · DOI
Cited by
Phase separation and neurodegenerative diseases: a disturbance in the force
Zbinden, A., Pérez-Berlanga, M., De Rossi, P., & Polymenidou, M. (2020) · Developmental Cell · doi:10.1016/j.devcel.2020.09.014 · Cited by 500
Liquid-liquid phase separation induces pathogenic tau conformations in vitro
Kanaan, N. M., Hamel, C., Grabinski, T., & Combs, B. (2020) · Nature Communications · doi:10.1038/s41467-020-16580-3 · Cited by 397
Mechanisms of secretion and spreading of pathological tau protein
Brunello, C. A., Merezhko, M., Uronen, R.-L., & Huttunen, H. J. (2020) · Cellular and Molecular Life Sciences · doi:10.1007/s00018-019-03349-1 · Cited by 304
Saito, T., Mihira, N., Matsuba, Y., Sasaguri, H., Hashimoto, S., Narasimhan, S., Zhang, B., Murayama, S., Higuchi, M., Lee, V. M. Y., et al. (2019) · Journal of Biological Chemistry · doi:10.1074/jbc.ra119.009487 · Cited by 248
Hochmair, J., Exner, C., Franck, M., Dominguez‐Baquero, A., Diez, L., Brognaro, H., Kraushar, M. L., Mielke, T., Radbruch, H., Kaniyappan, S., et al. (2022) · The EMBO Journal · doi:10.15252/embj.2021108882 · Cited by 106
Metadata
- Authors
- Boyko, S., Qi, X., Chen, T.-H., Surewicz, K., & Surewicz, W. K.
- Venue
- Journal of Biological Chemistry
- Publisher
- Elsevier BV
- Published
- 2019-07
- Volume
- 294
- Issue
- 29
- Pages
- 11054-11059
- ISSN
- 0021-9258
- PMC
- PMC6643045
- Cited by
- 271
- References
- 5
- Language
- en
- Funders
- HHS | National Institutes of Health (NIH) (RF1 AG061797)
About these checks
Registry, retraction, Cites and statistics results are computed, not judged, with one exception: a printed reference that no index lists is read once by a model before it counts as a citation error. Claims are extracted by a model and kept only when their quote appears verbatim in the text; each cited source is then checked, with a model’s help, for whether it says what the claim relies on. Those verdicts can be wrong — read the claim’s quote and the cited source before relying on one.
Statistics and arithmetic are recomputed, not judged.
Confidence bands are shown only for fields calibrated on our annotated test set. None is calibrated yet, so no band is shown.
What counts as a claim ›How we measure confidence ›How we check this ›
Are you an author, or do you see a problem with this page? Request a review
Data sources
Bibliographic data: Semantic Scholar, OpenAlex, Crossref.
Contains information from the Semantic Scholar Academic Graph Datasets, made available under the ODC Attribution License (ODC-BY 1.0).
Semantic Scholar’s data is described in: Kinney, R., et al. (2023). The Semantic Scholar Open Data Platform. arXiv:2301.10140.
