Student or educator? Sign up with your school email and get 6 months of Pro free.
Cited by 27

The DOI matches its Crossref record; 69 of the 69 references it cites were found in a registry or an index.

A Novel Heme Protein, the Cu,Zn-Superoxide Dismutase from Haemophilus ducreyi

Pacello, Francesca, Langford, Paul R., Kroll, J. Simon, Indiani, Chiara, Smulevich, Giulietta, Desideri, Alessandro, Rotilio, Giuseppe, Battistoni, Andrea·2001·Journal of Biological Chemistry

Abstract

Haemophilus ducreyi, the causative agent of the genital ulcerative disease known as chancroid, is unable to synthesize heme, which it acquires from humans, its only known host. Here we provide evidence that the periplasmic Cu,Zn-superoxide dismutase from this organism is a heme-binding protein, unlike all the other known Cu,Zn-superoxide dismutases from bacterial and eukaryotic species. When the H. ducreyi enzyme was expressed in Escherichia coli cells grown in standard LB medium, it contained only limited amounts of heme covalently bound to the polypeptide but was able efficiently to bind exogenously added hemin. Resonance Raman and electronic spectra at neutral pH indicate that H. ducreyi Cu,Zn-superoxide dismutase contains a 6-coordinated low spin heme, with two histidines as the most likely axial ligands. By site-directed mutagenesis and analysis of a structural model of the enzyme, we identified as a putative axial ligand a histidine residue (His-64) that is present only in the H. ducreyi enzyme and that was located at the bottom of the dimer interface. The introduction of a histidine residue in the corresponding position of the Cu,Zn-superoxide dismutase from Haemophilus parainfluenzae was not sufficient to confer the ability to bind heme, indicating that other residues neighboring His-64 are involved in the formation of the heme-binding pocket. Our results suggest that periplasmic Cu,Zn-superoxide dismutase plays a role in heme metabolism of H. ducreyi and provide further evidence for the structural flexibility of bacterial enzymes of this class.

Overview

The claims and statistics of this paper haven’t been checked yet.

Run the check — free, no account needed. It reads the open-access text and checks the sources it cites.

A few free checks a day · papers already verified open instantly · results are public

Integrity signals

Registry

Crossref · 10.1074/jbc.m010488200

Cites

69 of 69 references verified0 citation errors · 0 not checkable

Statistics

Figures

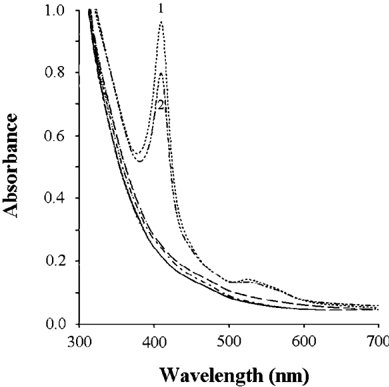
FIG. 1 Visible absorption spectra of periplasmic extracts from E. coli 71/18. Extracts were prepared from 3 × 10 10 cells bearing plasmids pIT4, pJSK326, pEMBL18, pPEcSOD81A, and pPHpSOD. The only two extracts showing the presence of large amounts of heme were those obtained from cells bearing pIT4 ( spectrum 1 ) and pJSK326 ( spectrum 2 ). The absorption spectra of extracts from cells expressing E. coli or H. parainfluenzae Cu,Zn-SODs were superimposable to those of control cells (bearing pEMBL18) expressing no Cu,Zn-SOD. Similarly, the extracts from cells expressing other prokaryotic ( H. influenzae , P. leiognathi , and S. typhimurium ) or eukaryotic ( X. laevis B and H. sapiens ) Cu,Zn-SODs showed no evidence of heme accumulation and were not included.
FIG. 1 Visible absorption spectra of periplasmic extracts from E. coli 71/18. Extracts were prepared from 3 × 10 10 cells bearing plasmids pIT4, pJSK326, pEMBL18, pPEcSOD81A, and pPHpSOD. The only two extracts showing the presence of large amounts of heme were those obtained from cells bearing pIT4 ( spectrum 1 ) and pJSK326 ( spectrum 2 ). The absorption spectra of extracts from cells expressing E. coli or H. parainfluenzae Cu,Zn-SODs were superimposable to those of control cells (bearing pEMBL18) expressing no Cu,Zn-SOD. Similarly, the extracts from cells expressing other prokaryotic ( H. influenzae , P. leiognathi , and S. typhimurium ) or eukaryotic ( X. laevis B and H. sapiens ) Cu,Zn-SODs showed no evidence of heme accumulation and were not included.CC-BY · From the PDF
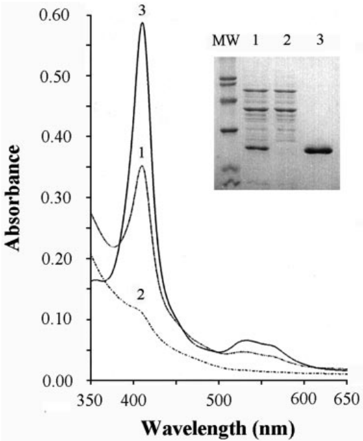
FIG. 2 Affinity purification of H. ducreyi Cu,Zn-SOD. Electronic absorption spectra in the visible region of periplasmic extract from E. coli 71/18 expressing H. ducreyi Cu,Zn-SOD ( lane 1 ), flow-through eluate of the same periplasmic extract loaded onto a Ni-NTA column ( lane 2 ), and affinity-purified protein ( lane 3 ) are shown. The inset shows an SDS-PAGE analysis of the same samples. MW , molecular weight markers.
FIG. 2 Affinity purification of H. ducreyi Cu,Zn-SOD. Electronic absorption spectra in the visible region of periplasmic extract from E. coli 71/18 expressing H. ducreyi Cu,Zn-SOD ( lane 1 ), flow-through eluate of the same periplasmic extract loaded onto a Ni-NTA column ( lane 2 ), and affinity-purified protein ( lane 3 ) are shown. The inset shows an SDS-PAGE analysis of the same samples. MW , molecular weight markers.CC-BY · From the PDF
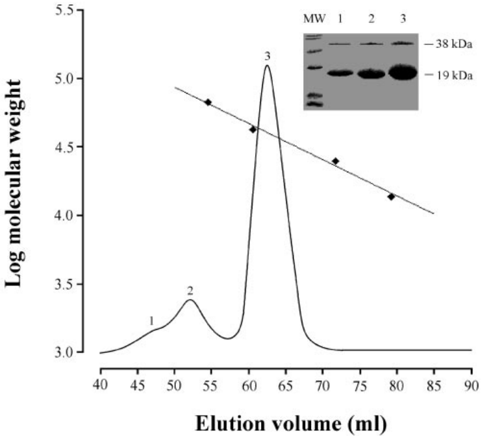
FIG. 3 Elution profile of affinity-purified H. ducreyi Cu,ZnSOD. The protein purified by Ni-NTA chromatography was injected on to an HiLoad TM 16/60 Superdex TM 75 gel filtration FPLC column calibrated with the following molecular weight markers (indicated by black squares ): bovine serum albumin (67,000 Da), ovalbumin (43,000 Da), chymotrypsinogen A (25,000 Da), and ribonuclease A (13,700 Da). Proteins present in all the major peaks (numbered from 1 to 3 ) were analyzed by SDS-PAGE on a 15% gel ( inset ).
FIG. 3 Elution profile of affinity-purified H. ducreyi Cu,ZnSOD. The protein purified by Ni-NTA chromatography was injected on to an HiLoad TM 16/60 Superdex TM 75 gel filtration FPLC column calibrated with the following molecular weight markers (indicated by black squares ): bovine serum albumin (67,000 Da), ovalbumin (43,000 Da), chymotrypsinogen A (25,000 Da), and ribonuclease A (13,700 Da). Proteins present in all the major peaks (numbered from 1 to 3 ) were analyzed by SDS-PAGE on a 15% gel ( inset ).CC-BY · From the PDF
Image 4
CC-BY · From the PDF
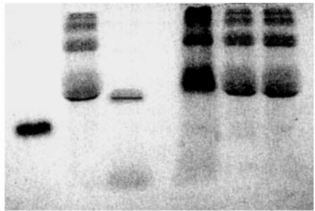
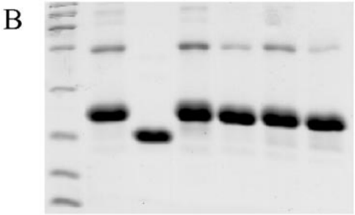
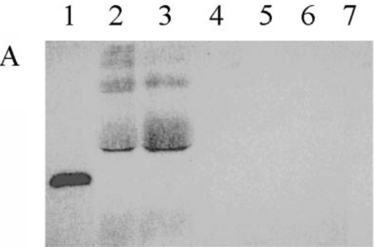
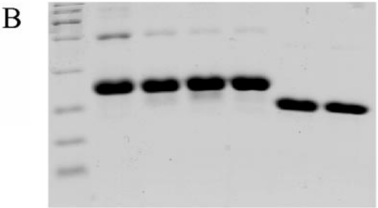
FIG. 4 Heme binding to Cu,Zn-SOD. A, staining for heme-dependent peroxidase activity of purified Cu,Zn-SODs. Lane 1, cytochrome c ; lane 2, affinity-purified H. ducreyi Cu,Zn-SOD isolated from E. coli 71/18; lane 3, N-terminal deleted Cu,Zn-SOD purified from E. coli 71/18 cells; lane 4, affinity-purified H. ducreyi Cu,Zn-SOD isolated from E. coli H500 cells; lane 5, affinity-purified H. ducreyi Cu,Zn-SOD isolated from E. coli H500 cells incubated with hemin; lane 6, affinity-purified H. ducreyi Cu,Zn-SOD isolated from E. coli MC1061; and lane 7, affinity-purified H. ducreyi Cu,Zn-SOD isolated from E. coli EC06 cells. B, Coomassie Blue staining of purified H. ducreyi Cu,Zn-SODs. Lane 1, molecular weight markers; lanes 2-7 , same samples as A .
FIG. 4 Heme binding to Cu,Zn-SOD. A, staining for heme-dependent peroxidase activity of purified Cu,Zn-SODs. Lane 1, cytochrome c ; lane 2, affinity-purified H. ducreyi Cu,Zn-SOD isolated from E. coli 71/18; lane 3, N-terminal deleted Cu,Zn-SOD purified from E. coli 71/18 cells; lane 4, affinity-purified H. ducreyi Cu,Zn-SOD isolated from E. coli H500 cells; lane 5, affinity-purified H. ducreyi Cu,Zn-SOD isolated from E. coli H500 cells incubated with hemin; lane 6, affinity-purified H. ducreyi Cu,Zn-SOD isolated from E. coli MC1061; and lane 7, affinity-purified H. ducreyi Cu,Zn-SOD isolated from E. coli EC06 cells. B, Coomassie Blue staining of purified H. ducreyi Cu,Zn-SODs. Lane 1, molecular weight markers; lanes 2-7 , same samples as A .CC-BY · From the PDF
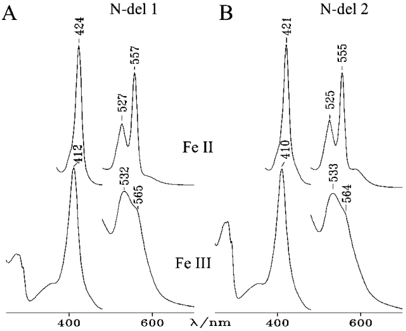
FIG. 5 Electronic absorption spectra of N-deleted Cu,Zn-SOD. Samples isolated from E. coli 71/18 cells grown in hemin-enriched media (N-del 1) ( A ) and from E. coli cells grown in standard LB medium (N-del 2) ( B ) are shown in their oxidized ( bottom ) and reduced ( top ) forms. The visible region of the reduced and oxidized spectra have been expanded 5- and 8-fold, respectively.
FIG. 5 Electronic absorption spectra of N-deleted Cu,Zn-SOD. Samples isolated from E. coli 71/18 cells grown in hemin-enriched media (N-del 1) ( A ) and from E. coli cells grown in standard LB medium (N-del 2) ( B ) are shown in their oxidized ( bottom ) and reduced ( top ) forms. The visible region of the reduced and oxidized spectra have been expanded 5- and 8-fold, respectively.CC-BY · From the PDF
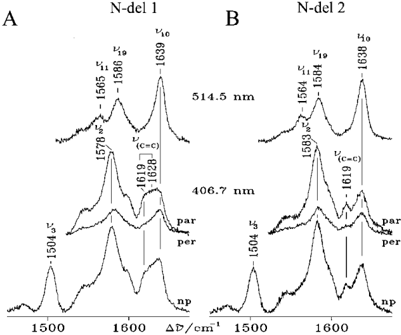
FIG. 6 Resonance Raman spectra of N-deleted Cu,Zn-SOD. Resonance Raman spectra in the high frequency region of ferric N-del 1 ( A ) and N-del 2 ( B ) taken with 406.7 and 514.5 nm and in polarized light. Experimental conditions, 5 cm -1 resolution. A , 406.7 nm , 15 milliwatt laser power at the sample; np, non-polarized, 38 s/0.5 cm -1 collection interval; par, parallel polarization, 30 s/0.5 cm -1 collection interval; per, perpendicular polarization, 40 s/0.5 cm -1 collection interval; 514.5 nm, 75-milliwatt laser power at the sample, 15 s/0.5 cm -1 collection interval. B , 406.7 nm , 15-milliwatt laser power at the sample; non-polarized , 23 s/0.5 cm -1 collection interval; parallel polarization, 35 s/0.5 cm -1 collection interval; perpendicular polarization, 45 s/0.5 cm -1 collection interval; 514.5 nm , 75-milliwatt laser power at the sample, 10 s/0.5 cm -1 collection interval.
FIG. 6 Resonance Raman spectra of N-deleted Cu,Zn-SOD. Resonance Raman spectra in the high frequency region of ferric N-del 1 ( A ) and N-del 2 ( B ) taken with 406.7 and 514.5 nm and in polarized light. Experimental conditions, 5 cm -1 resolution. A , 406.7 nm , 15 milliwatt laser power at the sample; np, non-polarized, 38 s/0.5 cm -1 collection interval; par, parallel polarization, 30 s/0.5 cm -1 collection interval; per, perpendicular polarization, 40 s/0.5 cm -1 collection interval; 514.5 nm, 75-milliwatt laser power at the sample, 15 s/0.5 cm -1 collection interval. B , 406.7 nm , 15-milliwatt laser power at the sample; non-polarized , 23 s/0.5 cm -1 collection interval; parallel polarization, 35 s/0.5 cm -1 collection interval; perpendicular polarization, 45 s/0.5 cm -1 collection interval; 514.5 nm , 75-milliwatt laser power at the sample, 10 s/0.5 cm -1 collection interval.CC-BY · From the PDF
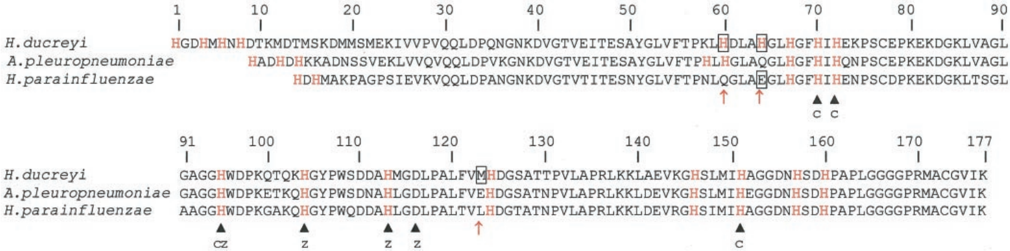
FIG. 7 Alignment of amino acid sequences of H. ducreyi , A. pleuropneumoniae, and H. parainfluenzae Cu,Zn-SODs. The amino acid numbering of H. ducreyi Cu,Zn-SOD, shown on the top line , is used as reference. All histidine residues are highlighted in red , and black arrows mark copper and zinc ligands, indicated by C and Z , respectively. Boxes and red arrows mark the amino acids that have been mutated in this work.
FIG. 7 Alignment of amino acid sequences of H. ducreyi , A. pleuropneumoniae, and H. parainfluenzae Cu,Zn-SODs. The amino acid numbering of H. ducreyi Cu,Zn-SOD, shown on the top line , is used as reference. All histidine residues are highlighted in red , and black arrows mark copper and zinc ligands, indicated by C and Z , respectively. Boxes and red arrows mark the amino acids that have been mutated in this work.CC-BY · From the PDF
FIG. 8 His-64 is required for heme binding. A, staining for hemedependent peroxidase activity of purified wild type and mutant Cu,ZnSODs. Lane 1, cytochrome c ; lane 2, wild type H. ducreyi Cu,Zn-SOD; lane 3, His-60 3 Gln mutant; lane 4, His-60 3 Gln,His-64 3 Glu double mutant; lane 5, His-64 3 Glu mutant; lane 6, wild type H. parainfluenzae Cu,Zn-SOD; and lane 7, Glu-64 3 His mutant H. parainfluenzae Cu,ZnSOD. B, Coomassie Blue staining of the same samples loaded in gel A. Lane 1 contains molecular weight markers in place of cytochrome c.
FIG. 8 His-64 is required for heme binding. A, staining for hemedependent peroxidase activity of purified wild type and mutant Cu,ZnSODs. Lane 1, cytochrome c ; lane 2, wild type H. ducreyi Cu,Zn-SOD; lane 3, His-60 3 Gln mutant; lane 4, His-60 3 Gln,His-64 3 Glu double mutant; lane 5, His-64 3 Glu mutant; lane 6, wild type H. parainfluenzae Cu,Zn-SOD; and lane 7, Glu-64 3 His mutant H. parainfluenzae Cu,ZnSOD. B, Coomassie Blue staining of the same samples loaded in gel A. Lane 1 contains molecular weight markers in place of cytochrome c.CC-BY · From the PDF
Image 10
CC-BY · From the PDF
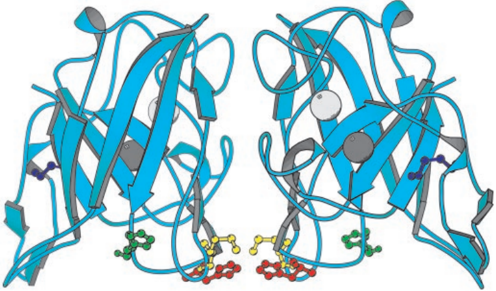
FIG. 9 Molecular model of H. ducreyi Cu,Zn-SOD. His-64 is shown in red , His-60 in green, the disulfide bond in blue, and Met-123 in yellow. The spheres present in each enzyme subunit indicate the position occupied by the zinc ( pale gray ) and copper ion ( dark gray ), respectively. This enzyme view emphasizes the highly symmetrical structure of bacterial Cu,Zn-SOD. It should be noted, however, that while the two His-64 residues are at a distance of about 3 Å, the two Met-123 residues are more than 10 Å from each other.
FIG. 9 Molecular model of H. ducreyi Cu,Zn-SOD. His-64 is shown in red , His-60 in green, the disulfide bond in blue, and Met-123 in yellow. The spheres present in each enzyme subunit indicate the position occupied by the zinc ( pale gray ) and copper ion ( dark gray ), respectively. This enzyme view emphasizes the highly symmetrical structure of bacterial Cu,Zn-SOD. It should be noted, however, that while the two His-64 residues are at a distance of about 3 Å, the two Met-123 residues are more than 10 Å from each other.CC-BY · From the PDF

Verification

Claims the paper makes

The claims and statistics of this paper haven’t been checked yet.

Run the check — free, no account needed. It reads the open-access text and checks the sources it cites.

A few free checks a day · papers already verified open instantly · results are public

Claims other papers make about this one

Each is checked against this paper’s own text: does it say what the citing paper says it does?

Self-check

Percentages, sums and reported differences re-computed from the paper’s own numbers.

The self-check needs the paper’s full text.

Citations

Cites

Show all 69 references

Research works printed but not linked: 2

  1. Langford, 1997, FEMS Immunol. Med. Microbiol., 17, 235
  2. Thony-Meyer, 1997, Microbiol. Mol. Biol. Rev., 61, 337

Cited by

Metadata

Authors
Pacello, F., Langford, P. R., Kroll, J. S., Indiani, C., Smulevich, G., Desideri, A., Rotilio, G., & Battistoni, A.
Venue
Journal of Biological Chemistry
Publisher
Elsevier BV
Published
2001-08
Volume
276
Issue
32
Pages
30326-30334
ISSN
0021-9258
Cited by
27
References
69
Language
en

About these checks

Registry, retraction, Cites and statistics results are computed, not judged, with one exception: a printed reference that no index lists is read once by a model before it counts as a citation error. Claims are extracted by a model and kept only when their quote appears verbatim in the text; each cited source is then checked, with a model’s help, for whether it says what the claim relies on. Those verdicts can be wrong — read the claim’s quote and the cited source before relying on one.

Statistics and arithmetic are recomputed, not judged.

Confidence bands are shown only for fields calibrated on our annotated test set. None is calibrated yet, so no band is shown.

What counts as a claim ›How we measure confidence ›How we check this ›

Are you an author, or do you see a problem with this page? Request a review

Data sources

Bibliographic data: Semantic Scholar, OpenAlex, Crossref.

Contains information from the Semantic Scholar Academic Graph Datasets, made available under the ODC Attribution License (ODC-BY 1.0).

Semantic Scholar’s data is described in: Kinney, R., et al. (2023). The Semantic Scholar Open Data Platform. arXiv:2301.10140.