Student or educator? Sign up with your school email and get 6 months of Pro free.
Cited by 290

The DOI matches its Crossref record; 1 of the 1 references it cites were found in a registry or an index.

The YTH Domain Is a Novel RNA Binding Domain

Zhang, Zhaiyi, Theler, Dominik, Kaminska, Katarzyna H., Hiller, Michael, de la Grange, Pierre, Pudimat, Rainer, Rafalska, Ilona, Heinrich, Bettina, Bujnicki, Janusz M., Allain, Frédéric H.-T., Stamm, Stefan·2010·Journal of Biological Chemistry

Overview

The claims and statistics of this paper haven’t been checked yet.

Run the check — free, no account needed. It reads the open-access text and checks the sources it cites.

A few free checks a day · papers already verified open instantly · results are public

Integrity signals

Registry

Crossref · 10.1074/jbc.m110.104711

Cites

1 of 1 references verified0 citation errors · 0 not checkable

Statistics

Figures

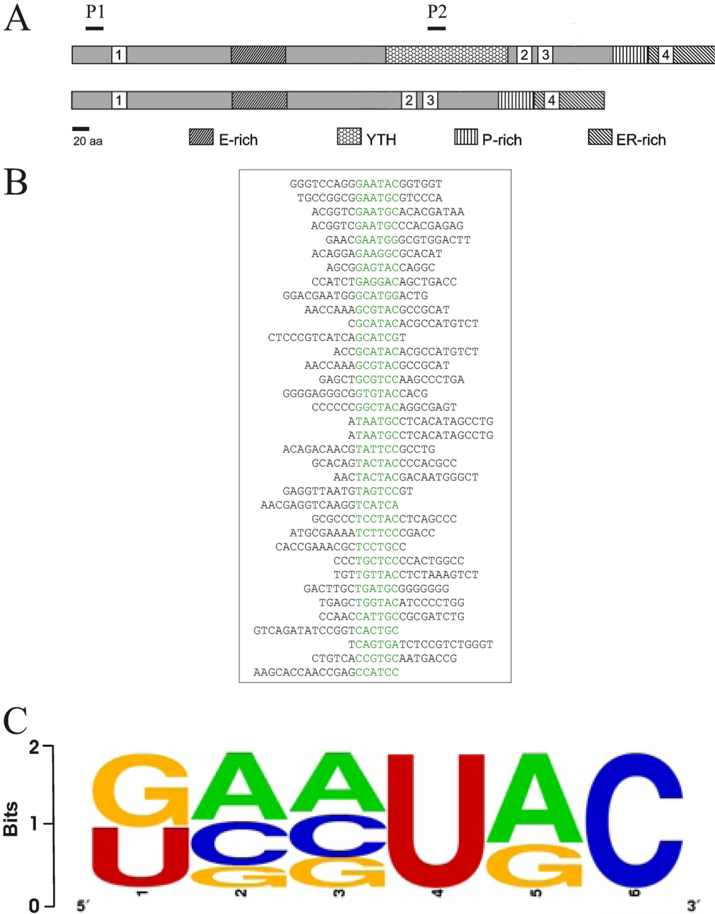
FIGURE 1 RNAmotif binding to YT521-B determined by in vitro SELEX. A , schematic representation of the protein structure of YT521-B. The various protein domains are indicated. E-rich : glutamic-acid rich domain; YTH : YT homology domain (6); P-rich : proline-rich domain; ER-rich : glutamic-acid/arginine-rich domain. 1-4 are the four nuclear localization sites. P1 and P2 are the protein regions used to generate peptide antisera against YT521-B, P1: RSARSVILIFSVRESGKFQCG; P2: KDGELNVLDDILTEVPEQDDECG. B , representative SELEX sequences. The common sequence motif is highlighted in green . C , weight matrix describing the degenerate sequence element present in all SELEX clones.
FIGURE 1 RNAmotif binding to YT521-B determined by in vitro SELEX. A , schematic representation of the protein structure of YT521-B. The various protein domains are indicated. E-rich : glutamic-acid rich domain; YTH : YT homology domain (6); P-rich : proline-rich domain; ER-rich : glutamic-acid/arginine-rich domain. 1-4 are the four nuclear localization sites. P1 and P2 are the protein regions used to generate peptide antisera against YT521-B, P1: RSARSVILIFSVRESGKFQCG; P2: KDGELNVLDDILTEVPEQDDECG. B , representative SELEX sequences. The common sequence motif is highlighted in green . C , weight matrix describing the degenerate sequence element present in all SELEX clones.CC-BY · From the PDF
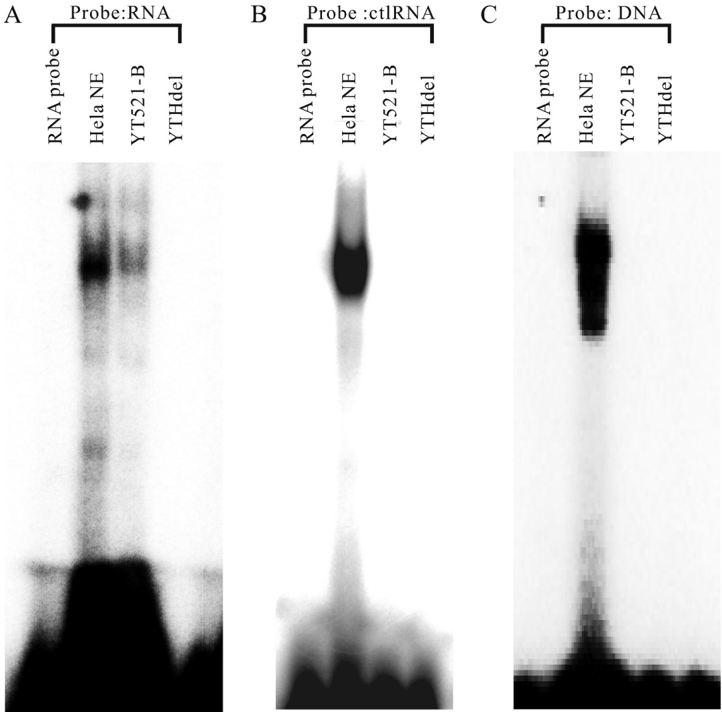
FIGURE 2 Interaction of YT521-B with RNA. A , gel mobility shift analysis of YT521-B using RNA probes containing the YTH binding motif. 20 𝛍 Mofrecombinant, baculovirus-generated YT521-B and YT521-B lacking the YTH domain ( YTHdel ) were incubated with 15 𝛍 M YTH binding motif RNA probe. HeLa NE , HeLa nuclear extract serving as a positive control. Probe RNA: GCAUGC. B , gel mobility shift analysis of YT521-B using RNA probes lacking the YTH binding motif. 20 𝛍 M of recombinant, baculovirus-generated YT521-B and YT521-B lacking the YTH domain ( YTHdel ) were incubated with 15 𝛍 M control RNA probe ( ctlRNA ) which is a CUUACU sequence lacking YTH binding motif. C , gel mobility shift analysis of YT521-B using DNA probes. 20 𝛍 M of recombinant, baculovirus-generated YT521-B and YT521-B lacking the YTH domain ( YTHdel ) were incubated with 15 𝛍 M single-stranded DNA probe. Probe DNA: GCATGC.
FIGURE 2 Interaction of YT521-B with RNA. A , gel mobility shift analysis of YT521-B using RNA probes containing the YTH binding motif. 20 𝛍 Mofrecombinant, baculovirus-generated YT521-B and YT521-B lacking the YTH domain ( YTHdel ) were incubated with 15 𝛍 M YTH binding motif RNA probe. HeLa NE , HeLa nuclear extract serving as a positive control. Probe RNA: GCAUGC. B , gel mobility shift analysis of YT521-B using RNA probes lacking the YTH binding motif. 20 𝛍 M of recombinant, baculovirus-generated YT521-B and YT521-B lacking the YTH domain ( YTHdel ) were incubated with 15 𝛍 M control RNA probe ( ctlRNA ) which is a CUUACU sequence lacking YTH binding motif. C , gel mobility shift analysis of YT521-B using DNA probes. 20 𝛍 M of recombinant, baculovirus-generated YT521-B and YT521-B lacking the YTH domain ( YTHdel ) were incubated with 15 𝛍 M single-stranded DNA probe. Probe DNA: GCATGC.CC-BY · From the PDF
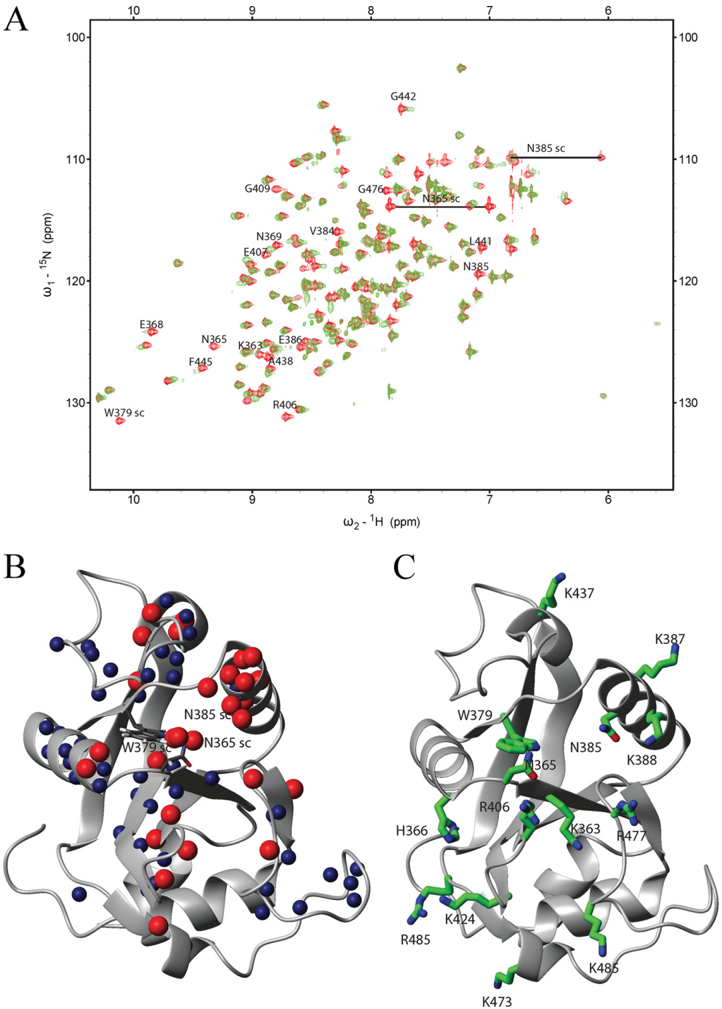
FIGURE3 NMRanalysisoftheYTHdomain. A , overlayofthe 15 N-HSQCspectraofthefreedomain( red ) andina2:1 RNA-protein complex ( green ). A change in position or disappearance of a peak indicates a change in the chemical environment of the respective atoms due to direct binding of the corresponding residue or structural rearrangementsuponbinding.Theidentityofselectedresiduesisindicated( sc : side chain). B , backbone or side-chain amides of residues, which either disappeared ( red spheres ) or showed a large chemical shift changes ( blue spheres ), were mappedontheNMRstructureoftheYTHdomainsolvedbytheRikenStructuralGenomicsandProteomicsInitiative (PDBcode:2YUD).Theseincludebesidesthebackboneamidesalsoside-chainatomsfromtwoasparaginesandone tryptophan. C , residues proposed to be involved in RNA binding mapped on the structure of the YTH domain.
FIGURE3 NMRanalysisoftheYTHdomain. A , overlayofthe 15 N-HSQCspectraofthefreedomain( red ) andina2:1 RNA-protein complex ( green ). A change in position or disappearance of a peak indicates a change in the chemical environment of the respective atoms due to direct binding of the corresponding residue or structural rearrangementsuponbinding.Theidentityofselectedresiduesisindicated( sc : side chain). B , backbone or side-chain amides of residues, which either disappeared ( red spheres ) or showed a large chemical shift changes ( blue spheres ), were mappedontheNMRstructureoftheYTHdomainsolvedbytheRikenStructuralGenomicsandProteomicsInitiative (PDBcode:2YUD).Theseincludebesidesthebackboneamidesalsoside-chainatomsfromtwoasparaginesandone tryptophan. C , residues proposed to be involved in RNA binding mapped on the structure of the YTH domain.CC-BY · From the PDF
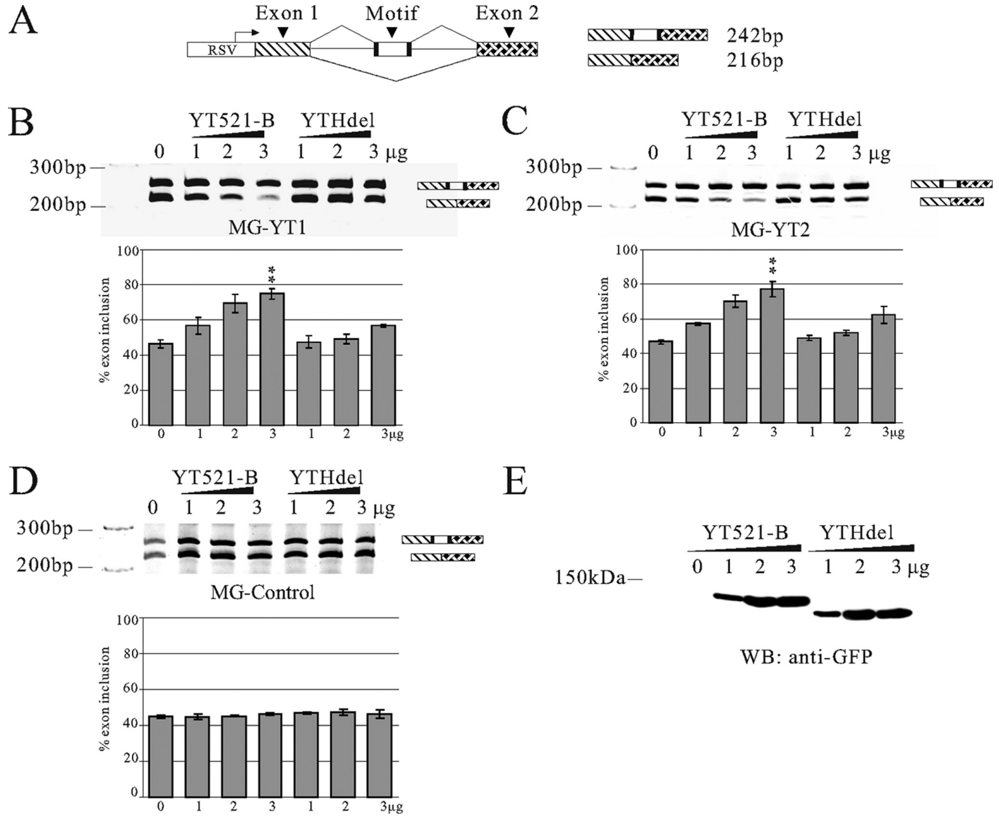
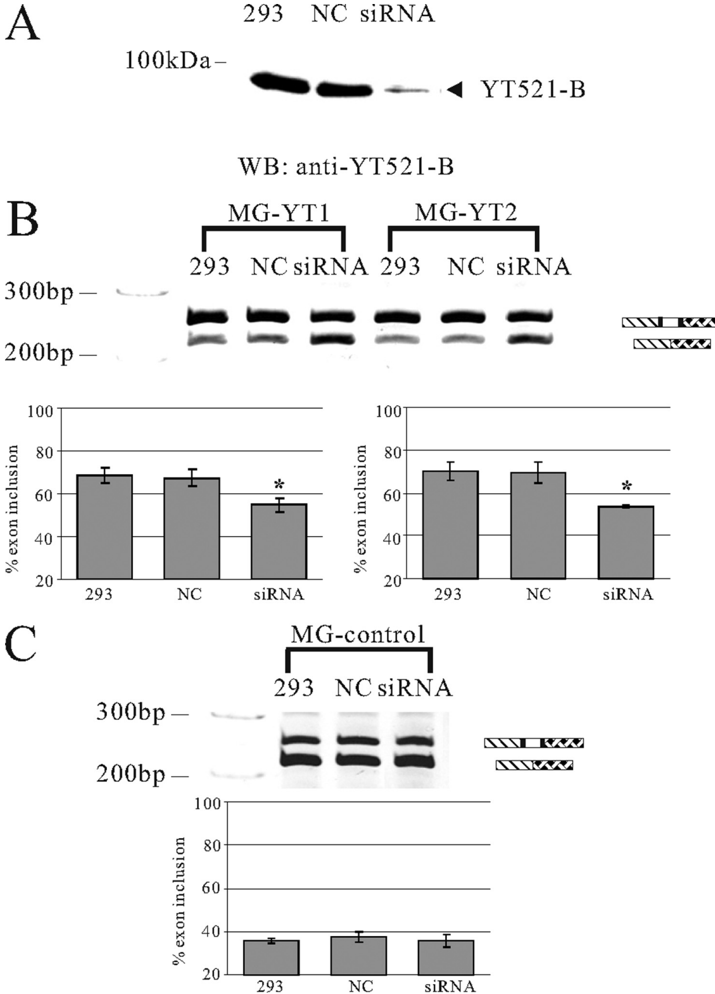
FIGURE 4 Influence of YT521-B binding motifs on alternative splicing in vivo . A , structure of the SXN minigene (28). The construct consists of globin exon 1 and 2 ( shaded ) that flank a central artificial exon. The RNA sequence is introduced in the central exon, indicated by 'motif.' Arrows indicate the localization of the primers used for RT-PCR. At least three independent experiments were evaluated using the Student's t test. B , cotransfection assay using a minigene MG-YT1 with the seq1 sequence that contains one YT-521-B binding motif, which is underlined (seq1: AGAGTCCAGTCTGTCAGTCA) sequence. A minigene containing this sequence was cotransfected with an increasing amount of YT521-B or YT521-B ( YTHdel ). The resulting RNA was analyzed by RT-PCR using the primers indicated in A , p < 0.001. C , cotransfection assay using a minigene MG-YT2 with the seq2 sequence that contains two YTH binding motifs ( seq2 : GATGCATGCAATGGATGCGG), p < 0.01. D , cotransfection assay using a minigene containing a control sequence seq3 lacking the YTH binding motif ( seq3 : GGCGATAATGTGTAAATGCC). E , Western blot detecting expression of transfected YT521-B and YT521-B ( YTHdel ) in cell lysates of the transfection assays. An antibody against EGFP was used for detection. The relative levels of endogenous and transfected YT521-B are shown in Fig. 6 C , lane 1 .
FIGURE 4 Influence of YT521-B binding motifs on alternative splicing in vivo . A , structure of the SXN minigene (28). The construct consists of globin exon 1 and 2 ( shaded ) that flank a central artificial exon. The RNA sequence is introduced in the central exon, indicated by 'motif.' Arrows indicate the localization of the primers used for RT-PCR. At least three independent experiments were evaluated using the Student's t test. B , cotransfection assay using a minigene MG-YT1 with the seq1 sequence that contains one YT-521-B binding motif, which is underlined (seq1: AGAGTCCAGTCTGTCAGTCA) sequence. A minigene containing this sequence was cotransfected with an increasing amount of YT521-B or YT521-B ( YTHdel ). The resulting RNA was analyzed by RT-PCR using the primers indicated in A , p < 0.001. C , cotransfection assay using a minigene MG-YT2 with the seq2 sequence that contains two YTH binding motifs ( seq2 : GATGCATGCAATGGATGCGG), p < 0.01. D , cotransfection assay using a minigene containing a control sequence seq3 lacking the YTH binding motif ( seq3 : GGCGATAATGTGTAAATGCC). E , Western blot detecting expression of transfected YT521-B and YT521-B ( YTHdel ) in cell lysates of the transfection assays. An antibody against EGFP was used for detection. The relative levels of endogenous and transfected YT521-B are shown in Fig. 6 C , lane 1 .CC-BY · From the PDF
Image 5
CC-BY · From the PDF
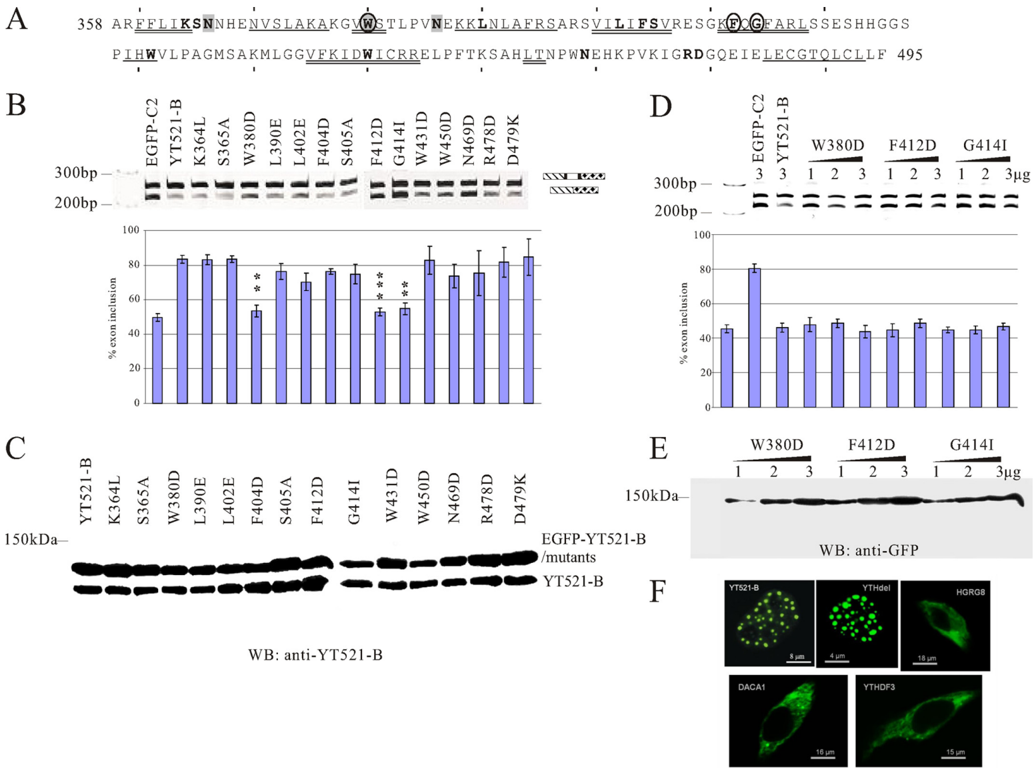
FIGURE 6 Mutational analysis of the YTH domain. A , sequence of the YTH domain found in YT521-B (6). The region corresponds to amino acids 358-495. Starting from amino acid 360, every 10th amino acid is indicated with a dash . The phylogenetically conserved residues are indicated by bold letters . The regions predicted to form 𝛂 helices or 𝛃 strands are indicated. 𝛂 -helix: double line , 𝛃 -sheet: single line . Residues important for influencing splice site selection are circled . Residues that contact RNA are shaded . B , analysis of the MG-YT2 minigene in cotransfection experiments with YTH domain mutations that are indicated by the amino acids changed. p values are 0.0092 (W380D), 0.0038 (F412D), and 0.007 (G414I). C , expression analysis of YTH domain mutations by Western blot, using an antiserum against YT521-B (7). D , analysis of three YTH-domain mutations most severely affecting the YTH domain. 1-3 𝛍 g of expression plasmids for each construct were transfected with the MG-YT2 reporter minigene and analyzed by RT-PCR. Parental vector is always included to give comparable amounts of transfected plasmid. The images underneath show the statistical evaluation of three independent experiments and the increase of expression of each mutant, which was detected by Western blot of cellular lysates using an antibody against EGFP. E , localization of YTH-domain containing proteins. Proteins that were taggedwithEGFPattheNterminuswereexpressedinHEK293cells.The images showrepresentativecells. YT521-B and YTHdel are localized in the nucleus. The images are enlarged to show the nuclear substructure.
FIGURE 6 Mutational analysis of the YTH domain. A , sequence of the YTH domain found in YT521-B (6). The region corresponds to amino acids 358-495. Starting from amino acid 360, every 10th amino acid is indicated with a dash . The phylogenetically conserved residues are indicated by bold letters . The regions predicted to form 𝛂 helices or 𝛃 strands are indicated. 𝛂 -helix: double line , 𝛃 -sheet: single line . Residues important for influencing splice site selection are circled . Residues that contact RNA are shaded . B , analysis of the MG-YT2 minigene in cotransfection experiments with YTH domain mutations that are indicated by the amino acids changed. p values are 0.0092 (W380D), 0.0038 (F412D), and 0.007 (G414I). C , expression analysis of YTH domain mutations by Western blot, using an antiserum against YT521-B (7). D , analysis of three YTH-domain mutations most severely affecting the YTH domain. 1-3 𝛍 g of expression plasmids for each construct were transfected with the MG-YT2 reporter minigene and analyzed by RT-PCR. Parental vector is always included to give comparable amounts of transfected plasmid. The images underneath show the statistical evaluation of three independent experiments and the increase of expression of each mutant, which was detected by Western blot of cellular lysates using an antibody against EGFP. E , localization of YTH-domain containing proteins. Proteins that were taggedwithEGFPattheNterminuswereexpressedinHEK293cells.The images showrepresentativecells. YT521-B and YTHdel are localized in the nucleus. The images are enlarged to show the nuclear substructure.CC-BY · From the PDF
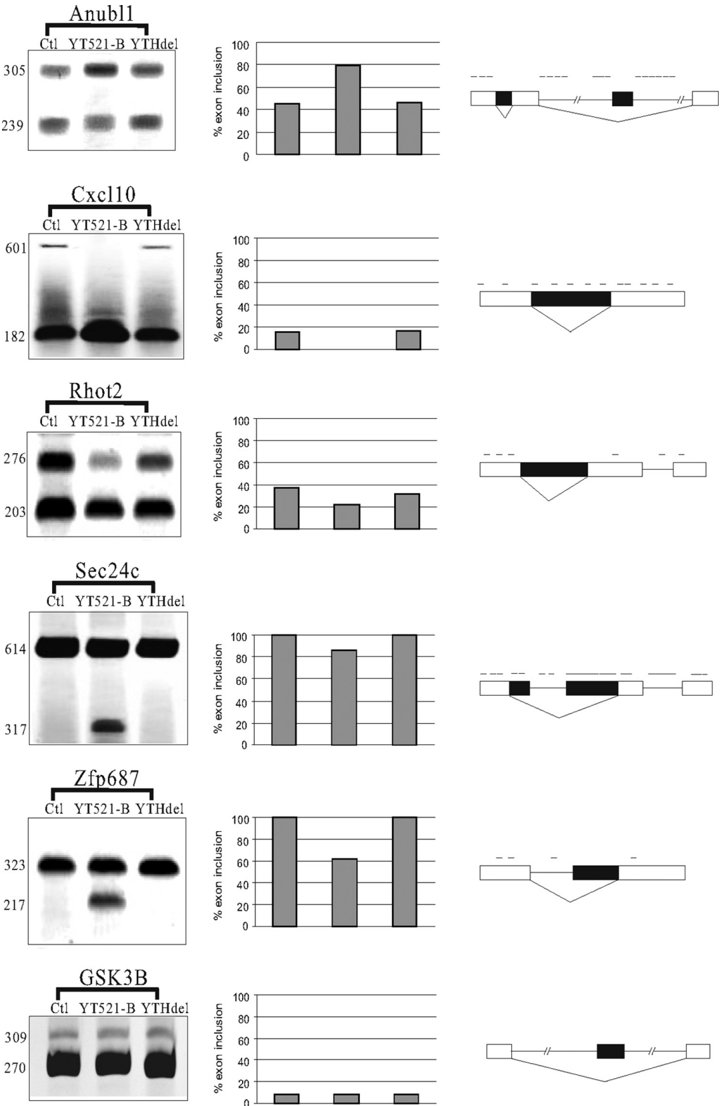
FIGURE 7 Endogenous target genes of YT521-B. RT-PCR analysis of YT521-B-dependent exons. Exons were identified by Splicearray analysis. High scoring events were analyzed by RT-PCR using primers in the flanking exons. YT521-B : overexpression of EGFP-YT521-B, YTHdel : overexpression of EGFP-YT521-Bdel(YTH). The image on the right shows a representative RT-PCR analysis, the graph in the middle shows the statistical evaluation of each experiment, and the schematic on the left shows the localization of YTH binding signatures on top of the annotated transcript structure. The processing of GSK3B was shown to be YT521-B independent both by Splicearray analysis and by RT-PCR.
FIGURE 7 Endogenous target genes of YT521-B. RT-PCR analysis of YT521-B-dependent exons. Exons were identified by Splicearray analysis. High scoring events were analyzed by RT-PCR using primers in the flanking exons. YT521-B : overexpression of EGFP-YT521-B, YTHdel : overexpression of EGFP-YT521-Bdel(YTH). The image on the right shows a representative RT-PCR analysis, the graph in the middle shows the statistical evaluation of each experiment, and the schematic on the left shows the localization of YTH binding signatures on top of the annotated transcript structure. The processing of GSK3B was shown to be YT521-B independent both by Splicearray analysis and by RT-PCR.CC-BY · From the PDF

Verification

Claims the paper makes

The claims and statistics of this paper haven’t been checked yet.

Run the check — free, no account needed. It reads the open-access text and checks the sources it cites.

A few free checks a day · papers already verified open instantly · results are public

Claims other papers make about this one

Each is checked against this paper’s own text: does it say what the citing paper says it does?

Self-check

Percentages, sums and reported differences re-computed from the paper’s own numbers.

The self-check needs the paper’s full text.

Citations

Cites

Show all 1 references

Research works printed but not linked: 32

  1. Chen, 2005, FEBS J., 272, 2088, 10.1111/j.1742-4658.2005.04650.x · DOI
  2. Maris, 2005, FEBS J., 272, 2118, 10.1111/j.1742-4658.2005.04653.x · DOI
  3. Pérez-Arellano, 2007, FEBS J., 274, 4972, 10.1111/j.1742-4658.2007.06031.x · DOI
  4. Theobald, 2003, Annu. Rev. Biophys. Biomol. Struct., 32, 115, 10.1146/annurev.biophys.32.110601.142506 · DOI
  5. Lie, 1999, Development, 126, 1129, 10.1242/dev.126.6.1129 · DOI
  6. Stoilov, 2002, Trends Biochem. Sci., 27, 495, 10.1016/S0968-0004(02)02189-8 · DOI
  7. Hartmann, 1999, Mol. Biol. Cell, 10, 3909, 10.1091/mbc.10.11.3909 · DOI
  8. Imai, 1998, Brain Res. Mol. Brain Res., 53, 33, 10.1016/S0169-328X(97)00262-3 · DOI
  9. Stoss, 2001, J. Biol. Chem., 276, 8665, 10.1074/jbc.M006851200 · DOI
  10. Nayler, 2000, J. Cell Biol., 150, 949, 10.1083/jcb.150.5.949 · DOI
  11. Rafalska, 2004, Hum. Mol. Genet., 13, 1535, 10.1093/hmg/ddh167 · DOI · Paper page
  12. Harigaya, 2006, Nature, 442, 45, 10.1038/nature04881 · DOI
  13. McPheeters, 2009, Nat. Struct. Mol. Biol., 16, 255, 10.1038/nsmb.1556 · DOI
  14. White, 2001, RNA, 7, 1855
  15. Hertz, 1999, Bioinformatics, 15, 563, 10.1093/bioinformatics/15.7.563 · DOI
  16. Stoss, 1999, Brain Res. Brain Res. Protoc., 4, 383, 10.1016/S1385-299X(99)00043-4 · DOI
  17. Schneider, 1990, Nucleic Acids Res., 18, 6097, 10.1093/nar/18.20.6097 · DOI
  18. Kurowski, 2003, Nucleic Acids Res., 31, 3305, 10.1093/nar/gkg557 · DOI
  19. Sattler, 1999, Prog. Nuclear Mag. Res. Spect., 34, 93, 10.1016/S0079-6565(98)00025-9 · DOI
  20. Koradi, 1996, J. Mol. Graph., 14, 51, 10.1016/0263-7855(96)00009-4 · DOI
  21. Zuker, 1994, Meth. Mol. Biol., 25, 267
  22. Hargous, 2006, EMBO J., 25, 5126, 10.1038/sj.emboj.7601385 · DOI
  23. Bourgeois, 2004, Prog. Nucleic Acids Res. Mol. Biol., 78, 37, 10.1016/S0079-6603(04)78002-2 · DOI
  24. Auweter, 2007, J. Mol. Biol., 367, 174, 10.1016/j.jmb.2006.12.053 · DOI
  25. Valverde, 2008, FEBS J., 275, 2712, 10.1111/j.1742-4658.2008.06411.x · DOI
  26. Auweter, 2006, EMBO J., 25, 163, 10.1038/sj.emboj.7600918 · DOI · Paper page
  27. Coulter, 1997, Mol. Cell Biol., 17, 2143, 10.1128/MCB.17.4.2143 · DOI
  28. Stoilov, 2004, Hum. Mol. Genet., 13, 509, 10.1093/hmg/ddh051 · DOI
  29. Arakaki, 2006, Acta Crystallogr. Sect. F Struct. Biol. Cryst. Commun., 62, 175, 10.1107/S1744309106005902 · DOI
  30. Li, 2005, Protein Sci., 14, 2895, 10.1110/ps.051736805 · DOI
  31. Aravind, 1999, J. Mol. Evol., 48, 291, 10.1007/PL00006472 · DOI
  32. Ule, 2006, Nature, 444, 580, 10.1038/nature05304 · DOI

Cited by

Metadata

Authors
Zhang, Z., Theler, D., Kaminska, K. H., Hiller, M., de la Grange, P., Pudimat, R., Rafalska, I., Heinrich, B., Bujnicki, J. M., Allain, F. H.-T., & Stamm, S.
Venue
Journal of Biological Chemistry
Publisher
Elsevier BV
Published
2010-05
Volume
285
Issue
19
Pages
14701-14710
ISSN
0021-9258
Cited by
290
References
1
Language
en

About these checks

Registry, retraction, Cites and statistics results are computed, not judged, with one exception: a printed reference that no index lists is read once by a model before it counts as a citation error. Claims are extracted by a model and kept only when their quote appears verbatim in the text; each cited source is then checked, with a model’s help, for whether it says what the claim relies on. Those verdicts can be wrong — read the claim’s quote and the cited source before relying on one.

Statistics and arithmetic are recomputed, not judged.

Confidence bands are shown only for fields calibrated on our annotated test set. None is calibrated yet, so no band is shown.

What counts as a claim ›How we measure confidence ›How we check this ›

Are you an author, or do you see a problem with this page? Request a review

Data sources

Bibliographic data: Semantic Scholar, OpenAlex, Crossref.

Contains information from the Semantic Scholar Academic Graph Datasets, made available under the ODC Attribution License (ODC-BY 1.0).

Semantic Scholar’s data is described in: Kinney, R., et al. (2023). The Semantic Scholar Open Data Platform. arXiv:2301.10140.