

The DOI matches its Crossref record; 47 of the 47 references it cites were found in a registry or an index.
ATP6AP2/(Pro)renin Receptor Contributes to Glucose Metabolism via Stabilizing the Pyruvate Dehydrogenase E1 β Subunit
Abstract
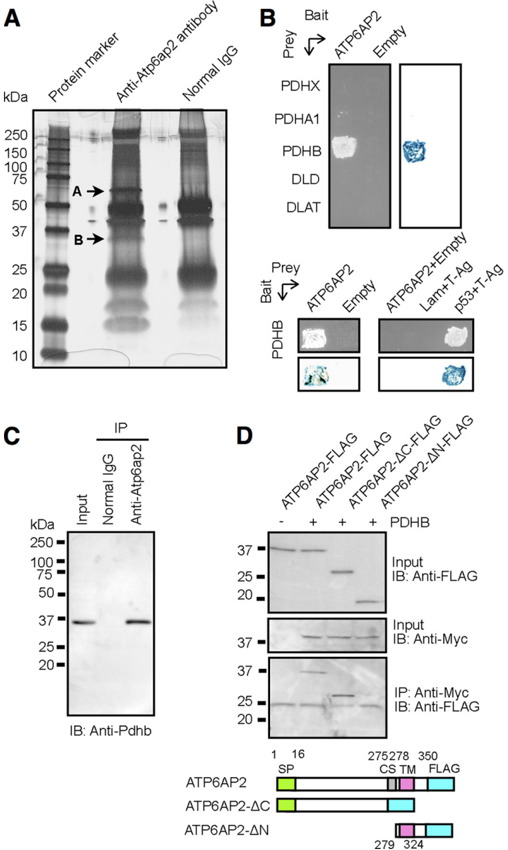
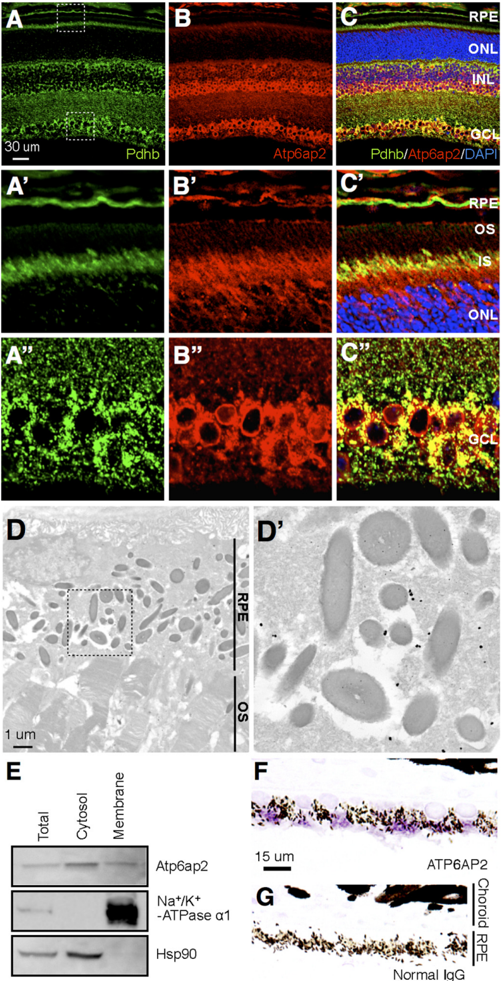
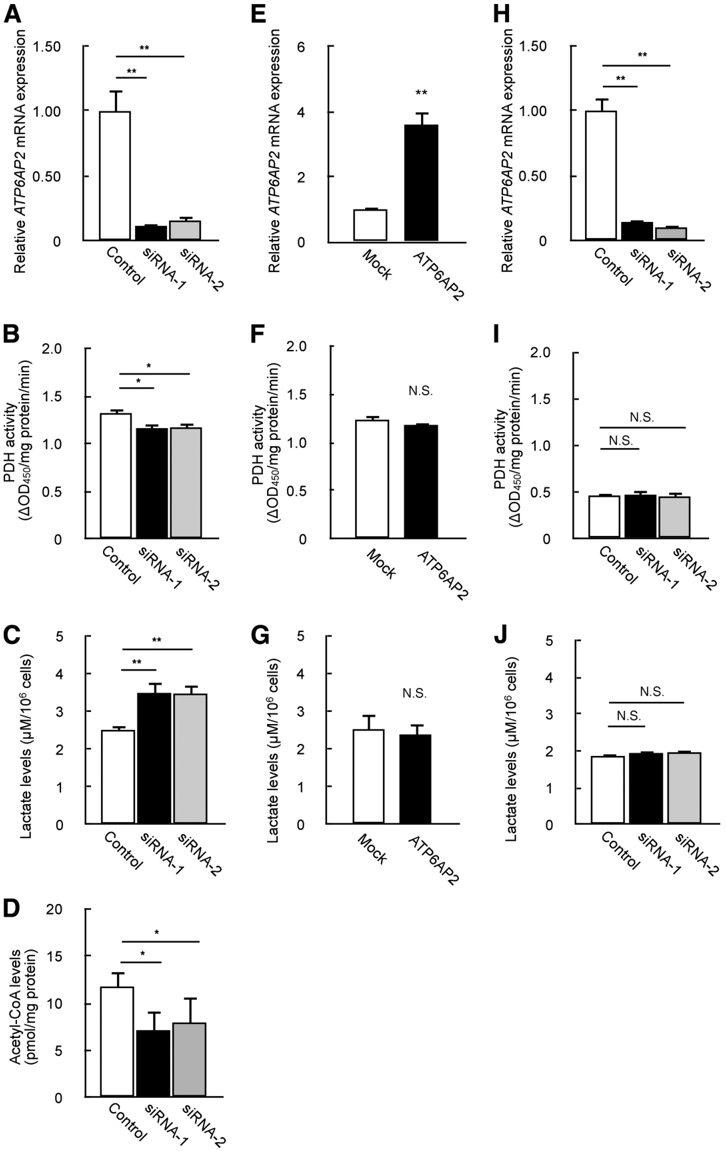
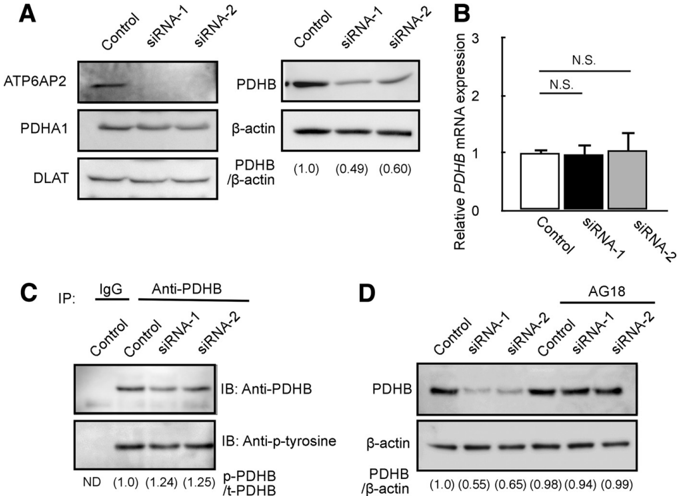
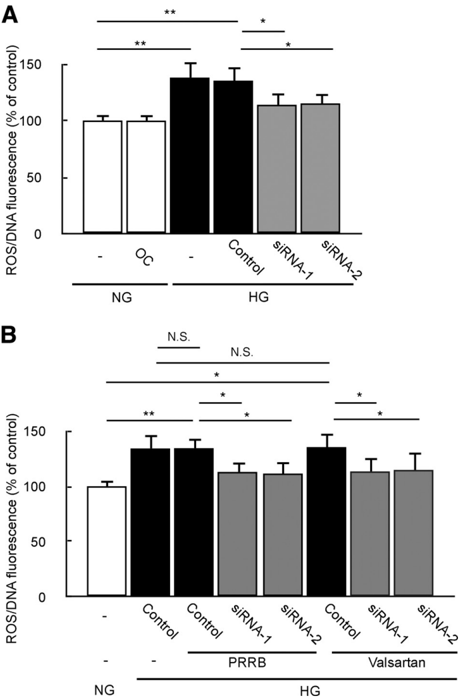
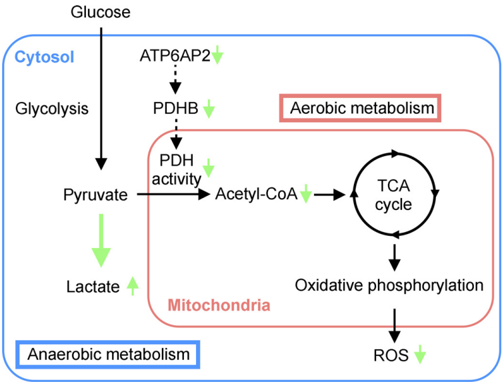
Background: The mechanism of efficient energy generation in the highly evolved mammalian retina remains incompletely understood. Results: ATP6PA2 interacts with the E1 β subunit of pyruvate dehydrogenase, a key enzyme in aerobic energy generation, controlling its protein stability. Conclusion: ATP6AP2 contributes to glucose metabolism together with oxidative stress. Significance: The present data provide a novel insight into the biological function of ATP6AP2 in the retina. Aerobic glucose metabolism is indispensable for metabolically active cells; however, the regulatory mechanism of efficient energy generation in the highly evolved mammalian retina remains incompletely understood. Here, we revealed an unsuspected role for (pro)renin receptor, also known as ATP6AP2, in energy metabolism. Immunoprecipitation and mass spectrometry analyses identified the pyruvate dehydrogenase (PDH) complex as Atp6ap2-interacting proteins in the mouse retina. Yeast two-hybrid assays demonstrated direct molecular binding between ATP6AP2 and the PDH E1 β subunit (PDHB). Pdhb immunoreactivity co-localized with Atp6ap2 in multiple retinal layers including the retinal pigment epithelium (RPE). ATP6AP2 knockdown in RPE cells reduced PDH activity, showing a predilection to anaerobic glycolysis. ATP6AP2 protected PDHB from phosphorylation, thus controlling its protein stability. Down-regulated PDH activity due to ATP6AP2 knockdown inhibited glucose-stimulated oxidative stress in RPE cells. Our present data unraveled the novel function of ATP6AP2/(P)RR as a PDHB stabilizer, contributing to aerobic glucose metabolism together with oxidative stress.
Overview
The claims and statistics of this paper haven’t been checked yet.
Run the check — free, no account needed. It reads the open-access text and checks the sources it cites.
Integrity signals
Registry
Cites
Statistics
Figures

Verification
Claims the paper makes
The claims and statistics of this paper haven’t been checked yet.
Run the check — free, no account needed. It reads the open-access text and checks the sources it cites.
Claims other papers make about this one
Each is checked against this paper’s own text: does it say what the citing paper says it does?
In the citing paper
“(P)RR inhibition has previously been reported to reduce PDHB protein levels via a tyrosine-phosphorylation–dependent manner in mouse retina and human retinal pigment epithelium cells.47”
From (Pro)renin Receptor Inhibition Reprograms Hepatic Lipid Metabolism and Protects Mice From Diet-Induced Obesity and Hepatosteatosis (2018) · cites this paper as [47]
Self-check
Percentages, sums and reported differences re-computed from the paper’s own numbers.
The self-check needs the paper’s full text.
Citations
Cites
An Energy Budget for Signaling in the Grey Matter of the Brain
Attwell, D., & Laughlin, S. B. (2001) · Journal of Cerebral Blood Flow & Metabolism · doi:10.1097/00004647-200110000-00001 · Cited by 3,543
The Retinal Pigment Epithelium in Visual Function
Strauss, O. (2005) · Physiological Reviews · doi:10.1152/physrev.00021.2004 · Cited by 2,828
Nguyen, G., Delarue, F., Burcklé, C., Bouzhir-Sima, L., Giller, T., & Sraer, J. (2002) · Journal of Clinical Investigation · doi:10.1172/jci14276 · Cited by 1,276
The metabolic cost of neural information
Laughlin, S. B., van Steveninck, R. R. D. R., & Anderson, J. C. (1998) · Nature Neuroscience · doi:10.1038/236 · Cited by 1,201
Nguyen, G., Delarue, F., Burcklé, C., Bouzhir-Sima, L., Giller, T., & Sraer, J. (2002) · Journal of Clinical Investigation · doi:10.1172/jci0214276 · Cited by 1,136
Lysine Acetylation: Codified Crosstalk with Other Posttranslational Modifications
Yang, X.-J., & Seto, E. (2008) · Molecular Cell · doi:10.1016/j.molcel.2008.07.002 · Cited by 1,006
The Age of Crosstalk: Phosphorylation, Ubiquitination, and Beyond
Hunter, T. R. (2007) · Molecular Cell · doi:10.1016/j.molcel.2007.11.019 · Cited by 973
A review on the role of antioxidants in the management of diabetes and its complications
Rahimi, R., Nikfar, S., Larijani, B. A., & Abdollahi, M. R. (2005) · Biomedicine & Pharmacotherapy · doi:10.1016/j.biopha.2005.07.002 · Cited by 890
Du, X., Matsumura, T., Edelstein, D., Rossetti, L., Zsengellér, Z. K., Szabó, C., & Brownlee, M. (2003) · Journal of Clinical Investigation · doi:10.1172/jci18127 · Cited by 843
Mitochondrial α-Ketoglutarate Dehydrogenase Complex Generates Reactive Oxygen Species
Starkov, A. A., Fiskum, G., Chinopoulos, C., Lorenzo, B. J., Browne, S. E., Patel, M. S., & Beal, M. F. (2004) · The Journal of Neuroscience · doi:10.1523/jneurosci.1899-04.2004 · Cited by 688
Cited by
The (pro)renin receptor in health and disease
Ichihara, A., & Yatabe, M. S. (2019) · Nature Reviews Nephrology · doi:10.1038/s41581-019-0160-5 · Cited by 137
Ren, L., Sun, Y., Lu, H., Ye, D., Han, L., Wang, N., Daugherty, A., Li, F., Wang, M., Su, F., et al. (2018) · Circulation Research · doi:10.1161/circresaha.117.312422 · Cited by 59
Metadata
- Authors
- Kanda, A., Noda, K., & Ishida, S.
- Venue
- Journal of Biological Chemistry
- Publisher
- Elsevier BV
- Published
- 2015-04
- Volume
- 290
- Issue
- 15
- Pages
- 9690-9700
- ISSN
- 0021-9258
- Cited by
- 41
- References
- 47
- Language
- en
- Licence
- www.elsevier.com/tdm/userlicense/1.0/ (tdm)
- creativecommons.org/licenses/by/4.0/ (vor, 1985 d)
About these checks
Registry, retraction, Cites and statistics results are computed, not judged, with one exception: a printed reference that no index lists is read once by a model before it counts as a citation error. Claims are extracted by a model and kept only when their quote appears verbatim in the text; each cited source is then checked, with a model’s help, for whether it says what the claim relies on. Those verdicts can be wrong — read the claim’s quote and the cited source before relying on one.
Statistics and arithmetic are recomputed, not judged.
Confidence bands are shown only for fields calibrated on our annotated test set. None is calibrated yet, so no band is shown.
What counts as a claim ›How we measure confidence ›How we check this ›
Are you an author, or do you see a problem with this page? Request a review
How to cite
Cite CoChat for the checks on this page, and the paper for its own findings.
- This page
- CoChat. (2026). Citation check: ATP6AP2/(Pro)renin Receptor Contributes to Glucose Metabolism via Stabilizing the Pyruvate Dehydrogenase E1 β Subunit. https://app.cochat.ai/papers/10.1074/jbc.m114.626713
- The paper
- Kanda, A., Noda, K., & Ishida, S. (2015). ATP6AP2/(Pro)renin Receptor Contributes to Glucose Metabolism via Stabilizing the Pyruvate Dehydrogenase E1 β Subunit. Journal of Biological Chemistry. https://doi.org/10.1074/jbc.m114.626713
Data sources
Bibliographic data: Semantic Scholar, OpenAlex, Crossref.
Contains information from the Semantic Scholar Academic Graph Datasets, made available under the ODC Attribution License (ODC-BY 1.0).
Semantic Scholar’s data is described in: Kinney, R., et al. (2023). The Semantic Scholar Open Data Platform. arXiv:2301.10140.
