

The DOI matches its Crossref record; 40 of the 40 references it cites were found in a registry or an index.
Ceramide Synthase Inhibition by Fumonisin B1 Causes Accumulation of 1-Deoxysphinganine
Abstract
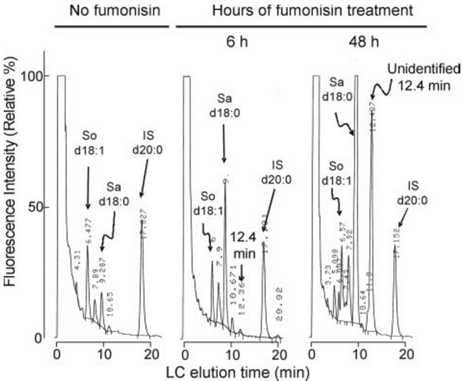
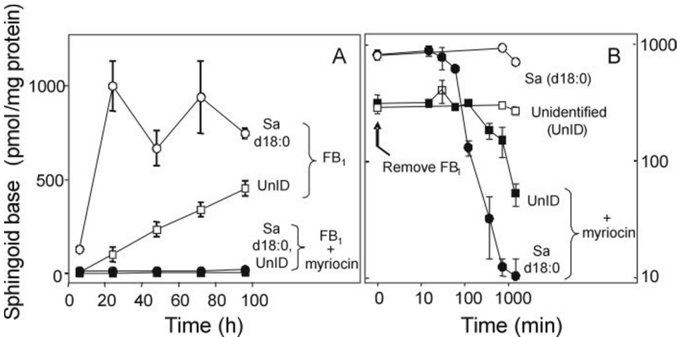
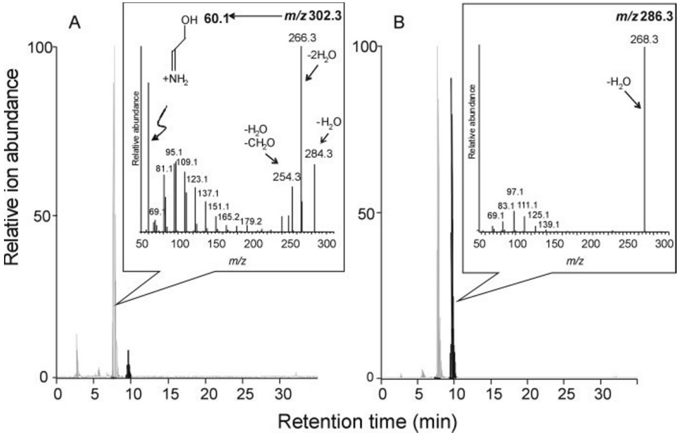
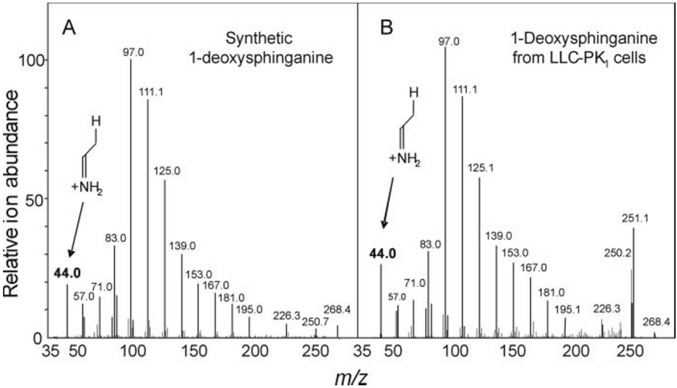
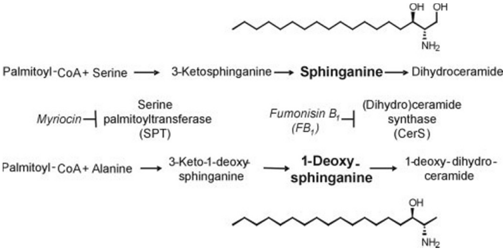
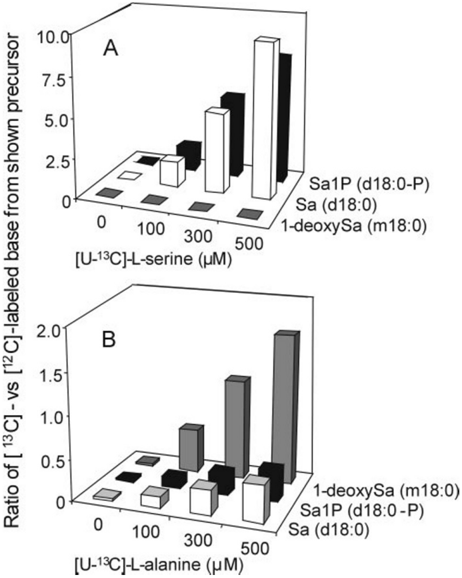
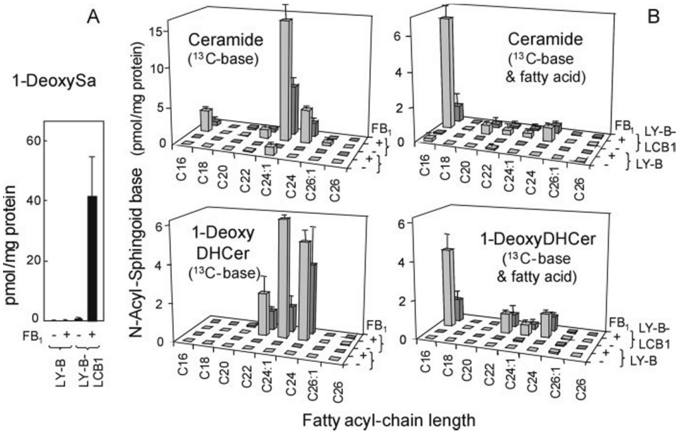
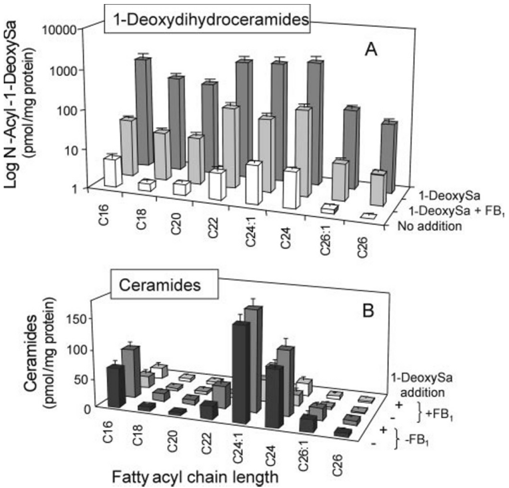
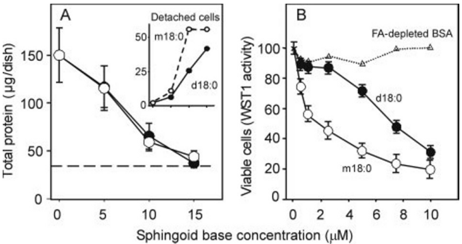
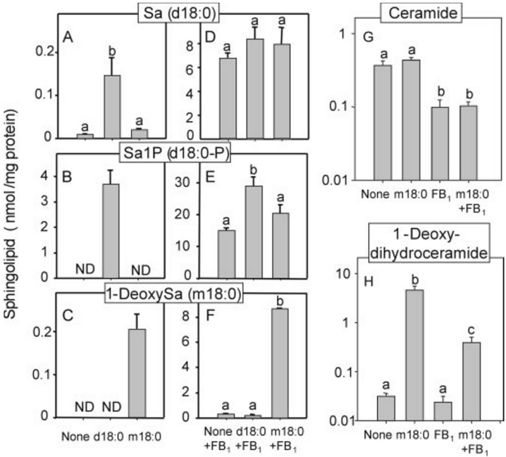
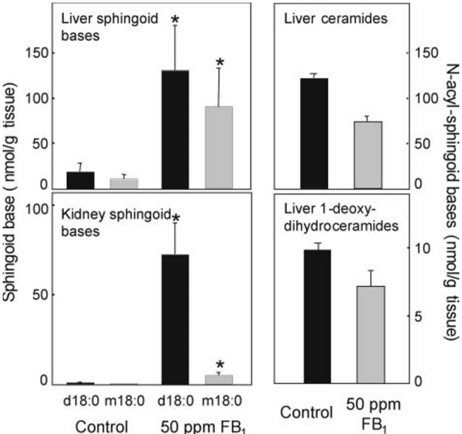
Fumonisin B(1) (FB(1)) is a mycotoxin that inhibits ceramide synthases (CerS) and causes kidney and liver toxicity and other disease. Inhibition of CerS by FB(1) increases sphinganine (Sa), Sa 1-phosphate, and a previously unidentified metabolite. Analysis of the latter by quadrupole-time-of-flight mass spectrometry assigned an m/z = 286.3123 in positive ionization mode, consistent with the molecular formula for deoxysphinganine (C(18)H(40)NO). Comparison with a synthetic standard using liquid chromatography, electrospray tandem mass spectrometry identified the metabolite as 1-deoxysphinganine (1-deoxySa) based on LC mobility and production of a distinctive fragment ion (m/z 44, CH(3)CH=NH (+)(2)) upon collision-induced dissociation. This novel sphingoid base arises from condensation of alanine with palmitoyl-CoA via serine palmitoyltransferase (SPT), as indicated by incorporation of l-[U-(13)C]alanine into 1-deoxySa by Vero cells; inhibition of its production in LLC-PK(1) cells by myriocin, an SPT inhibitor; and the absence of incorporation of [U-(13)C]palmitate into 1-[(13)C]deoxySa in LY-B cells, which lack SPT activity. LY-B-LCB1 cells, in which SPT has been restored by stable transfection, however, produce large amounts of 1-[(13)C]deoxySa. 1-DeoxySa was elevated in FB(1)-treated cells and mouse liver and kidney, and its cytotoxicity was greater than or equal to that of Sa for LLC-PK(1) and DU-145 cells. Therefore, this compound is likely to contribute to pathologies associated with fumonisins. In the absence of FB(1), substantial amounts of 1-deoxySa are made and acylated to N-acyl-1-deoxySa (i.e. 1-deoxydihydroceramides). Thus, these compounds are an underappreciated category of bioactive sphingoid bases and "ceramides" that might play important roles in cell regulation.
Overview
The claims and statistics of this paper haven’t been checked yet.
Run the check — free, no account needed. It reads the open-access text and checks the sources it cites.
Integrity signals
Registry
Cites
Statistics
Figures
Verification
Claims the paper makes
The claims and statistics of this paper haven’t been checked yet.
Run the check — free, no account needed. It reads the open-access text and checks the sources it cites.
Claims other papers make about this one
Each is checked against this paper’s own text: does it say what the citing paper says it does?
In the citing paper
“The N-acyl-derivatives of two novel categories of ceramides with 1-deoxy-and 1-(desoxymethyl)-sphingoid base backbones were also detected but not quantifi ed ( 32 ).”
From Lipidomics reveals a remarkable diversity of lipids in human plasma (2010) · cites this paper as [32]
Self-check
Percentages, sums and reported differences re-computed from the paper’s own numbers.
The self-check needs the paper’s full text.
Citations
Cites
PROTEIN MEASUREMENT WITH THE FOLIN PHENOL REAGENT
Lowry, O., Rosebrough, N., Farr, A. L., & Randall, R. (1951) · Journal of Biological Chemistry · doi:10.1016/s0021-9258(19)52451-6 · Cited by 317,331
Wang, E., Norred, W. P., Bacon, C. W., Riley, R. T., & Merrill, A. H. (1991) · Journal of Biological Chemistry · doi:10.1016/s0021-9258(18)98712-0 · Cited by 1,110
Self-citationMarasas, W. F. O., Riley, R. T., Hendricks, K. A., Stevens, V. L., Sadler, T. W., Waes, J. G., Missmer, S. A., Cabrera, J., Torres, O. R., Gelderblom, W. C. A., et al. (2004) · Journal of Nutrition · doi:10.1093/jn/134.4.711 · Cited by 606
Self-citationMerrill Jr., A. H., Sullards, M. C., Allegood, J. C., Kelly, S., & Wang, E. (2005) · Methods · doi:10.1016/j.ymeth.2005.01.009 · Cited by 594
Self-citationDiscovery and Occurrence of the Fumonisins: A Historical Perspective
Marasas, W. F. O. (2001) · Environmental Health Perspectives · doi:10.1289/ehp.01109s2239 · Cited by 567
Zheng, W., Kollmeyer, J., Symolon, H., Momin, A. A., Munter, E., Wang, E. L., Kelly, S. L., Allegood, J. C., Liu, Y., Peng, Q., et al. (2006) · Biochimica et Biophysica Acta (BBA) - Biomembranes · doi:10.1016/j.bbamem.2006.08.009 · Cited by 561
Self-citationMiyake, Y., Kozutsumi, Y., Nakamura, S., Fujita, T., & Kawasaki, T. (1995) · Biochemical and Biophysical Research Communications · doi:10.1006/bbrc.1995.1827 · Cited by 536
Pruett, S. T., Bushnev, A. S., Hagedorn, K., Adiga, M., Haynes, C. A., Sullards, M. C., Liotta, D. C., & Merrill, A. H. (2008) · Journal of Lipid Research · doi:10.1194/jlr.r800012-jlr200 · Cited by 450
Self-citationWhen Do Lasses (Longevity Assurance Genes) Become CerS (Ceramide Synthases)?
Pewzner-Jung, Y., Ben-Dor, S., & Futerman, A. H. (2006) · Journal of Biological Chemistry · doi:10.1074/jbc.r600010200 · Cited by 435
Sphingolipid Metabolism: Roles in Signal Transduction and Disruption by Fumonisins
Merrill, A. H., Sullards, M. C., Wang, E., Voss, K. A., & Riley, R. T. (2001) · Environmental Health Perspectives · doi:10.1289/ehp.01109s2283 · Cited by 431
Self-citation
Research works printed but not linked: 8
- Marasas, 2001, Environ. Health Perspect., 109, 239
- Voss, 2001, Environ. Health Perspect., 109, 259
- Riley, 2001, Environ. Health Perspect., 109, 301
- Merrill, 2001, Environ. Health Perspect., 109, 283
- Tolleson, 1999, Int. J. Oncol., 14, 833
- Riley, 1998, Rev. Méd. Vét., 149, 617
- Hornemann, 2008, Chem. Phys. Lipids., 154S, S63
- Urs, 2006, Mol. Cell. Endocrinol., 265–266, 174
Cited by
Lipidomics reveals a remarkable diversity of lipids in human plasma
Quehenberger, O., Armando, A. M., Brown, A. H., Milne, S. B., Myers, D. S., Merrill, A. H., Bandyopadhyay, S., Jones, K. N., Kelly, S., Shaner, R. L., et al. (2010) · Journal of Lipid Research · doi:10.1194/jlr.m009449 · Cited by 1,341
Self-citationBiomarkers of NAFLD progression: a lipidomics approach to an epidemic
Gorden, D. L., Myers, D. S., Ivanova, P. T., Fahy, E., Maurya, M. R., Gupta, S., Min, J., Spann, N. J., McDonald, J. G., Kelly, S. L., et al. (2015) · Journal of Lipid Research · doi:10.1194/jlr.p056002 · Cited by 372
Self-citation
Metadata
- Authors
- Zitomer, N. C., Mitchell, T., Voss, K. A., Bondy, G. S., Pruett, S. T., Garnier-Amblard, E. C., Liebeskind, L. S., Park, H., Wang, E., Sullards, M. C., Merrill, A. H., & Riley, R. T.
- Venue
- Journal of Biological Chemistry
- Publisher
- Elsevier BV
- Published
- 2009-02
- Volume
- 284
- Issue
- 8
- Pages
- 4786-4795
- ISSN
- 0021-9258
- Cited by
- 235
- References
- 40
- Language
- en
About these checks
Registry, retraction, Cites and statistics results are computed, not judged, with one exception: a printed reference that no index lists is read once by a model before it counts as a citation error. Claims are extracted by a model and kept only when their quote appears verbatim in the text; each cited source is then checked, with a model’s help, for whether it says what the claim relies on. Those verdicts can be wrong — read the claim’s quote and the cited source before relying on one.
Statistics and arithmetic are recomputed, not judged.
Confidence bands are shown only for fields calibrated on our annotated test set. None is calibrated yet, so no band is shown.
What counts as a claim ›How we measure confidence ›How we check this ›
Are you an author, or do you see a problem with this page? Request a review
How to cite
Cite CoChat for the checks on this page, and the paper for its own findings.
- This page
- CoChat. (2026). Citation check: Ceramide Synthase Inhibition by Fumonisin B1 Causes Accumulation of 1-Deoxysphinganine. https://app.cochat.ai/papers/10.1074/jbc.m808798200
- The paper
- Zitomer, N. C., Mitchell, T., Voss, K. A., Bondy, G. S., Pruett, S. T., Garnier-Amblard, E. C., Liebeskind, L. S., Park, H., Wang, E., Sullards, M. C., Merrill, A. H., & Riley, R. T. (2009). Ceramide Synthase Inhibition by Fumonisin B1 Causes Accumulation of 1-Deoxysphinganine. Journal of Biological Chemistry. https://doi.org/10.1074/jbc.m808798200
Data sources
Bibliographic data: Semantic Scholar, OpenAlex, Crossref.
Contains information from the Semantic Scholar Academic Graph Datasets, made available under the ODC Attribution License (ODC-BY 1.0).
Semantic Scholar’s data is described in: Kinney, R., et al. (2023). The Semantic Scholar Open Data Platform. arXiv:2301.10140.
