Cited by 22Colorectal Cancer Treatments and StudiesCancer Cells and MetastasisCancer Immunotherapy and Biomarkers

The DOI matches its Crossref record; 40 of the 40 references it cites were found in a registry or an index.

Prognostic value of the PrP C -ILK-IDO1 axis in the mesenchymal colorectal cancer subtype

Open access
Ghazi, Alexandre, Le Corre, Delphine, Pilati, Camilla, Taieb, Julien, Aparicio, Thomas, Didelot, Audrey, Dedhar, Shoukat, Mulot, Claire, Le Malicot, Karine, Djouadi, Fatima, de Reynies, Aurélien, Launay, Jean-Marie, Laurent-Puig, Pierre, Mouillet-Richard, Sophie·2021·OncoImmunology

Abstract

The CMS4 mesenchymal subtype of colorectal cancer (CRC) is associated with poor prognosis and resistance to treatment. The cellular prion protein PrPC is overexpressed in CMS4 tumors and controls the expression of a panel of CMS4-specific genes in CRC cell lines. Here, we sought to investigate PrPC downstream pathways that may underlie its role in CMS4 CRC. By combining gene set enrichment analyses and gain and loss of function approaches in CRC cell lines, we identify the integrin-linked kinase ILK as a proximal effector of PrPC that mediates its control on the CMS4 phenotype. We further leveraged three independent large CRC cohorts to assess correlations in gene expression pattern with patient outcomes and found that ILK is overexpressed in CMS4 mesenchymal tumors and confers a poor prognosis, especially when combined with high expression of the PrPC encoding gene PRNP. Of note, we discovered that the PrPC-ILK signaling axis controls the expression and activity of the tryptophan metabolizing enzyme indoleamine 2,3 dioxygenase IDO1, a key player in immune tolerance. In addition, we monitored alterations in the levels of tryptophan and its metabolites of the kynurenine pathway in the plasma of metastatic CRC patients (n = 325) and we highlight their prognostic value in combination with plasma PrPC levels. Thus, the PrPC-ILK-IDO1 axis plays a key role in the mesenchymal subtype of CRC. PrPC and IDO1-targeted strategies may represent new avenues for patient stratification and treatment in CRC.

Overview

The claims and statistics of this paper haven’t been checked yet.

Run the check — free, no account needed. It reads the open-access text and checks the sources it cites.

A few free checks a day · papers already verified open instantly · results are public

Integrity signals

Registry

Crossref · 10.1080/2162402x.2021.1940674

Cites

40 of 40 references verified0 citation errors · 0 not checkable

Statistics

Figures

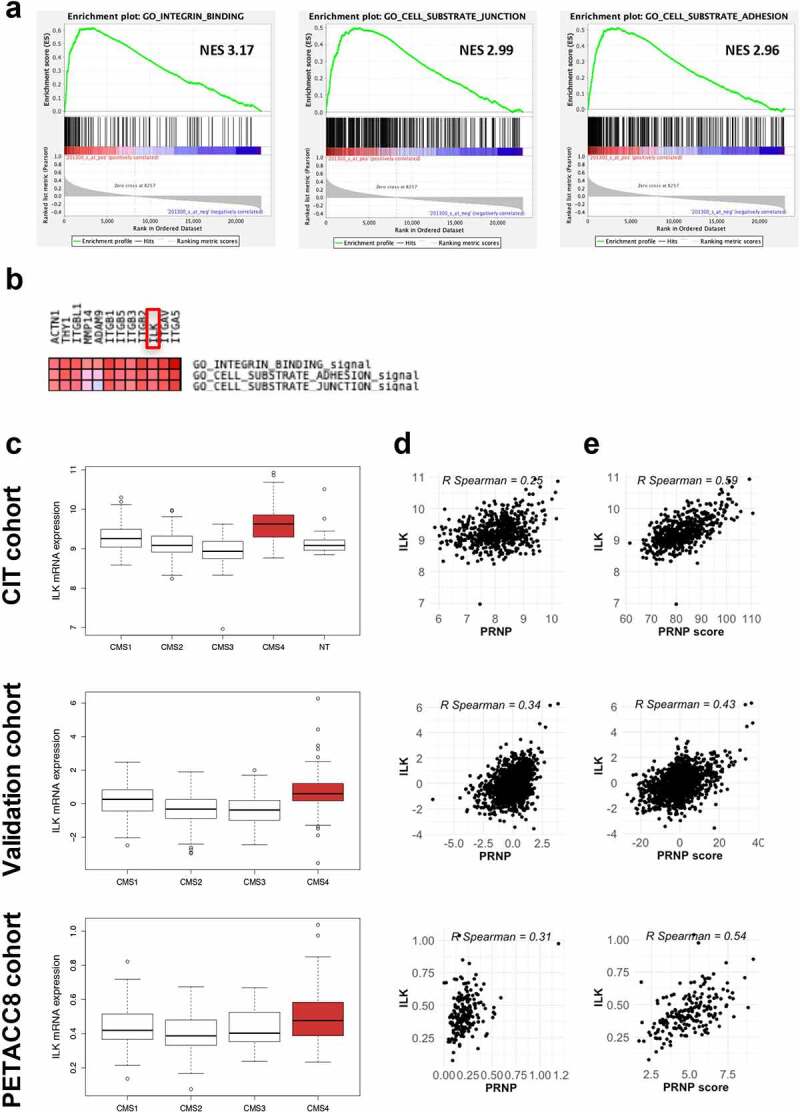
Figure 1. ILK expression correlates with PRNP and is enriched in CMS4 CRC. a GSEA analysis showing enrichment of the Integrin binding, Cell substrate junction and Cell substrate adhesion signatures in the genes most correlated with PRNP expression in the CIT cohort. b Leading edge analysis highlighting ILK as an overlapping core gene in the three gene sets enriched in high PRNP expressing tumors of the CIT cohort. c Relative ILK gene expression in patients from the CIT cohort (top panel), validation cohort (middle panel) or PETACC8 cohort sample (bottom panel) within the 4 molecular subgroups according to the consensus classification.2 NT indicates non-tumors controls. p < 2e-16 for CIT and validation cohorts and p = .0033 for PETACC8 cohort, respectively (ANOVA variance analysis). p < .0001 for CMS4 vs each other CMS for CIT and validation cohorts, p = .18, p = .002 and p = .067 for CMS4 vs CMS1, CMS2 and CMS3, respectively for PETACC8 cohort sample (Tukey post hoc test). d-e Analysis of ILK gene expression in the CIT cohort (top panels), validation cohort (middle panels) or PETACC8 cohort sample (bottom panels) demonstrates significant correlations (all p < . 00001) with mRNA expression of PRNP d or with the PRNP score e, defined as the sum of the expression of the 13 PrPC-dependent genes reported in.5
Figure 1. ILK expression correlates with PRNP and is enriched in CMS4 CRC. a GSEA analysis showing enrichment of the Integrin binding, Cell substrate junction and Cell substrate adhesion signatures in the genes most correlated with PRNP expression in the CIT cohort. b Leading edge analysis highlighting ILK as an overlapping core gene in the three gene sets enriched in high PRNP expressing tumors of the CIT cohort. c Relative ILK gene expression in patients from the CIT cohort (top panel), validation cohort (middle panel) or PETACC8 cohort sample (bottom panel) within the 4 molecular subgroups according to the consensus classification.2 NT indicates non-tumors controls. p < 2e-16 for CIT and validation cohorts and p = .0033 for PETACC8 cohort, respectively (ANOVA variance analysis). p < .0001 for CMS4 vs each other CMS for CIT and validation cohorts, p = .18, p = .002 and p = .067 for CMS4 vs CMS1, CMS2 and CMS3, respectively for PETACC8 cohort sample (Tukey post hoc test). d-e Analysis of ILK gene expression in the CIT cohort (top panels), validation cohort (middle panels) or PETACC8 cohort sample (bottom panels) demonstrates significant correlations (all p < . 00001) with mRNA expression of PRNP d or with the PRNP score e, defined as the sum of the expression of the 13 PrPC-dependent genes reported in.5CC BY-NC · PubMed Central
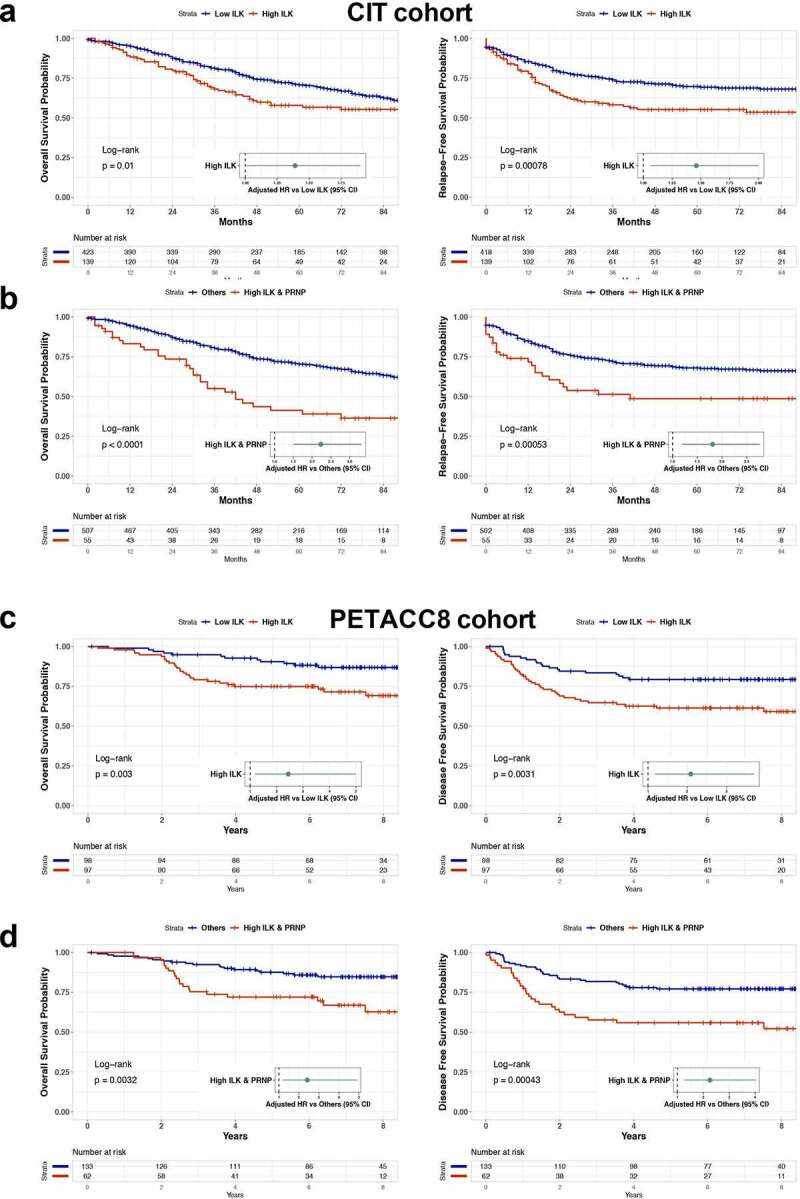
Figure 2. Prognostic impact of high ILK expression in CRC. a Kaplan-Meier overall survival (OS) (left panel) and relapse free survival (RFS) (right panel) according to high and low ILK gene expression was determined in the CIT cohort. b Kaplan-Meier OS (left panel) and RFS (right panel) comparing patients with high ILK and PRNP gene expression to other patients of the CIT cohort. Samples were grouped according to ILK and PRNP gene expression with a threshold corresponding to the 90th percentile of non-tumors samples. Hazard ratios in a and b were adjusted for sex, age at diagnosis, TNM stage and tumor location. c Kaplan-Meier OS (left panel) and disease free survival (DFS) (right panel) according to high and low ILK gene expression was determined in the PETACC8 cohort sample. d Kaplan-Meier OS (left panel) and DFS (right panel) comparing patients with high ILK and PRNP gene expression to other patients of the PETACC8 cohort sample. Median values of ILK and PRNP gene expression were used as thresholds. Hazard ratios in c and d were adjusted for age, sex, grade, TNM stage, MMR status, RAS mutation status and WHO performance
Figure 2. Prognostic impact of high ILK expression in CRC. a Kaplan-Meier overall survival (OS) (left panel) and relapse free survival (RFS) (right panel) according to high and low ILK gene expression was determined in the CIT cohort. b Kaplan-Meier OS (left panel) and RFS (right panel) comparing patients with high ILK and PRNP gene expression to other patients of the CIT cohort. Samples were grouped according to ILK and PRNP gene expression with a threshold corresponding to the 90th percentile of non-tumors samples. Hazard ratios in a and b were adjusted for sex, age at diagnosis, TNM stage and tumor location. c Kaplan-Meier OS (left panel) and disease free survival (DFS) (right panel) according to high and low ILK gene expression was determined in the PETACC8 cohort sample. d Kaplan-Meier OS (left panel) and DFS (right panel) comparing patients with high ILK and PRNP gene expression to other patients of the PETACC8 cohort sample. Median values of ILK and PRNP gene expression were used as thresholds. Hazard ratios in c and d were adjusted for age, sex, grade, TNM stage, MMR status, RAS mutation status and WHO performanceCC BY-NC · PubMed Central
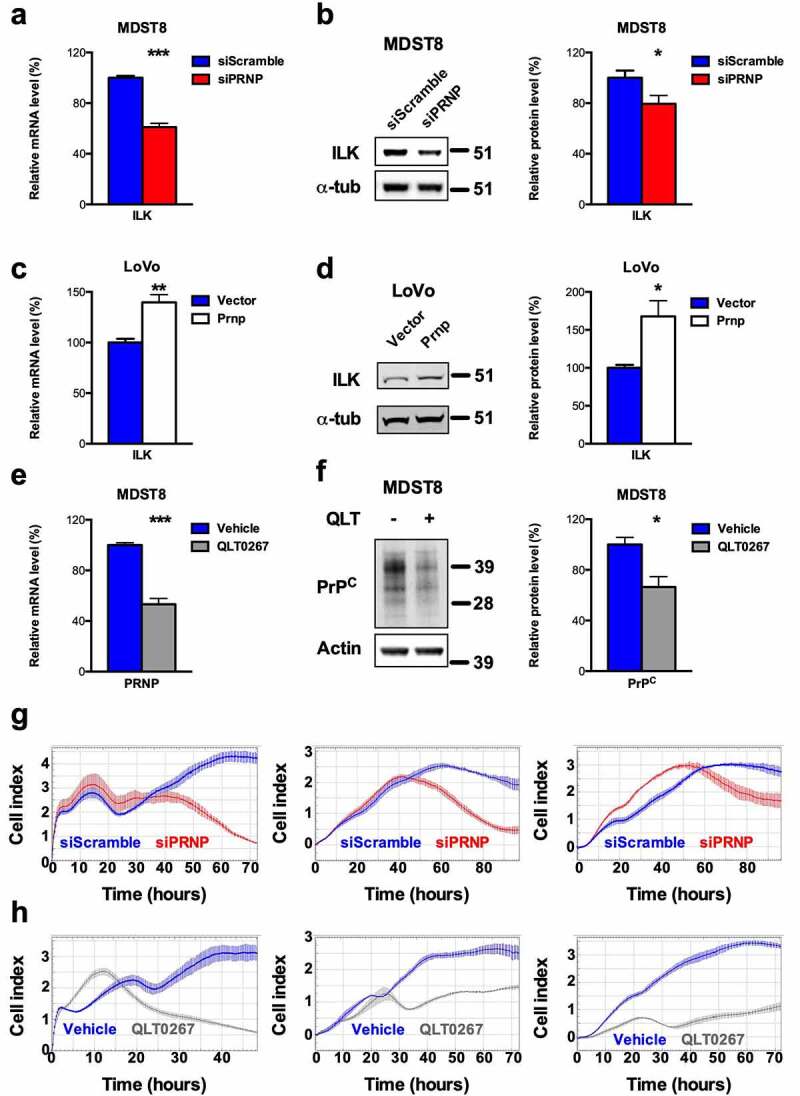
Figure 3. ILK is a target of PrPC in CRC cell lines and positively controls PrPC in a feedforward loop. a qRT-PCR analysis showing reduced expression of ILK in PRNP-silenced vs. control MDST8 cells. b Western blot analysis showing decreased expression of ILK in PRNP-silenced vs. control MDST8 cells. c qRT-PCR analysis showing increased expression of ILK in PrPC-overexpressing vs. control LoVo cells. d Western blot analysis showing increased expression of ILK in PrPC-overexpressing vs. control LoVo cells. e qRT-PCR analysis showing reduced expression of PRNP in QLT0267-treated (25 µM, 24 h) vs. control (DMSO-treated) MDST8 cells. f Western blot analysis showing decreased expression of PrPC in QLT0267-treated vs. control MDST8 cells. g Cell index measurements of PRNP-silenced vs. control MDST8 cells in proliferation/adhesion assay (E-plate, left panel), migration assay (CIMP-plate, middle panel) or invasion assay (Cultrex-coated CIMP-plate, right panel). h Cell index measurements of QLT0267-treated vs. control MDST8 cells in proliferation/adhesion assay (E-plate, left panel), migration assay (CIMP-plate, middle panel) or invasion assay (Cultrex-coated CIMP-plate, right panel). a-f Results are expressed as means of n = 2 independent triplicates of cell preparations ± s.e.m. (* p < .05, ** p < .01 and *** p < .001, two-tailed t test). g-h Graphs represent means of n = 4 replicates and are representative of n = 2 independent experiments
Figure 3. ILK is a target of PrPC in CRC cell lines and positively controls PrPC in a feedforward loop. a qRT-PCR analysis showing reduced expression of ILK in PRNP-silenced vs. control MDST8 cells. b Western blot analysis showing decreased expression of ILK in PRNP-silenced vs. control MDST8 cells. c qRT-PCR analysis showing increased expression of ILK in PrPC-overexpressing vs. control LoVo cells. d Western blot analysis showing increased expression of ILK in PrPC-overexpressing vs. control LoVo cells. e qRT-PCR analysis showing reduced expression of PRNP in QLT0267-treated (25 µM, 24 h) vs. control (DMSO-treated) MDST8 cells. f Western blot analysis showing decreased expression of PrPC in QLT0267-treated vs. control MDST8 cells. g Cell index measurements of PRNP-silenced vs. control MDST8 cells in proliferation/adhesion assay (E-plate, left panel), migration assay (CIMP-plate, middle panel) or invasion assay (Cultrex-coated CIMP-plate, right panel). h Cell index measurements of QLT0267-treated vs. control MDST8 cells in proliferation/adhesion assay (E-plate, left panel), migration assay (CIMP-plate, middle panel) or invasion assay (Cultrex-coated CIMP-plate, right panel). a-f Results are expressed as means of n = 2 independent triplicates of cell preparations ± s.e.m. (* p < .05, ** p < .01 and *** p < .001, two-tailed t test). g-h Graphs represent means of n = 4 replicates and are representative of n = 2 independent experimentsCC BY-NC · PubMed Central
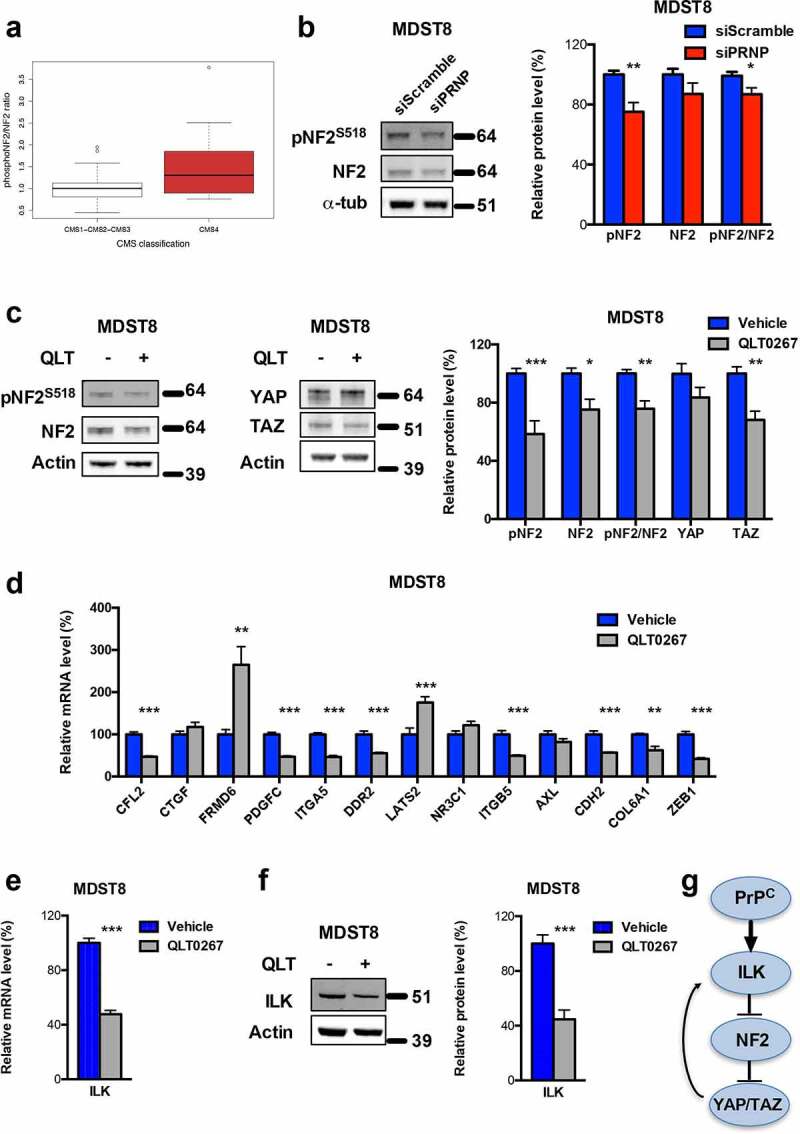
Figure 4. ILK is a major relay of PrPC downstream signaling. a Relative phosphoS518-NF2 to total NF2 protein ratio in a panel of CRC cell lines18 as a function of their CMS classification,19 p = .141 (Wilcoxon rank-sum test). b Western blot analysis showing reduced phosphoS518-NF2 protein expression and phosphoS518-NF2 to total NF2 ratio in PRNP-silenced vs. control MDST8 cells. c Western blot analysis showing reduced phosphoS518-NF2, total NF2, phosphoS518-NF2 to total NF2 and TAZ protein expression in QLT0267-treated vs. control MDST8 cells. d qRT-PCR analysis of PrPC-dependent genes in QLT0267-treated vs. control MDST8 cells showing reduced expression of CFL2, PDGFC, ITGA5, DDR2, ITGB5, CDH2, COL6A1 and ZEB1. e qRT-PCR analysis showing reduced expression of ILK in QLT0267-treated vs. control MDST8 cells. f Western blot analysis showing decreased expression of ILK in QLT0267-treated vs. control MDST8 cells. g Schematic diagram of the cascade linking PrPC, ILK and YAP/TAZ. b-f Results are expressed as means of n = 2 independent triplicates of cell preparations ± s.e.m. (* p < .05, ** p < .01 and *** p < .001, two-tailed t test)
Figure 4. ILK is a major relay of PrPC downstream signaling. a Relative phosphoS518-NF2 to total NF2 protein ratio in a panel of CRC cell lines18 as a function of their CMS classification,19 p = .141 (Wilcoxon rank-sum test). b Western blot analysis showing reduced phosphoS518-NF2 protein expression and phosphoS518-NF2 to total NF2 ratio in PRNP-silenced vs. control MDST8 cells. c Western blot analysis showing reduced phosphoS518-NF2, total NF2, phosphoS518-NF2 to total NF2 and TAZ protein expression in QLT0267-treated vs. control MDST8 cells. d qRT-PCR analysis of PrPC-dependent genes in QLT0267-treated vs. control MDST8 cells showing reduced expression of CFL2, PDGFC, ITGA5, DDR2, ITGB5, CDH2, COL6A1 and ZEB1. e qRT-PCR analysis showing reduced expression of ILK in QLT0267-treated vs. control MDST8 cells. f Western blot analysis showing decreased expression of ILK in QLT0267-treated vs. control MDST8 cells. g Schematic diagram of the cascade linking PrPC, ILK and YAP/TAZ. b-f Results are expressed as means of n = 2 independent triplicates of cell preparations ± s.e.m. (* p < .05, ** p < .01 and *** p < .001, two-tailed t test)CC BY-NC · PubMed Central
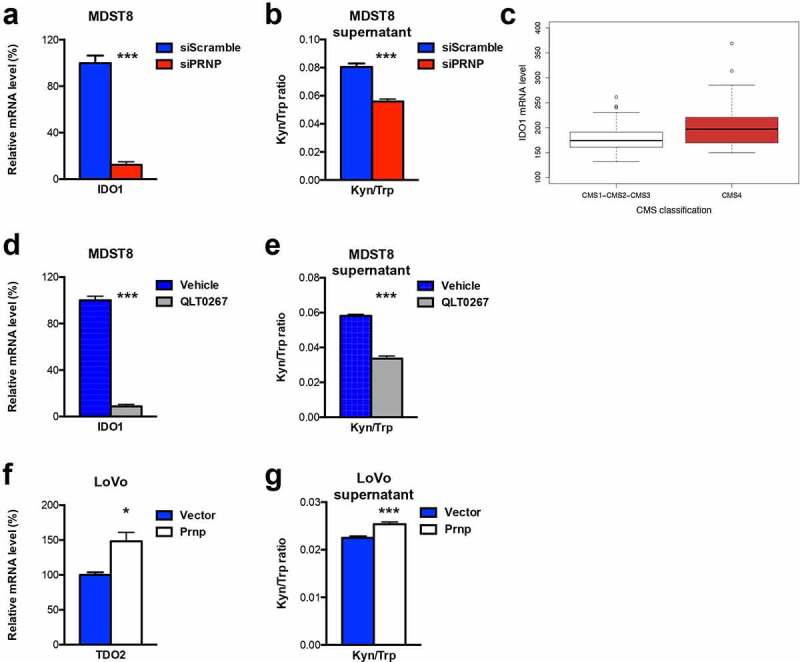
Figure 5. IDO1 is a downstream target of the PrPC-ILK axis. a qRT-PCR analysis showing reduced expression of IDO1 in PRNP-silenced vs. control MDST8 cells. b Reduced Kyn/Trp ratios in the supernatants of PRNP-silenced vs. control MDST8 cells. c Relative IDO1 mRNA expression in a panel of CRC cell lines17 as a function of their CMS classification,19 p < .0028 (Wilcoxon rank-sum test). d qRT-PCR analysis showing reduced expression of IDO1 in QLT0267-treated vs. control MDST8 cells. e Reduced Kyn/Trp ratios in the supernatants of QLT0267-treated vs. control MDST8 cells. f qRT-PCR analysis showing increased expression of TDO2 in PrPC-overexpressing vs. control LoVo cells. g Increased Kyn/Trp ratios in the supernatants of PrPC-overexpressing vs. control LoVo cells Results are expressed as means of n = 2 independent triplicates of cell preparations ± s.e.m. (* p < .05 and *** p < .001, two-tailed t test)
Figure 5. IDO1 is a downstream target of the PrPC-ILK axis. a qRT-PCR analysis showing reduced expression of IDO1 in PRNP-silenced vs. control MDST8 cells. b Reduced Kyn/Trp ratios in the supernatants of PRNP-silenced vs. control MDST8 cells. c Relative IDO1 mRNA expression in a panel of CRC cell lines17 as a function of their CMS classification,19 p < .0028 (Wilcoxon rank-sum test). d qRT-PCR analysis showing reduced expression of IDO1 in QLT0267-treated vs. control MDST8 cells. e Reduced Kyn/Trp ratios in the supernatants of QLT0267-treated vs. control MDST8 cells. f qRT-PCR analysis showing increased expression of TDO2 in PrPC-overexpressing vs. control LoVo cells. g Increased Kyn/Trp ratios in the supernatants of PrPC-overexpressing vs. control LoVo cells Results are expressed as means of n = 2 independent triplicates of cell preparations ± s.e.m. (* p < .05 and *** p < .001, two-tailed t test)CC BY-NC · PubMed Central
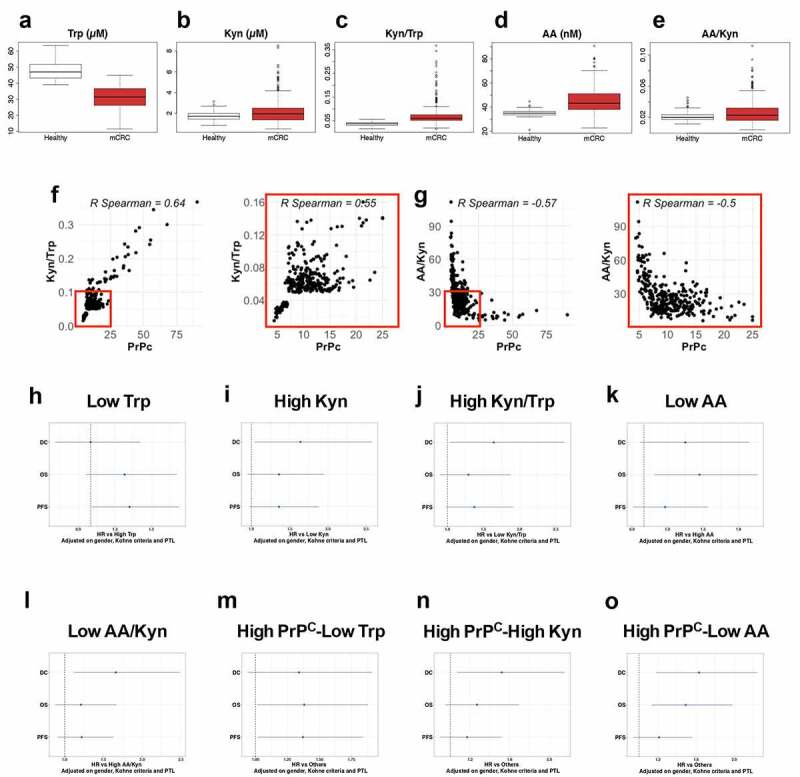
Figure 6. Trp metabolism is elevated in the plasma of mCRC patients, correlates with PrPC levels and has prognostic value. a-e Plasma levels of Trp a, Kyn b, Kyn/Trp ratios c, AA d and AA/Kyn ratios e measured in n = 275 healthy subjects and n = 325 patients with mCRC. p < 2e-16 for Trp, Kyn/Trp and AA and p = .0001 and p = . 0.0004 for Kyn and AA/Kyn, respectively (Wilcoxon rank-sum test). f-g Kyn/Trp ratios f and AA/Kyn ratios g plotted as a function of plasma PrPC levels in mCRC (n = 325 patients). Inserts show analysis restricted to samples with PrPC levels lower than 25 ng/mL. p < .0001 for all panels. h-o Forest-plots summarizing cox multivariate analyses of Trp low vs high samples h, Kyn high vs low samples i, Kyn/Trp high vs low samples j, AA low vs high samples k, AA/Kyn low vs high samples l, high PrPC-low Trp samples vs other samples m high PrPC-high Kyn samples vs other samples n and high PrPC-low AA samples vs other samples o. Dichotomization of patients by Trp, Kyn, Kyn/Trp, AA and AA/Kyn were at 28.1 µM, 1.24 µM, 0.0429, 47.6 nM and 0.03213, respectively. The threshold level for PrPC was 8.7 ng/mL, as in.5 Analyses were carried out on all patients (n = 325) and adjusted on gender, Köhne criteria and primary tumor location
Figure 6. Trp metabolism is elevated in the plasma of mCRC patients, correlates with PrPC levels and has prognostic value. a-e Plasma levels of Trp a, Kyn b, Kyn/Trp ratios c, AA d and AA/Kyn ratios e measured in n = 275 healthy subjects and n = 325 patients with mCRC. p < 2e-16 for Trp, Kyn/Trp and AA and p = .0001 and p = . 0.0004 for Kyn and AA/Kyn, respectively (Wilcoxon rank-sum test). f-g Kyn/Trp ratios f and AA/Kyn ratios g plotted as a function of plasma PrPC levels in mCRC (n = 325 patients). Inserts show analysis restricted to samples with PrPC levels lower than 25 ng/mL. p < .0001 for all panels. h-o Forest-plots summarizing cox multivariate analyses of Trp low vs high samples h, Kyn high vs low samples i, Kyn/Trp high vs low samples j, AA low vs high samples k, AA/Kyn low vs high samples l, high PrPC-low Trp samples vs other samples m high PrPC-high Kyn samples vs other samples n and high PrPC-low AA samples vs other samples o. Dichotomization of patients by Trp, Kyn, Kyn/Trp, AA and AA/Kyn were at 28.1 µM, 1.24 µM, 0.0429, 47.6 nM and 0.03213, respectively. The threshold level for PrPC was 8.7 ng/mL, as in.5 Analyses were carried out on all patients (n = 325) and adjusted on gender, Köhne criteria and primary tumor locationCC BY-NC · PubMed Central
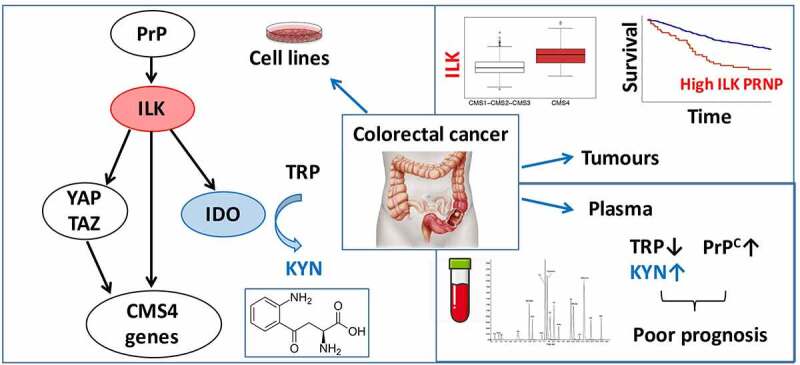
Figure 7. Schematic diagram. Molecular cascade linking PrPC with ILK and IDO1 and translational implications
Figure 7. Schematic diagram. Molecular cascade linking PrPC with ILK and IDO1 and translational implicationsCC BY-NC · PubMed Central

Verification

Claims the paper makes

The claims and statistics of this paper haven’t been checked yet.

Run the check — free, no account needed. It reads the open-access text and checks the sources it cites.

A few free checks a day · papers already verified open instantly · results are public

Claims other papers make about this one

Each is checked against this paper’s own text: does it say what the citing paper says it does?

Self-check

Percentages, sums and reported differences re-computed from the paper’s own numbers.

The self-check needs the paper’s full text.

Citations

Cites

Show all 40 references

Cited by

Sorted by citations

See all 22

Metadata

Authors
Ghazi, A., Le Corre, D., Pilati, C., Taieb, J., Aparicio, T., Didelot, A., Dedhar, S., Mulot, C., Le Malicot, K., Djouadi, F., de Reynies, A., Launay, J.-M., Laurent-Puig, P., & Mouillet-Richard, S.
Affiliations
  • Inserm (FR)
  • INSERM, Sorbonne Université, Université de Paris
  • Université Paris Cité (FR)
  • BC Cancer Agency (CA)
  • Epicad Inserm, Université de Bourgogne et and Franche Comté
  • Ligue Nationale Contre Le Cancer
  • F. Hoffmann-La Roche AG (CH)
Venue
OncoImmunology
Published
2021-01
Volume
10
Issue
1
Pages
1940674-1940674
ISSN
  • 2162-4011 (ISSN-L)
  • 2162-402X
OpenAlex
W3174249227
Cited by
21
References
40
Citations by year
2026: 1 · 2025: 3 · 2024: 5 · 2023: 6 · 2022: 4 · 2021: 2
FWCI
1.64
Type
journal article
Language
en
Open access
Locations
  • OncoImmunology (publishedVersion, cc-by-nc)
  • PubMed Central (publishedVersion, cc-by-nc)
  • PubMed (publishedVersion)
  • HAL (submittedVersion, other-oa)
  • DOAJ (DOAJ: Directory of Open Access Journals) (submittedVersion, cc-by-sa)
Funders
  • Cancéropôle Ile de France
  • Association pour la recherche sur le cancer (PJA 20171206220)
  • Institut National de la Santé et de la Recherche Médicale (NA)
  • Fondation ARCAD (NA)
  • Labex Immuno-Oncology (NA)
  • siric carpem (INCa-DGOS-INSERM-12561)
Topics
  • Health Sciences › Medicine › Oncology › Colorectal Cancer Treatments and Studies
  • Health Sciences › Medicine › Oncology › Cancer Cells and Metastasis
  • Health Sciences › Medicine › Oncology › Cancer Immunotherapy and Biomarkers
Keywords
colorectal cancer, cellular prion protein, integrin-linked kinase, IDO1, tryptophan metabolism, kynurenine pathway, prognostic factors, plasma biomarkers, tumor immune tolerance, prion protein gene, patient stratification
MeSH terms
Prion Proteins, Scaffold Protein ILK, Humans, Prognosis, Colorectal Neoplasms, Protein Serine-Threonine Kinases, Indoleamine-Pyrrole 2,3,-Dioxygenase

About these checks

Registry, retraction, Cites and statistics results are computed, not judged, with one exception: a printed reference that no index lists is read once by a model before it counts as a citation error. Claims are extracted by a model and kept only when their quote appears verbatim in the text; each cited source is then checked, with a model’s help, for whether it says what the claim relies on. Those verdicts can be wrong — read the claim’s quote and the cited source before relying on one.

Statistics and arithmetic are recomputed, not judged.

Confidence bands are shown only for fields calibrated on our annotated test set. None is calibrated yet, so no band is shown.

What counts as a claim ›How we measure confidence ›How we check this ›

Are you an author, or do you see a problem with this page? Request a review