

The DOI matches its Crossref record; 38 of the 38 references it cites were found in a registry or an index.
Prognostic marker identification based on weighted gene co-expression network analysis and associated in vitro confirmation in gastric cancer
Open accessAbstract
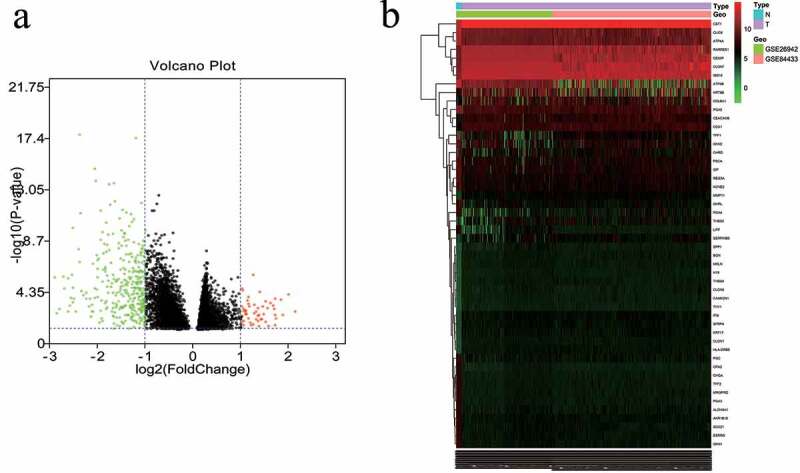
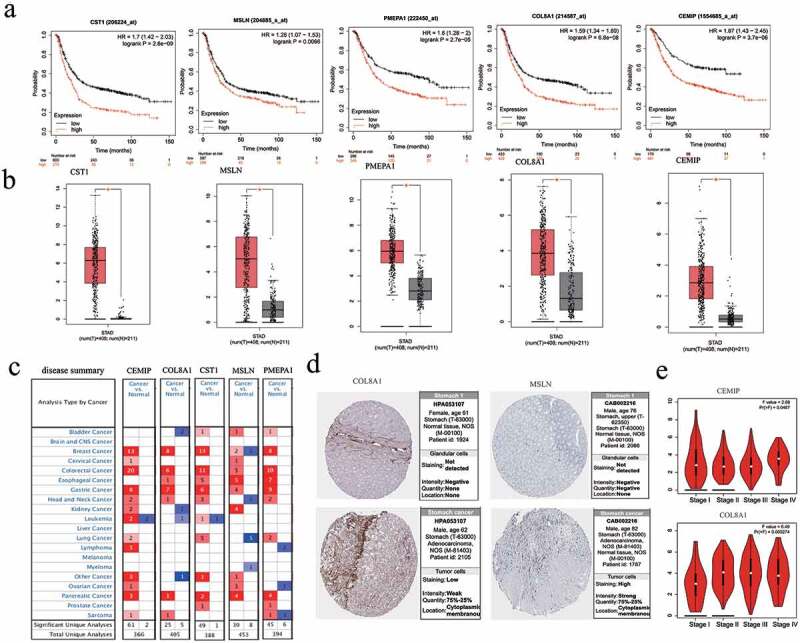
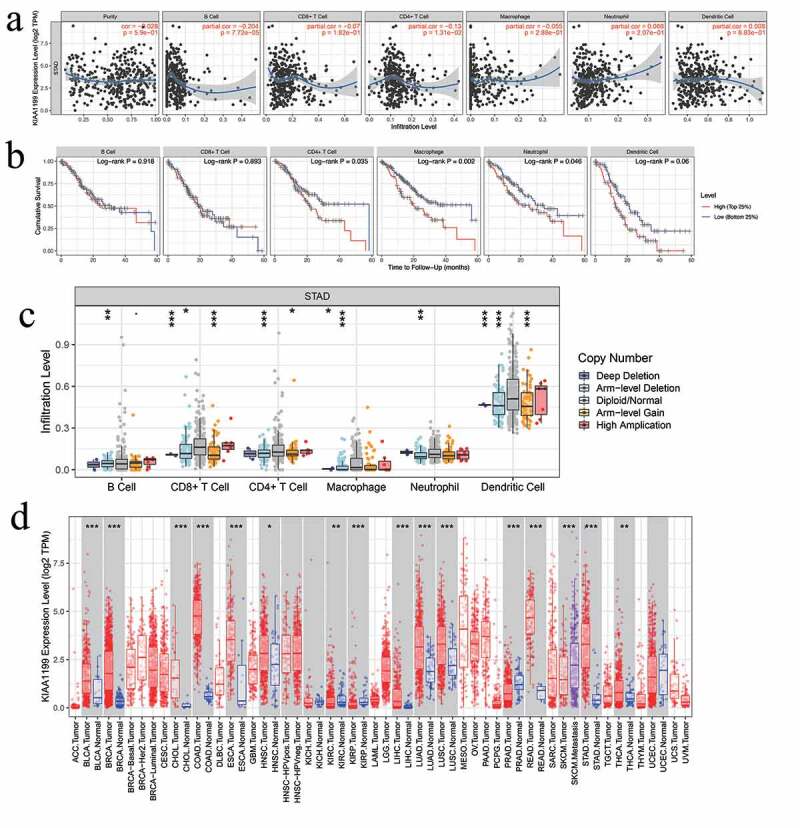
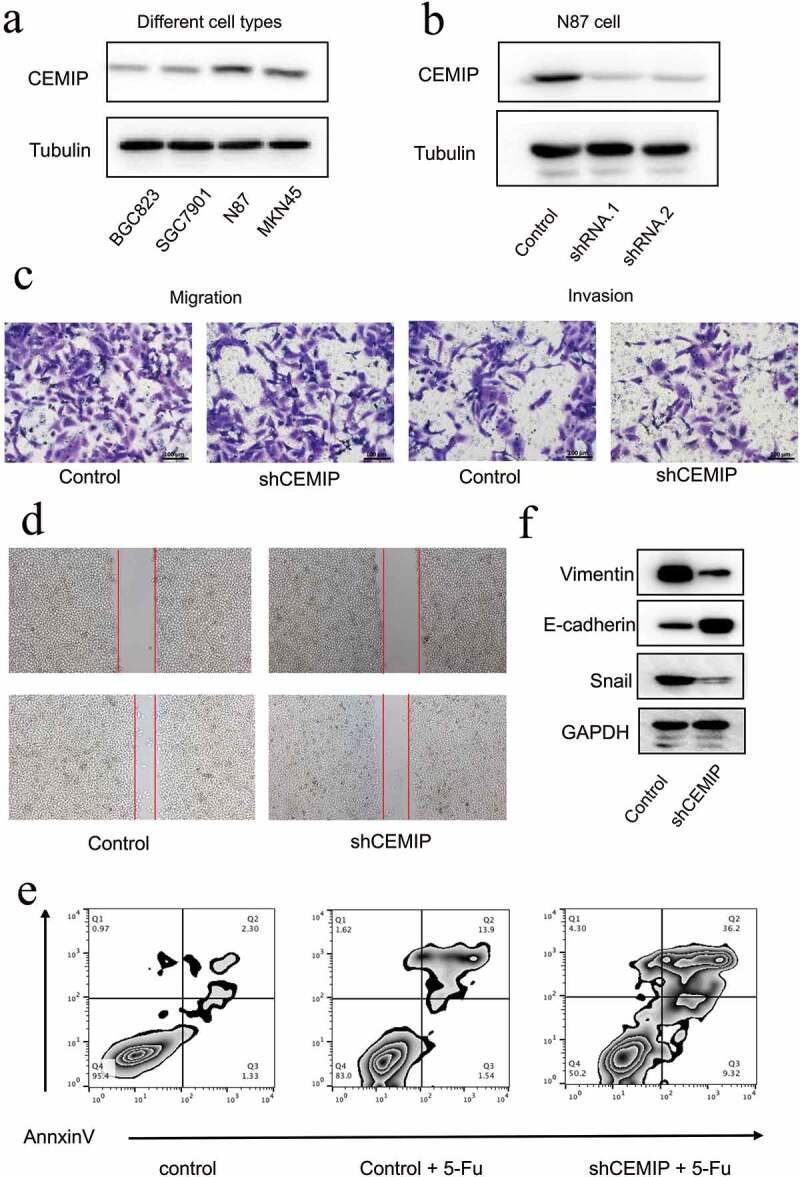
The aim of this study was to explore the potential molecular mechanisms of Gastric cancer (GC) and identify new prognostic markers for GC. RNA sequencing data were downloaded from the Gene Expression Omnibus database, and 418 differentially expressed genes (DEGs) were screened. Weighted correlation network analysis (WGCNA) was performed to identify six hub modules related to the clinical features of GC. Cytoscape software was used to identify five hub genes in the co-expression network, including CST1, CEMIP, COL8A1, PMEPA1, and MSLN. The TCGA database was used to verify hub gene expression in GC. The overall survival in the high CEMIP expression group was significantly lower than that of patients in the low CEMIP expression group. CEMIP expression was also found to be negatively correlated with B cell and CD4 + T cell infiltration. Further, associated in vitro experiments confirmed that CEMIP downregulation suppressed the proliferation and migration of GC cells and impaired the chemoresistance of GC cells to 5-fluorouracil.Our study effectively identified and validated prognostic biomarkers for GC, laying a new foundation for the therapeutic target, occurrence, and development of gastric cancer.
Overview
The claims and statistics of this paper haven’t been checked yet.
Free: it reads the open-access text and checks the first 5 claims that cite a source we can check. Create a free account to check every claim.
Integrity signals
Registry
Cites
Statistics
Figures





Verification
Claims the paper makes
The claims and statistics of this paper haven’t been checked yet.
Free: it reads the open-access text and checks the first 5 claims that cite a source we can check. Create a free account to check every claim.
Claims other papers make about this one
Each is checked against this paper’s own text: does it say what the citing paper says it does?
The cited source doesn’t support the claim as written.
In the citing paper
“Among them, CEMIP repressed the growth and migration and impaired the chemoresistance of GC cells to 5-FU, suggesting that CEMIP may be applied to precision medicine for GC patients [16].”
From Bioinformatics Analysis and Validation of Potential Markers Associated with Prediction and Prognosis of Gastric Cancer (2024) · cites this paper as [16]
Checked by a reasoning model — may be wrong.
Experimental — accuracy not yet measuredThe source backs part of the claim, not all of it — or backs it for a different population, condition or comparison.
In the citing paper
“Another study has identified DEGs by using WGCNA and detected five hub genes (CEMIP, CST1, COL8A1, PMEPA1, and MSLN) in GC and has constructed a prognostic signature with a good predictive performance by integrating multiple GEO datasets and WGCNA algorithms.”
From Bioinformatics Analysis and Validation of Potential Markers Associated with Prediction and Prognosis of Gastric Cancer (2024) · cites this paper as [16]
Experimental — accuracy not yet measured
Self-check
Percentages, sums and reported differences re-computed from the paper’s own numbers.
The self-check needs the paper’s full text.
Citations
Cites
Bray, F., Ferlay, J., Soerjomataram, I., Siegel, R. L., Torre, L. A., & Jemal, A. (2018) · CA: A Cancer Journal for Clinicians · doi:10.3322/caac.21492 · Cited by 84,109 · cited 1×
“According to the latest statistics of the World Health Organization (WHO), the incidence and mortality rates of GC in 2018 ranked fifth and third, respectively, among all malignant tumors [1].”
MethodJemal, A., Bray, F., Center, M. M., Ferlay, J., Ward, E., & Forman, D. (2011) · CA: A Cancer Journal for Clinicians · doi:10.3322/caac.20107 · Cited by 54,679
limma powers differential expression analyses for RNA-sequencing and microarray studies
Ritchie, M. E., Phipson, B., Wu, D., Hu, Y., Law, C. W., Shi, W., & Smyth, G. K. (2015) · Nucleic Acids Research · doi:10.1093/nar/gkv007 · Cited by 40,458
WGCNA: an R package for weighted correlation network analysis
Langfelder, P., & Horvath, S. (2008) · BMC Bioinformatics · doi:10.1186/1471-2105-9-559 · Cited by 27,252
Batch Normalization: Accelerating Deep Network Training by Reducing Internal Covariate Shift
Ioffe, S. (2024) · arXiv (Cornell University) · doi:10.57702/o9raffed · Cited by 14,214
GEPIA: a web server for cancer and normal gene expression profiling and interactive analyses
Tang, Z., Li, C., Kang, B., Gao, G., Li, C., & Zhang, Z. (2017) · Nucleic Acids Research · doi:10.1093/nar/gkx247 · Cited by 9,849 · cited 1×
“cn/) is an online database designed to analyze gene expression in normal and cancerous tissues [14].”
BackgroundcytoHubba: identifying hub objects and sub-networks from complex interactome
Chin, C.-H., Chen, S.-H., Wu, H.-H., Ho, C.-W., Ko, M.-T., & Lin, C.-Y. (2014) · BMC Systems Biology · doi:10.1186/1752-0509-8-s4-s11 · Cited by 6,562
Dissecting the multicellular ecosystem of metastatic melanoma by single-cell RNA-seq
Tirosh, I., Izar, B., Prakadan, S. M., Wadsworth, M. H., Treacy, D., Trombetta, J. J., Rotem, A., Rodman, C., Lian, C., Murphy, G., et al. (2016) · Science · doi:10.1126/science.aad0501 · Cited by 4,944 · cited 1×
“In 2020, the United States expected 27,600 new cases and 11,010 deaths from GC [2].”
BackgroundHelicobacter pylori Infection and the Risk of Gastric Carcinoma
Parsonnet, J., Friedman, G. D., Vandersteen, D. P., Chang, Y., Vogelman, J. H., Orentreich, N., & Sibley, R. K. (1991) · New England Journal of Medicine · doi:10.1056/nejm199110173251603 · Cited by 3,894
ONCOMINE: A Cancer Microarray Database and Integrated Data-Mining Platform
Rhodes, D. R., Yu, J., Shanker, K., Deshpande, N., Varambally, R., Ghosh, D., Barrette, T., Pander, A., & Chinnaiyan, A. M. (2004) · Neoplasia · doi:10.1016/s1476-5586(04)80047-2 · Cited by 3,612
Cited by
Matsuoka, T., & Yashiro, M. (2024) · International Journal of Molecular Sciences · doi:10.3390/ijms25115880 · Cited by 83
“Among them, CEMIP repressed the growth and migration and impaired the chemoresistance of GC cells to 5-FU, suggesting that CEMIP may be applied to precision medicine for GC patients [16].”
Background
Metadata
- Authors
- Guo, H., Yang, J., Liu, S., Qin, T., Zhao, Q., Hou, X., & Ren, L.
- Affiliations
- Guilin Medical University (CN)
- Corresponding author
- Hou, Xianliang
- Ren, Lei
- Venue
- Bioengineered
- Publisher
- Informa UK Limited
- Published
- 2021-01
- Volume
- 12
- Issue
- 1
- Pages
- 4666-4680
- ISSN
- 2165-5979 (ISSN-L)
- 2165-5987
- PMC
- PMC8806585
- OpenAlex
- W3188649812
- Cited by
- 7
- References
- 38
- Citations by year
- 2025: 1 · 2024: 1 · 2023: 1 · 2022: 4
- FWCI
- 0.97
- Type
- journal article
- Language
- en
- Open access
- gold
- doi.org
- Locations
- Bioengineered (publishedVersion, cc-by)
- PubMed Central (publishedVersion, cc-by)
- PubMed (publishedVersion)
- DOAJ (DOAJ: Directory of Open Access Journals) (submittedVersion, cc-by-sa)
- Topics
- Health Sciences › Medicine › Oncology › Gastric Cancer Management and Outcomes
- Life Sciences › Biochemistry, Genetics and Molecular Biology › Cancer Research › Cancer-related molecular mechanisms research
- Life Sciences › Biochemistry, Genetics and Molecular Biology › Molecular Biology › Bioinformatics and Genomic Networks
- Keywords
- gastric cancer, prognostic factors, CEMIP, hub genes, weighted gene co-expression network, differentially expressed genes, tumor immune infiltration, CD4+ T cells, B cells, cell proliferation and migration, CST1, COL8A1, PMEPA1, mesothelin
- MeSH terms
- Humans, Hyaluronoglucosaminidase, Prognosis, Stomach Neoplasms, Biomarkers, Tumor, Computational Biology, Gene Expression Profiling, Transcriptome
About these checks
Registry, retraction, Cites and statistics results are computed, not judged, with one exception: a printed reference that no index lists is read once by a model before it counts as a citation error. Claims are extracted by a model and kept only when their quote appears verbatim in the text; each cited source is then checked, with a model’s help, for whether it says what the claim relies on. Those verdicts can be wrong — read the claim’s quote and the cited source before relying on one.
Statistics and arithmetic are recomputed, not judged.
Confidence bands are shown only for fields calibrated on our annotated test set. None is calibrated yet, so no band is shown.
What counts as a claim ›How we measure confidence ›How we check this ›
Are you an author, or do you see a problem with this page? Request a review
How to cite
Cite CoChat for the checks on this page, and the paper for its own findings.
- This page
- CoChat. (2026). Citation check: Prognostic marker identification based on weighted gene co-expression network analysis and associated in vitro confirmation in gastric cancer. https://app.cochat.ai/papers/10.1080/21655979.2021.1957645
- The paper
- Guo, H., Yang, J., Liu, S., Qin, T., Zhao, Q., Hou, X., & Ren, L. (2021). Prognostic marker identification based on weighted gene co-expression network analysis and associated in vitro confirmation in gastric cancer. Bioengineered. https://doi.org/10.1080/21655979.2021.1957645
Data sources
Bibliographic data: Semantic Scholar, OpenAlex, Crossref.
Contains information from the Semantic Scholar Academic Graph Datasets, made available under the ODC Attribution License (ODC-BY 1.0).
Semantic Scholar’s data is described in: Kinney, R., et al. (2023). The Semantic Scholar Open Data Platform. arXiv:2301.10140.
