

The DOI matches its Crossref record; 57 of the 58 references it cites were found in a registry or an index.
Structural and Functional Regulation of Tight Junctions by RhoA and Rac1 Small GTPases
Open accessAbstract
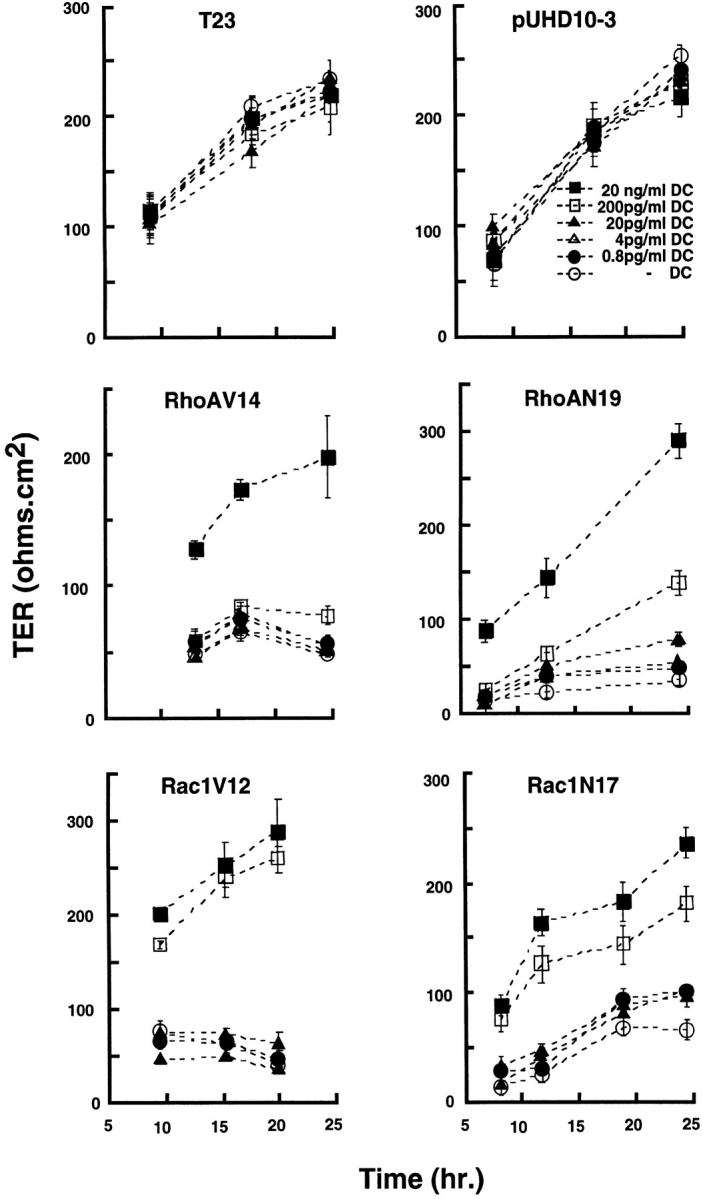
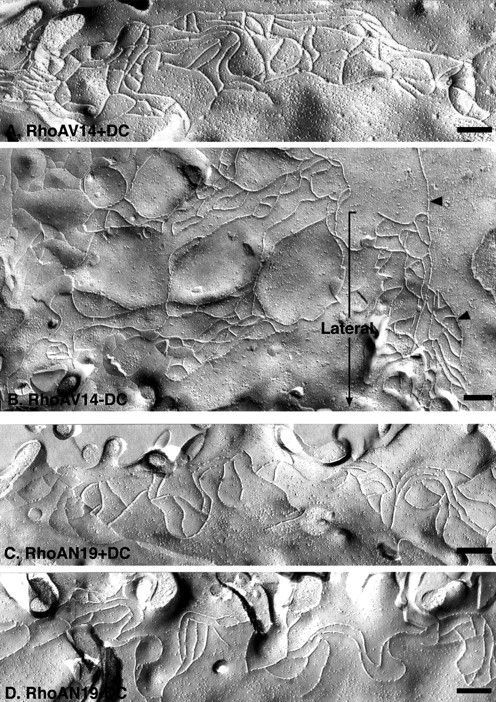
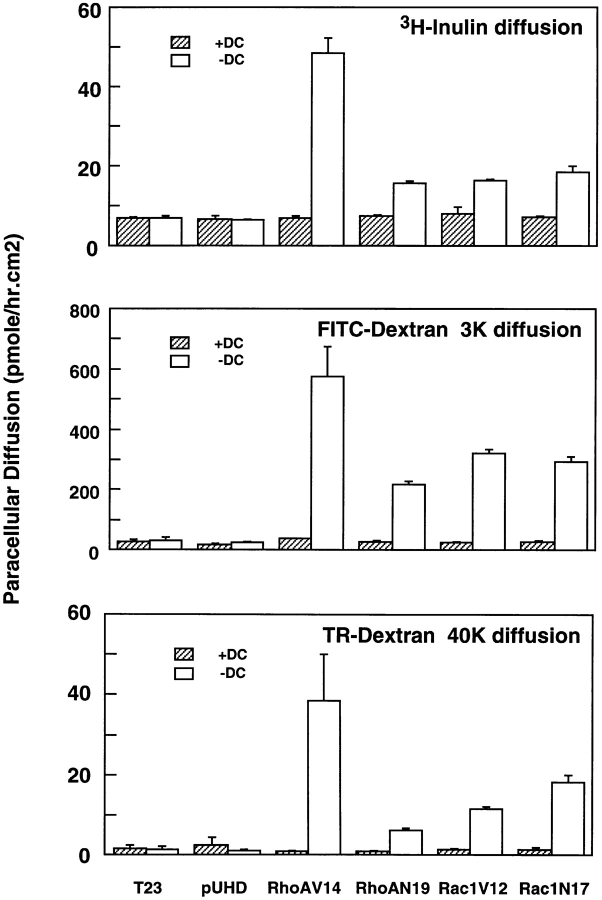
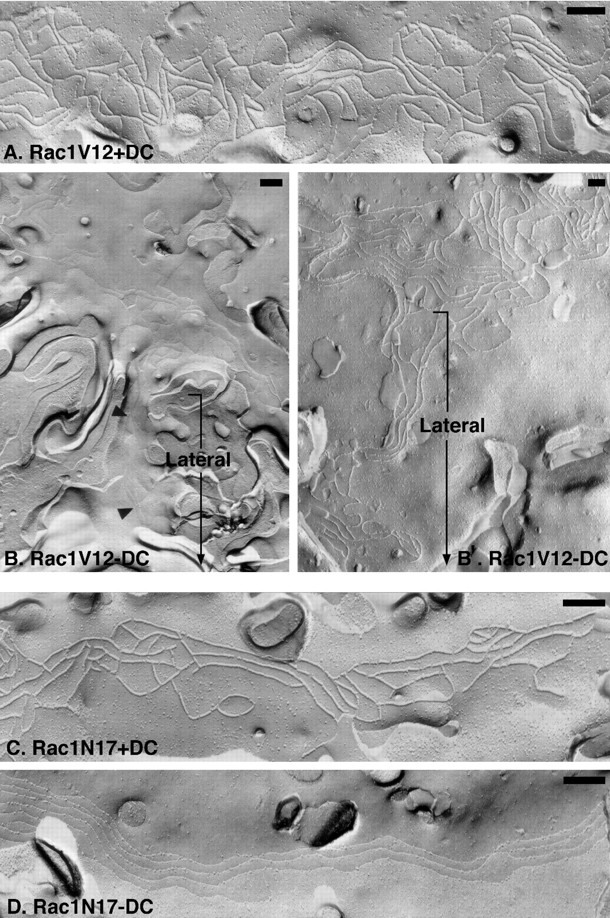
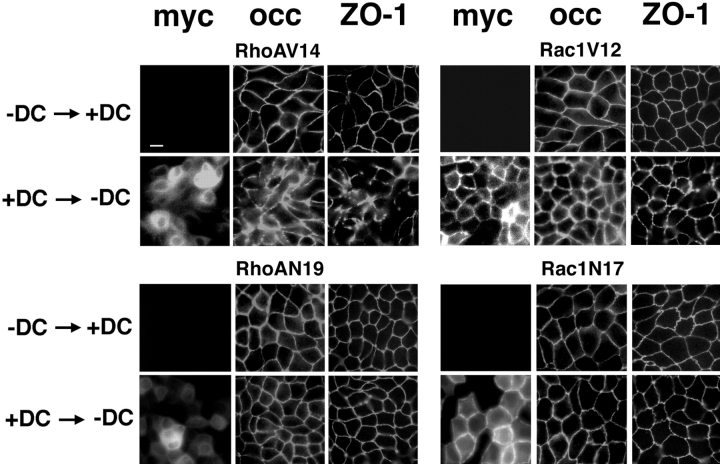
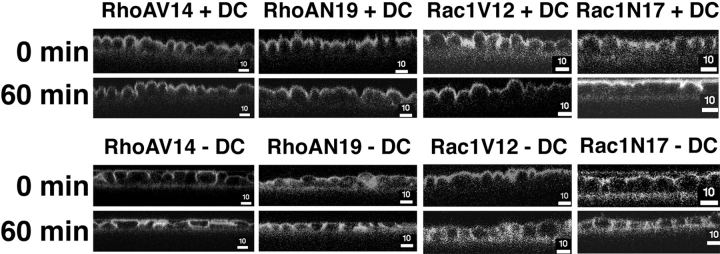
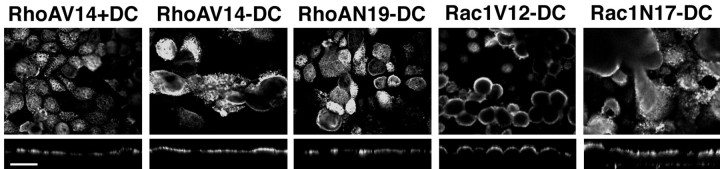
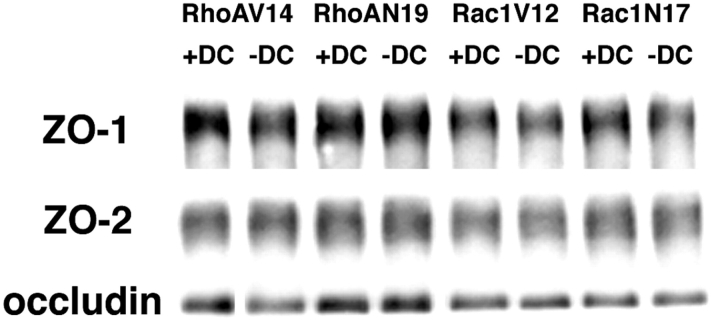
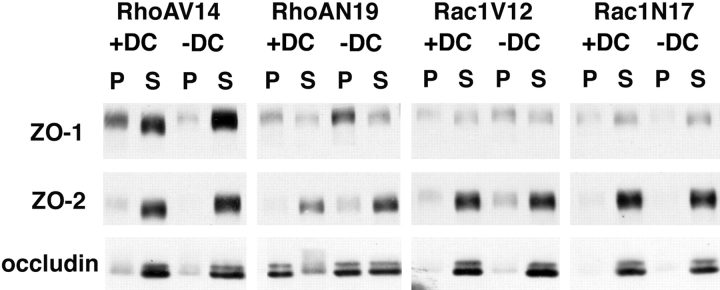
Tight junctions (TJ) govern ion and solute diffusion through the paracellular space (gate function), and restrict mixing of membrane proteins and lipids between membrane domains (fence function) of polarized epithelial cells. We examined roles of the RhoA and Rac1 GTPases in regulating TJ structure and function in MDCK cells using the tetracycline repressible transactivator to regulate RhoAV14, RhoAN19, Rac1V12, and Rac1N17 expression. Both constitutively active and dominant negative RhoA or Rac1 perturbed TJ gate function (transepithelial electrical resistance, tracer diffusion) in a dose-dependent and reversible manner. Freeze-fracture EM and immunofluoresence microscopy revealed abnormal TJ strand morphology and protein (occludin, ZO-1) localization in RhoAV14 and Rac1V12 cells. However, TJ strand morphology and protein localization appeared normal in RhoAN19 and Rac1N17 cells. All mutant GTPases disrupted the fence function of the TJ (interdomain diffusion of a fluorescent lipid), but targeting and organization of a membrane protein in the apical membrane were unaffected. Expression levels and protein complexes of occludin and ZO-1 appeared normal in all mutant cells, although ZO-1 was more readily solubilized from RhoAV14-expressing cells with Triton X-100. These results show that RhoA and Rac1 regulate gate and fence functions of the TJ, and play a role in the spatial organization of TJ proteins at the apex of the lateral membrane.
Overview
The claims and statistics of this paper haven’t been checked yet.
Run the check — free, no account needed. It reads the open-access text and checks the sources it cites.
Integrity signals
Registry
Cites
Statistics
Figures
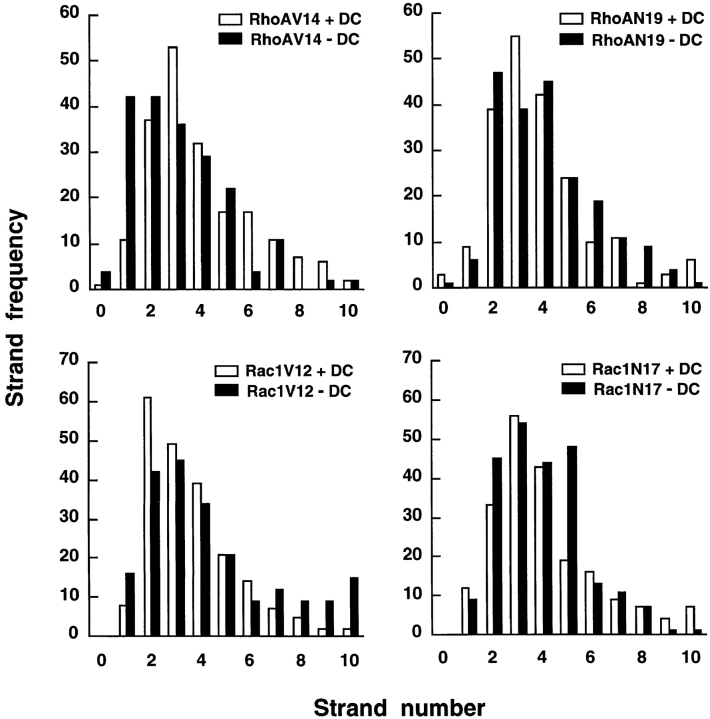
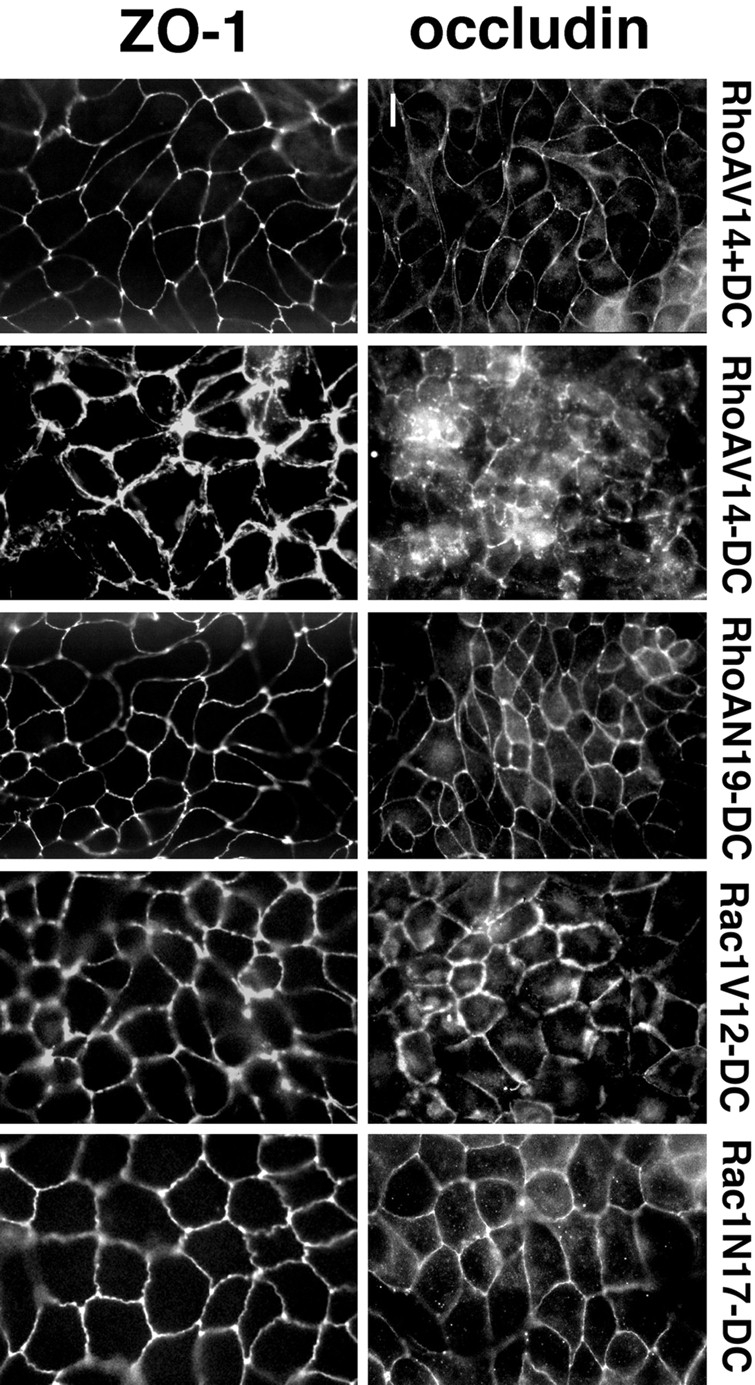
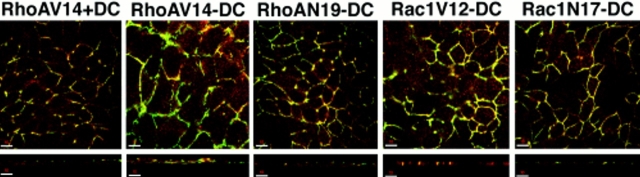
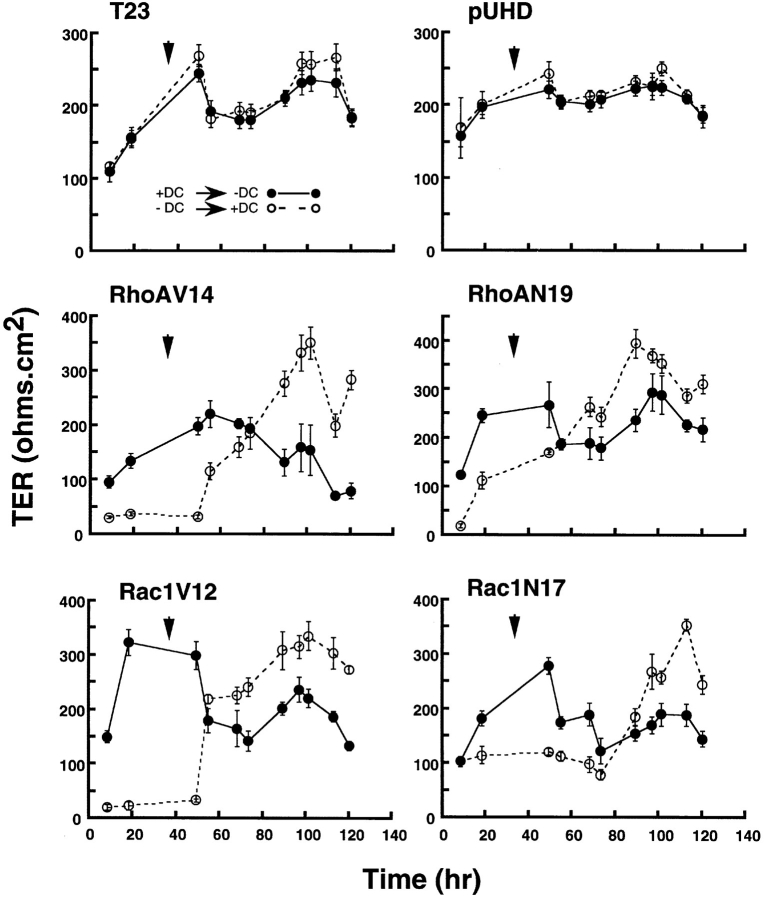
Verification
Claims the paper makes
The claims and statistics of this paper haven’t been checked yet.
Run the check — free, no account needed. It reads the open-access text and checks the sources it cites.
Claims other papers make about this one
Each is checked against this paper’s own text: does it say what the citing paper says it does?
The cited source says what the claim attributes to it.
In the citing paper
“In addition, Rac activity has been implicated in the regulation of tight junction gate and fence function (Jou et al, 1998).”
From E‐cadherin is essential for in vivo epidermal barrier function by regulating tight junctions (2005) · cites this paper as Jou et al, 1998
Self-check
Percentages, sums and reported differences re-computed from the paper’s own numbers.
The self-check needs the paper’s full text.
Citations
Cites
Rho GTPases and the Actin Cytoskeleton
Hall, A. (1998) · Science · doi:10.1126/science.279.5350.509 · Cited by 6,138
Tight control of gene expression in mammalian cells by tetracycline-responsive promoters.
Gossen, M., & Bujard, H. (1992) · Proceedings of the National Academy of Sciences · doi:10.1073/pnas.89.12.5547 · Cited by 4,943 · cited 1×
“To study roles of RhoA and Rac1 in the structural and functional organization of TJ, we generated MDCK cells that express RhoA and Rac1 mutants under the control of the tetracycline repressible transactivator (Gossen and Bujard, 1992).”
BackgroundRidley, A. J., & Hall, A. (1992) · Cell · doi:10.1016/0092-8674(92)90163-7 · Cited by 4,469
JUNCTIONAL COMPLEXES IN VARIOUS EPITHELIA
Farquhar, M. G., & Palade, G. E. (1963) · The Journal of Cell Biology · doi:10.1083/jcb.17.2.375 · Cited by 3,637
The small GTP-binding protein rac regulates growth factor-induced membrane ruffling
Ridley, A. J., Paterson, H. F., Johnston, C. L., Diekmann, D., & Hall, A. (1992) · Cell · doi:10.1016/0092-8674(92)90164-8 · Cited by 3,616
Regulation of Myosin Phosphatase by Rho and Rho-Associated Kinase (Rho-Kinase)
Kimura, K., Ito, M., Amano, M., Chihara, K., Fukata, Y., Nakafuku, M., Yamamori, B., Feng, J., Nakano, T., Okawa, K., et al. (1996) · Science · doi:10.1126/science.273.5272.245 · Cited by 2,889
Occludin: a novel integral membrane protein localizing at tight junctions.
Furuse, M., Hirase, T., Itoh, M., Nagafuchi, A., Yonemura, S., Tsukita, S., & Tsukita, S. (1993) · The Journal of cell biology · doi:10.1083/jcb.123.6.1777 · Cited by 2,580
Phosphorylation and Activation of Myosin by Rho-associated Kinase (Rho-kinase)
Amano, M., Ito, M., Kimura, K., Fukata, Y., Chihara, K., Nakano, T., Matsuura, Y., & Kaibuchi, K. (1996) · Journal of Biological Chemistry · doi:10.1074/jbc.271.34.20246 · Cited by 2,009
Proteins regulating Ras and its relatives
Boguski, M. S., & McCormick, F. P. (1993) · Nature · doi:10.1038/366643a0 · Cited by 1,905
Recognition of Unique Carboxyl-Terminal Motifs by Distinct PDZ Domains
Songyang, Z., Fanning, A. S., Fu, C., Xu, J., Marfatia, S. M., Chishti, A. H., Crompton, A., Chan, A. C., Anderson, J. M., & Cantley, L. C. (1997) · Science · doi:10.1126/science.275.5296.73 · Cited by 1,385
Cited by
Sorted by citations
Items 301–354 of 354
Tight junction proteins in glial tumors development and progression
Moskal, J., & Michalak, S. (2025) · Frontiers in Cellular Neuroscience · doi:10.3389/fncel.2025.1541885 · Cited by 7
Rho-ROCK liberates sequestered claudin for rapid de novo tight junction formation
Cho, Y., Taniguchi, A., Kubo, A., & Ikenouchi, J. (2024) · eLife · doi:10.7554/elife.102794.3 · Cited by 10
Bacterial toxins and virulence factors targeting the actin cytoskeleton and intercellular junctions
Popoff, M. R., & Stiles, B. G. (2006) · Elsevier eBooks · doi:10.1016/b978-012088445-2/50014-7 · Cited by 7
Clostridium perfringens,Clostridium difficile, and OtherClostridiumSpecies
Borriello, S. P., & Aktories, K. (2010) · Wiley eBooks · doi:10.1002/9780470688618.taw0044 · Cited by 7
Apical integrins as a switchable target to regulate the epithelial barrier
Peterson, R. J., Reed, R. C., Zamecnik, C. R., Sallam, M. A., Finbloom, J. A., Martinez, F. J., Levy, J. M., Moonwiriyakit, A., Desai, T. A., & Koval, M. H. (2024) · Journal of Cell Science · doi:10.1242/jcs.263580 · Cited by 6
Tight Junctions, a Critical Structure in the Control of Cancer Invasion and Metastasis
Jiang, W. G., Martin, T. A., Laffafian, I., & Mansel, R. E. (2006) · Kluwer Academic Publishers eBooks · doi:10.1007/0-306-48388-2_7 · Cited by 6
Palovuori, R. (2003) · Cited by 6
Intracellular Signaling in Classical and New Tight Junction Functions
Benais-Pont, G., Matter, K., & Balda, M. S. (2001) · CRC Press eBooks · doi:10.1201/9781420038538.ch17 · Cited by 8
Buret, A., Fedwick, J., & Flynn, A. (2005) · Canadian journal of gastroenterology = Journal canadien de gastroenterologie · doi:10.1155/2005/940213 · Cited by 9
Sabath, E., & Denker, B. M. (2006) · Humana Press eBooks · doi:10.1385/1-59745-113-4:61 · Cited by 5
Ultrastructure and Immunolabeling of the Tight Junction
Schneeberger, E. E., & Lynch, R. D. (2001) · CRC Press eBooks · doi:10.1201/9781420038538.ch2 · Cited by 5
Self-citationMarrs, J. A. (2010) · American Journal of Physiology-Cell Physiology · doi:10.1152/ajpcell.00145.2010 · Cited by 5
CRB3 and NF2 orchestrate cytoskeletal dynamics to control epithelial barrier assembly
Fan, S., Varadarajan, S., García‐Hernández, V., Flemming, S., Raya‐Sandino, A., Margolis, B. L., Parkos, C. A., & Nusrat, A. (2025) · JCI Insight · doi:10.1172/jci.insight.196350 · Cited by 4
AMOTL2 mono-ubiquitination by WWP1 promotes contact inhibition by facilitating LATS activation
Hwang, D., Kim, M., Kim, S., Kwon, M. R., Kang, Y.-S., Kim, D., Kang, H. C., & Lim, D. (2021) · Life Science Alliance · doi:10.26508/lsa.202000953 · Cited by 5
Regulation of Paracellular Transport across Tight Junctions by the Actin Cytoskeleton
Bruewer, M., & Nusrat, A. (2007) · Springer eBooks · doi:10.1007/0-387-36673-3_10 · Cited by 4
Axonal spectrins: All-purpose fences
Eshed‐Eisenbach, Y., & Peles, E. (2013) · The Journal of Cell Biology · doi:10.1083/jcb.201310070 · Cited by 4
Cell-Cell Interactions in the Oral Mucosa: Tight Junctions and Gap Junctions
Wan, H., Gadmor, H., & Brown, L. (2018) · Springer eBooks · doi:10.1007/978-3-319-56065-6_2 · Cited by 4
Mechanosensitive FHL2 tunes endothelial functionPreprint
Seetharaman, S., Devany, J. M., Kim, H. R., van Bodegraven, E. J., Chmiel, T. A., Shentu, T., Chou, W.-H., Fang, Y. H., & Gardel, M. L. (2024) · bioRxiv (Cold Spring Harbor Laboratory) · doi:10.1101/2024.06.16.599227 · Cited by 4
Insufficient ability of Rac1b to perturb cystogenesis
Mori, Y., Yagi, S., Sakurai, A., Matsuda, M., & Kiyokawa, E. (2013) · Small GTPases · doi:10.4161/sgtp.23311 · Cited by 3
Monaco, A., Axis, J., & Amsler, K. (2022) · Physiological Reports · doi:10.14814/phy2.15202 · Cited by 3
Nazarian, A., Azarbayjani, M. A., Atashak, S., & Peeri, M. (2022) · Andrologia · doi:10.1111/and.14394 · Cited by 2
Tight Junctions in Liver Disease
Landmann, L., & Stieger, B. (2001) · CRC Press eBooks · doi:10.1201/9781420038538.ch27 · Cited by 2
Rho-ROCK liberates sequestered claudin for rapid de novo tight junction formationPreprint
Cho, Y., Taniguchi, A., Kubo, A., & Ikenouchi, J. (2024) · eLife · doi:10.7554/elife.102794 · Cited by 2
Mechanosensitive FHL2 tunes endothelial function via microtubule-actomyosin crosstalk
Seetharaman, S., Devany, J. M., Kim, H. R., van Bodegraven, E. J., Chmiel, T. A., Shentu, T., Chou, W.-H., Fang, Y., & Gardel, M. L. (2026) · The EMBO Journal · doi:10.1038/s44318-026-00807-y · Cited by 5
Pal, B. (2015) · Scholar Works at UT Tyler (The University of Texas at Tyler) · Cited by 1
Defining innate immunity to Clostridium difficile
Jafari, N. V. (2012) · UCL Discovery (University College London) · Cited by 1
Ischemia-Induced Tight Junction Dysfunction in the Kidney
Marrs, J. A., & Molitoris, B. A. (2001) · CRC Press eBooks · doi:10.1201/9781420038538.ch25 · Cited by 1
Mechanism of Claudin Regulation in Kidney Tubular Epithelial Cells
Amoozadeh, Y. (2016) · TSpace (University of Toronto) · Cited by 1
Rho-ROCK liberates sequestered claudin for rapid de novo tight junction formationPreprint
Cho, Y., Taniguchi, A., Kubo, A., & Ikenouchi, J. (2024) · eLife · doi:10.7554/elife.102794.1 · Cited by 1
Halder, D., Esmaeilniakooshkghazi, A., Padala, C., Wang, Y., Hou, J. K., Qiu, X., Chen, L., Verzi, M. P., & Khurana, S. (2025) · bioRxiv (Cold Spring Harbor Laboratory) · doi:10.1101/2025.10.27.684895 · Cited by 1
Occludin, a Constituent of Tight Junctions
Chen, Y., Goodenough, D. A., & Lu, Q. (2007) · Springer eBooks · doi:10.1007/0-387-36673-3_2
Töyli, M. (2011) · Työväentutkimus Vuosikirja
Cell Matrix Adhesion in Three Dimensions
Keely, P. J. (2008) · doi:10.1002/9783527622092.ch7
The function of Tiam1 in tumor cell biology
Rygiel, T. P. (2009) · UvA-DARE (University of Amsterdam)
Signalling by Ras and Rho GTPases
Wallace, S. W., & Jaffe, A. B. (2007) · Wiley eBooks · doi:10.1002/9780470025079.chap216
Wnt signaling affects cell adhesion and neuronal differentiation
Lindqvist, M. (2008) · Figshare
Somasekharan, S. (2008) · K-State Research Exchange (Kansas State University)
Density-Enhanced Protein Tyrosine Phosphatase 1 (DEP-1) Regulation of Epithelial Cell Adhesions
Sallee, J. L. (2019) · Carolina Digital Repository (University of North Carolina at Chapel Hill) · doi:10.17615/bfng-3q19
Robinson, J., Gartin, C., Sisson, J. H., & Wyatt, T. A. (2010) · doi:10.1164/ajrccm-conference.2010.181.1_meetingabstracts.a6377
Analysis of the role of Rho GTPases in epithelial cells
Stanley, A. (2014) · Arrow@dit (Dublin Institute of Technology) · doi:10.13025/16338
assemblyA2 heterotetramer: role in tight junction
Lee, D. B. N., Jamgotchian, N. J., Allen, S. G., Kan, F. W. K., & Irene, L. (2016)
Junctional Proteins of the Blood–CSF Barrier
Galla, H., & Angelow, S. (2005) · CRC Press eBooks · doi:10.1201/9781420023404.ch3
Optical Methods for the Study of Tight Junctions
Kovbasnjuk, O. N., & Spring, K. R. (2001) · CRC Press eBooks · doi:10.1201/9781420038538.ch9
Flow Mechanotransduction Response in Endothelial Cell Monolayers and Platelets
Ting, L. H. (2013) · ResearchWorks at the University of Washington (University of Washington)
Wilk, R., Pickup, A. T., & Lipshitz, H. D. (2006) · Wiley-VCH eBooks · doi:10.1002/3527600906.mcb.200300044
Tight Junctions and Signaling Pathways in Cancer
Khurshid, S., Haq, B. U., Khursheed, S., Sadida, H. Q., Masoodi, T., Singh, M. K., Akil, A. S. A.-S., Bhat, A. A., & Macha, M. A. (2023) · Springer eBooks · doi:10.1007/978-981-99-2415-8_6
Ait-Belgnaoui, A. (2006) · OpenGrey (Institut de l'Information Scientifique et Technique)
Fan, S., Varadarajan, S., García‐Hernández, V., Margolis, B. L., Parkos, C. A., & Nusrat, A. (2025) · bioRxiv (Cold Spring Harbor Laboratory) · doi:10.1101/2025.01.15.633166
Rho-ROCK liberates sequestered claudin for rapid de novo tight junction formationPreprint
Cho, Y., Taniguchi, A., Kubo, A., & Ikenouchi, J. (2025) · eLife · doi:10.7554/elife.102794.2
Rho GTpases in Cell Motility and Tumorigenesis
Hajdo-Milašinović, A., Mertens, A. E. E., Hamelers, I. H. L., & Collard, J. G. (2006) · Cancer metastasis · doi:10.1007/1-4020-4009-1_9
Control by CCM complex of the dialog between integrins and cadherins for the vascular stability
Lisowska, J. (2014) · theses.fr (ABES) · doi:10.70675/15295310zf24bz4fe3zb7d8z90acc0afe2a7
Elbediwy, A. (2013) · UCL Discovery (University College London)
Metadata
- Authors
- Jou, T.-S., Schneeberger, E. E., & James Nelson, W.
- Affiliations
- Massachusetts General Hospital (US)
- *Department of Molecular and Cellular Physiology, Stanford University School of Medicine, Stanford, CA 94305-5345; ‡Department of Pathology, Massachusetts General Hospital, Boston, MA 02114
- ORCID
- Jou, Tzuu-Shuh
- Venue
- The Journal of Cell Biology
- Publisher
- Rockefeller University Press
- Published
- 1998-07-13
- Volume
- 142
- Issue
- 1
- Pages
- 101-115
- ISSN
- 0021-9525 (ISSN-L)
- 1540-8140
- PMC
- PMC2133025
- OpenAlex
- W2046587126
- Cited by
- 354
- References
- 58
- Citations by year
- 2026: 1 · 2025: 7 · 2024: 5 · 2023: 2 · 2022: 5 · 2021: 6 · 2020: 3 · 2019: 5 · 2018: 3 · 2017: 5 · 2016: 5 · 2015: 4 · 2014: 16 · 2013: 10 · 2012: 14
- FWCI
- 16.95
- Type
- journal article
- Language
- en
- Open access
- green
- www.ncbi.nlm.nih.gov
- Licence
- cc-by-nc-sa
- Locations
- The Journal of Cell Biology (publishedVersion)
- Europe PMC (PubMed Central) (publishedVersion, cc-by-nc-sa)
- PubMed Central (publishedVersion, cc-by-nc-sa)
- PubMed (publishedVersion)
- Topics
- Life Sciences › Neuroscience › Neurology › Barrier Structure and Function Studies
- Life Sciences › Biochemistry, Genetics and Molecular Biology › Molecular Biology › Protein Kinase Regulation and GTPase Signaling
- Health Sciences › Medicine › Immunology and Allergy › Cell Adhesion Molecules Research
- Keywords
- tight junctions, RhoA, Rac1, small GTPases, paracellular permeability, occludin, ZO-1, MDCK cells, epithelial polarity, transepithelial electrical resistance, membrane protein targeting, membrane lateral organization
- MeSH terms
- Animals, Cell Line, Cell Membrane, Detergents, Dogs, Epithelial Cells, Membrane Proteins, Phosphoproteins, Solubility, Mutagenesis, Octoxynol, Tight Junctions, GTP-Binding Proteins, GTP Phosphohydrolases, rhoA GTP-Binding Protein, rac GTP-Binding Proteins, Occludin, Zonula Occludens-1 Protein, Zonula Occludens-2 Protein
About these checks
Registry, retraction, Cites and statistics results are computed, not judged, with one exception: a printed reference that no index lists is read once by a model before it counts as a citation error. Claims are extracted by a model and kept only when their quote appears verbatim in the text; each cited source is then checked, with a model’s help, for whether it says what the claim relies on. Those verdicts can be wrong — read the claim’s quote and the cited source before relying on one.
Statistics and arithmetic are recomputed, not judged.
Confidence bands are shown only for fields calibrated on our annotated test set. None is calibrated yet, so no band is shown.
What counts as a claim ›How we measure confidence ›How we check this ›
Are you an author, or do you see a problem with this page? Request a review
