

The DOI matches its Crossref record; 21 of the 21 references it cites were found in a registry or an index.
An Essential Role for Katanin in Severing Microtubules in the Neuron
Open accessAbstract
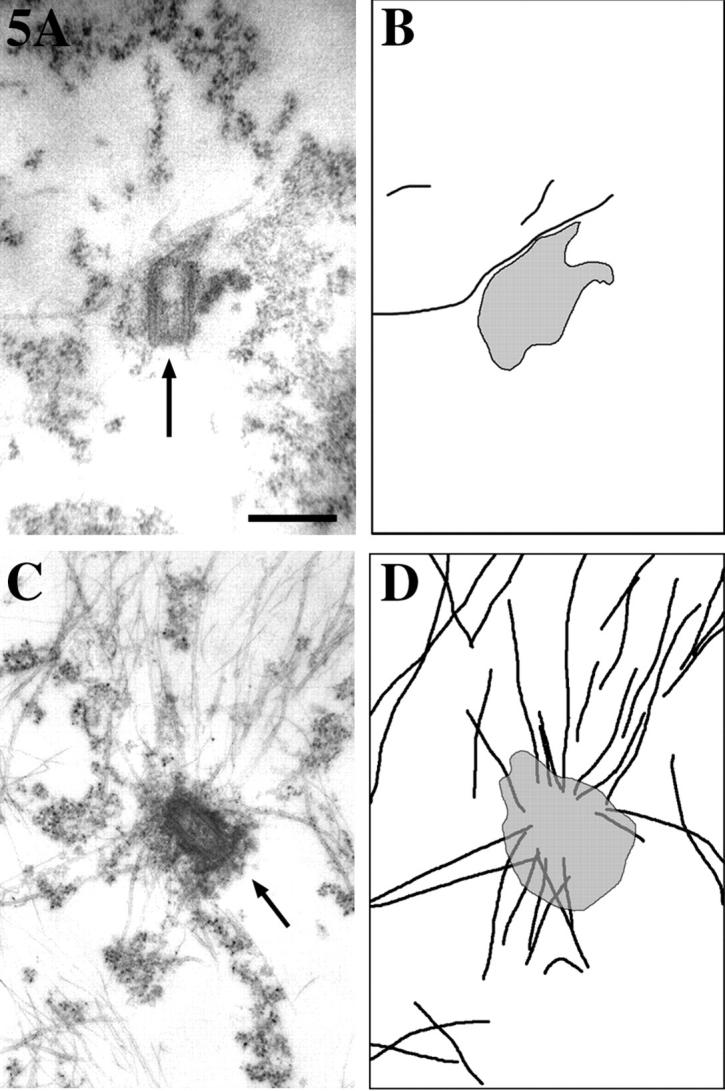
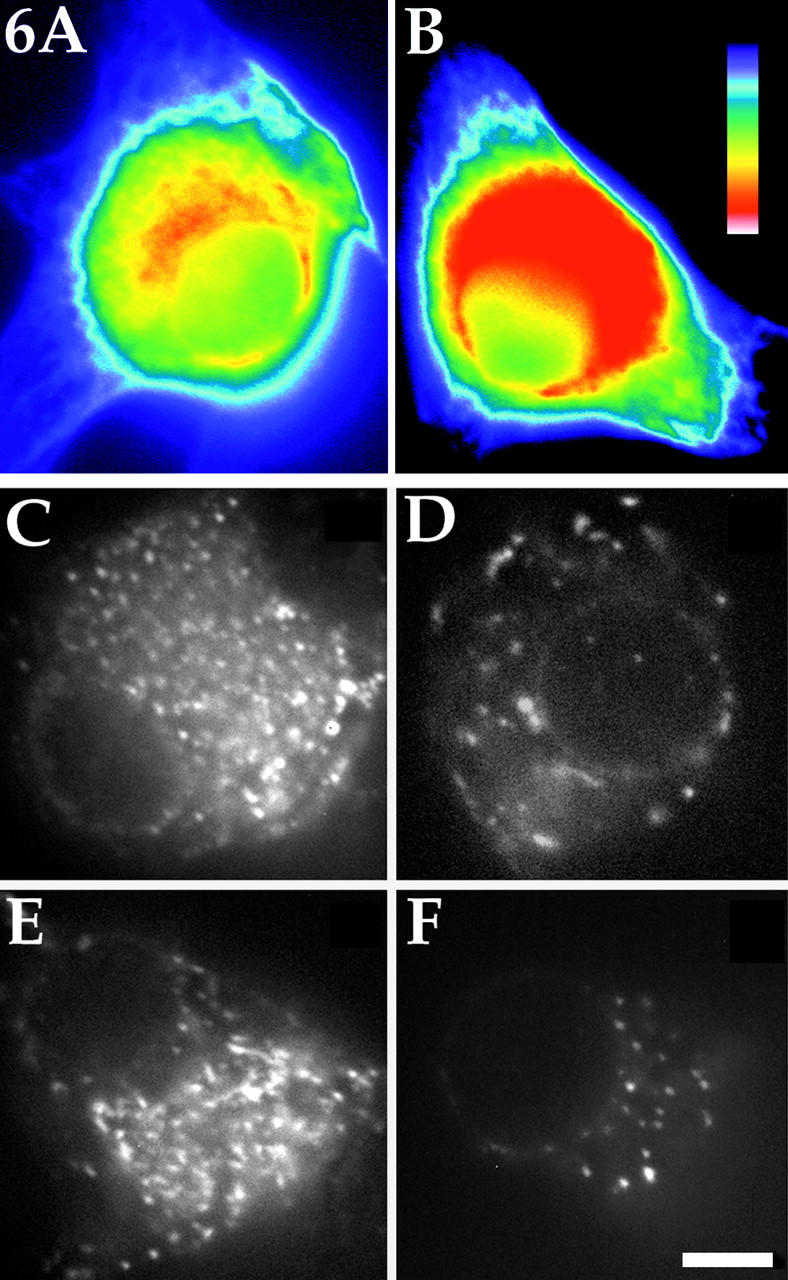
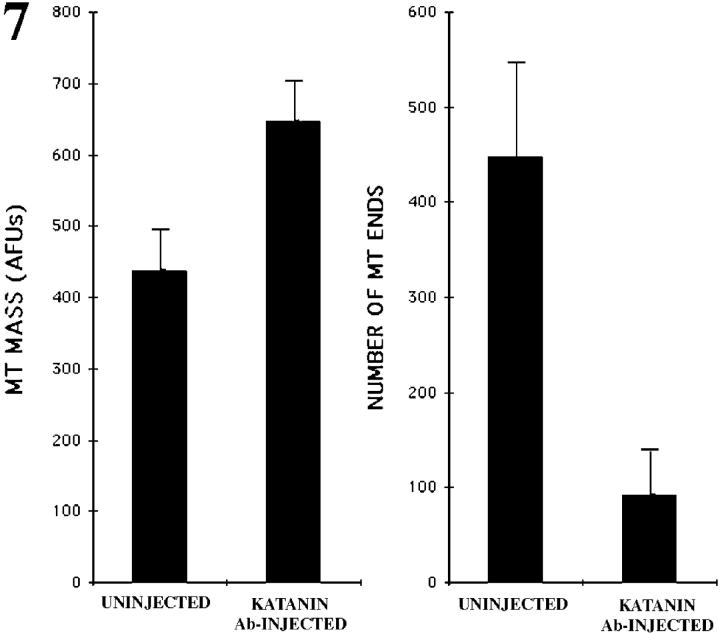
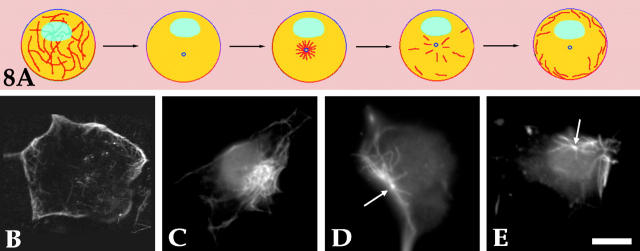
Several lines of evidence suggest that microtubules are nucleated at the neuronal centrosome, and then released for transport into axons and dendrites. Here we sought to determine whether the microtubule-severing protein known as katanin mediates microtubule release from the neuronal centrosome. Immunomicroscopic analyses on cultured sympathetic neurons show that katanin is present at the centrosome, but is also widely distributed throughout the neuron. Microinjection of an antibody that inactivates katanin results in a dramatic accumulation of microtubules at the centrosome, indicating that katanin is indeed required for microtubule release from the centrosome. However, the antibody also causes an inhibition of axon outgrowth that is more immediate than expected on this basis alone. It may be that katanin severs microtubules throughout the cell body to keep them sufficiently short to be efficiently transported into developing processes. Consistent with this idea, there were significantly fewer free ends of microtubules in the cell bodies of neurons that had been injected with the katanin antibody compared with controls. These results indicate that microtubule-severing by katanin is essential for releasing microtubules from the neuronal centrosome, and also for regulating the length of the microtubules after their release.
Overview
The claims and statistics of this paper haven’t been checked yet.
Run the check — free, no account needed. It reads the open-access text and checks the sources it cites.
Integrity signals
Registry
Cites
Statistics
Figures
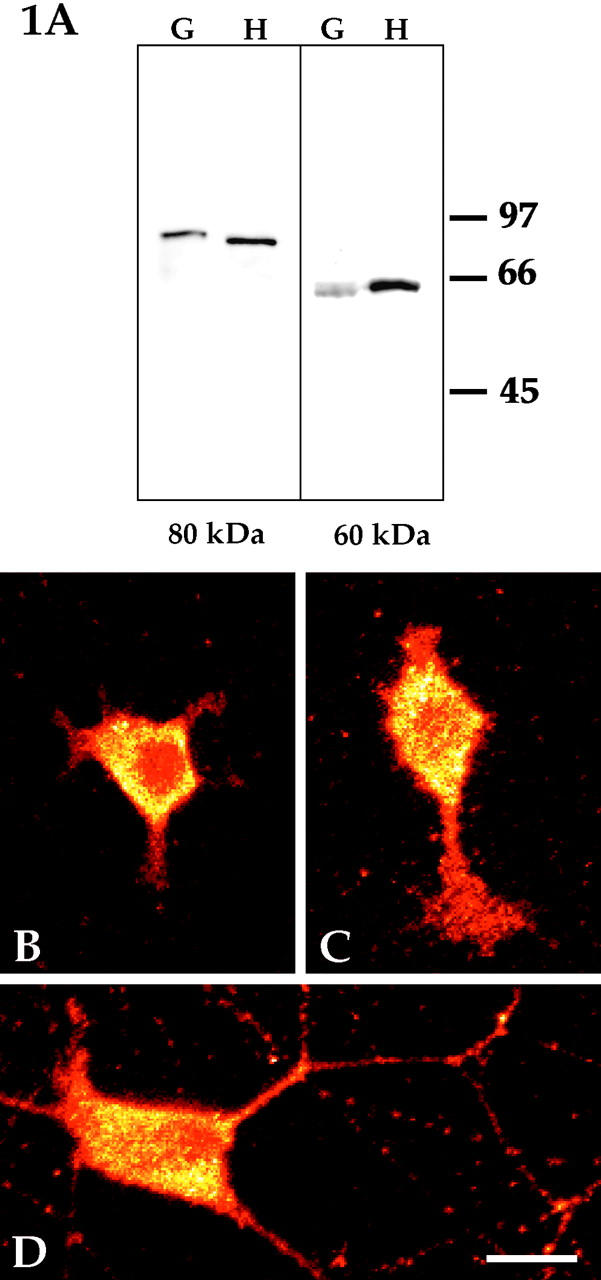
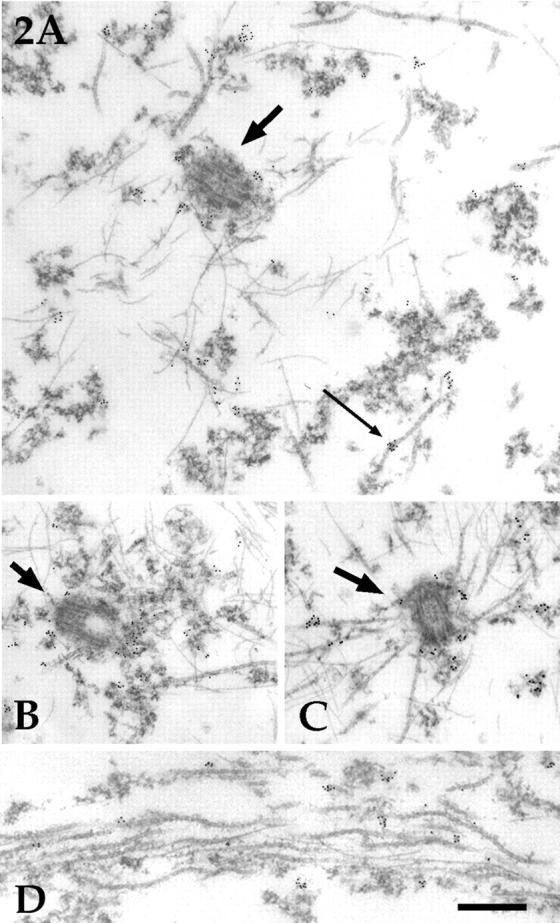
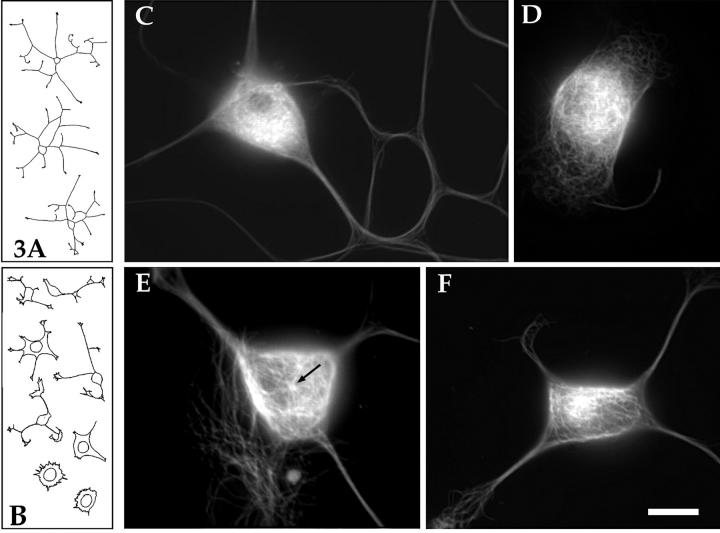
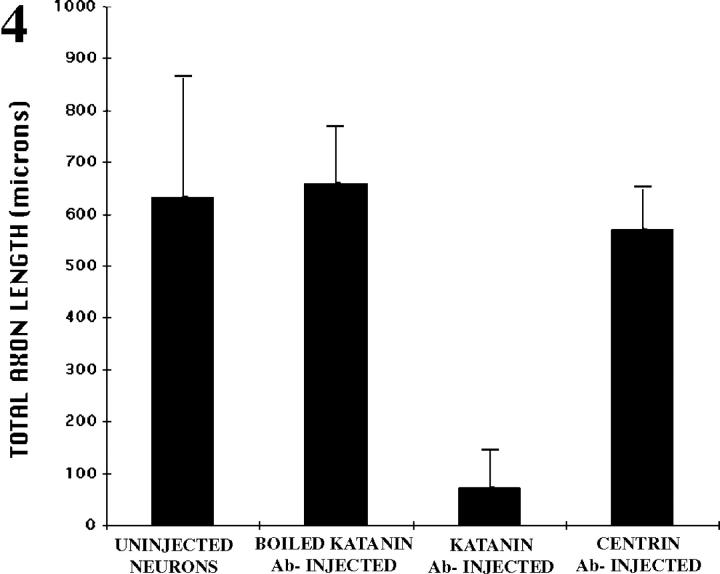
Verification
Claims the paper makes
The claims and statistics of this paper haven’t been checked yet.
Run the check — free, no account needed. It reads the open-access text and checks the sources it cites.
Claims other papers make about this one
Each is checked against this paper’s own text: does it say what the citing paper says it does?
In the citing paper
“Some of the aforementioned microtubule-related genes, specifically those associated with axonal transport and known to play a role in post-mitotic neural wiring and plasticity93, are associated with signals of positive selection, such as KIF18A94 or KATNA195,96.”
From A catalog of single nucleotide changes distinguishing modern humans from archaic hominins (2019) · cites this paper as [95]
Self-check
Percentages, sums and reported differences re-computed from the paper’s own numbers.
The self-check needs the paper’s full text.
Citations
Cites
Identification of katanin, an ATPase that severs and disassembles stable microtubules
McNally, F. J., & Vale, R. D. (1993) · Cell · doi:10.1016/0092-8674(93)90377-3 · Cited by 537
Self-citationHartman, J. J., Mahr, J., McNally, K. P., Okawa, K., Iwamatsu, A., Thomas, S. M., Cheesman, S., Heuser, J., Vale, R. D., & McNally, F. J. (1998) · Cell · doi:10.1016/s0092-8674(00)81578-0 · Cited by 350
Self-citationMicrotubule release from the centrosome
Keating, T. J., Peloquin, J. G., Rodionov, V., Momcilovic, D., & Borisy, G. G. (1997) · Proceedings of the National Academy of Sciences · doi:10.1073/pnas.94.10.5078 · Cited by 250
Sanders, M. C., & Salisbury, J. L. (1994) · The Journal of Cell Biology · doi:10.1083/jcb.124.5.795 · Cited by 220
Cytoplasmic Dynein and Dynactin Are Required for the Transport of Microtubules into the Axon
Ahmad, F. J., Echeverri, C. J., Vallee, R. B., & Baas, P. W. (1998) · The Journal of Cell Biology · doi:10.1083/jcb.140.2.391 · Cited by 216
Self-citationChanges in microtubule number and length during axon differentiation
Yu, W., & Baas, P. (1994) · The Journal of Neuroscience · doi:10.1523/jneurosci.14-05-02818.1994 · Cited by 213
Self-citationMicrotubules and Neuronal Polarity
Baas, P. W. (1999) · Neuron · doi:10.1016/s0896-6273(00)80675-3 · Cited by 186
Self-citationMicrotubule fragmentation and partitioning in the axon during collateral branch formation
Yu, W., Ahmad, F., & Baas, P. (1994) · Journal of Neuroscience · doi:10.1523/jneurosci.14-10-05872.1994 · Cited by 145
Self-citationIdentification of a Microtubule-associated Motor Protein Essential for Dendritic Differentiation
Sharp, D. J., Yu, W., Ferhat, L., Kuriyama, R., Rueger, D. C., & Baas, P. W. (1997) · The Journal of Cell Biology · doi:10.1083/jcb.138.4.833 · Cited by 133
Self-citationMicrotubule nucleation and release from the neuronal centrosome
Yu, W., Centonze, V. E., Ahmad, F., & Baas, P. (1993) · The Journal of Cell Biology · doi:10.1083/jcb.122.2.349 · Cited by 132
Self-citation
Cited by
Sorted by citations
Items 201–253 of 253
Tubulin glutamylation is key to axon guidance via selective tuning of microtubule-severing enzymesPreprint
Martín, D. T., Jardin, N., Vougny, J., Giudicelli, F., Gasmi, L., Henriot, V., Lebrun, L., Haumaître, C., Kneussel, M., Nicol, X., et al. (2022) · bioRxiv (Cold Spring Harbor Laboratory) · doi:10.1101/2022.01.20.477127 · Cited by 4
UNC-45A Breaks MT Lattice Independent of its Effect on Non-Muscle Myosin II
Habicht, J., Mooneyham, A., Hoshino, A., Shetty, M., Zhang, X., Emmings, E., Yang, Q., Coombes, C., Gardner, M. K., & Bazzaro, M. (2020) · Journal of Cell Science · doi:10.1242/jcs.248815 · Cited by 15
Cep215 is essential for morphological differentiation of astrocytes
Kang, D., Shin, W., Yoo, H., Kim, S., Lee, S., & Rhee, K. (2020) · Scientific Reports · doi:10.1038/s41598-020-72728-7 · Cited by 3
The interaction between KATNA1 and CRMP3 modulates microtubule dynamics and neurite outgrowth
Xie, Z., Song, W., Meng, Z., Ma, A., Zhu, J., Liang, Y., Lin, H., Lei, C., & Tan, M. (2025) · Biochemical and Biophysical Research Communications · doi:10.1016/j.bbrc.2025.151426 · Cited by 3
Keller, J. A. (2020) · Zenodo (CERN European Organization for Nuclear Research) · doi:10.5281/zenodo.3925968 · Cited by 3
Mechanisms of cortical microtubule organization in epidermal keratinocytes
Guo, K., & Merdes, A. (2025) · Cellular and Molecular Life Sciences · doi:10.1007/s00018-025-05714-9 · Cited by 2
A potential posttranscriptional regulator for p60‐katanin : miR‐124‐3p
Kaya, Y., Korulu, Ş., Tunoğlu, E. N. Y., & Yıldız, A. (2023) · Cytoskeleton · doi:10.1002/cm.21769 · Cited by 2
Георгиев, Д. (2008) · Cited by 2
Li, W., Wang, Z., & Jia, S. (2004) · Chinese Science Bulletin · doi:10.1007/bf02901738 · Cited by 2
Axon-specific microtubule regulation drives asymmetric regeneration of sensory neuron axonsPreprint
Costa, A. C., Murillo, B. R., Bessa, R., Ribeiro, R., da Silva, T. F., Porfírio-Rodrigues, P., Martins, G. G., Brites, P., Kneussel, M., Misgeld, T., et al. (2024) · eLife · doi:10.7554/elife.104069 · Cited by 2
Fertility is compromised after oocyte-specific deletion of microtubule severing protein Katanin A1
Yuen, W. S., Zhang, Q.-H., Dunstan, M., Adhikari, D., O’Connor, A. E., Dunleavy, J. E. M., O’Bryan, M. K., & Carroll, J. (2025) · Molecular Human Reproduction · doi:10.1093/molehr/gaaf034 · Cited by 1
Saccharin enhances neurite extension by regulating organization of the microtubules
Yamashita, H., Muroi, Y., & Ishii, T. (2013) · Life Sciences · doi:10.1016/j.lfs.2013.09.023 · Cited by 1
Чернобельская, О. А., Grigoriev, I., Alieva, I. B., & Vorobjev, I. A. (2001) · Russian Journal of Developmental Biology · doi:10.1023/a:1009413211185 · Cited by 1
Principles of Microtubule Organization: Insight from the Study of Neurons
Sánchez-Huertas, C., Freixo, F., & Lüders, J. (2016) · Springer eBooks · doi:10.1007/978-3-7091-1903-7_4 · Cited by 1
Creating Tools to Determine Whether Katanin 60 Affects Female Rejection of Males in Drosophila
Isaacson, J. (2018) · Scholarship@Western (Western University) · Cited by 1
Stochastic modeling of intracellular processes : bidirectional transport and microtubule dynamics
Ebbinghaus, M. (2010) · HAL · doi:10.22028/d291-22706 · Cited by 1
Investigating Tau pathology in an in vitro model for Alzheimer’s disease
Powrie, Y. S. L. (2016) · SUNScholar (Stellenbosch University) · Cited by 1
Ultrasensitivity of Microtubule severing rate on the concentration of free TubulinPreprint
Shiff, C. E., Kondev, J., & Mohapatra, L. (2022) · bioRxiv (Cold Spring Harbor Laboratory) · doi:10.1101/2022.04.26.488783 · Cited by 1
Momin, M. S. A., Cohen, M., & Mohapatra, L. (2025) · bioRxiv (Cold Spring Harbor Laboratory) · doi:10.1101/2025.05.24.655867 · Cited by 1
Centriolar and ciliary responses to DNA damage
Conroy, P. C. (2012) · Arrow@dit (Dublin Institute of Technology) · doi:10.13025/16788
Regulation of tubulin heterodimer partitioning during interphase and mitosis
Holmfeldt, P. (2008) · DiVA at Umeå University (Umeå University)
Microtubule Bending and Breaking in Cellular Mechanotransduction
Bicek, A. D., Davidow, D. S., & Odde, D. J. (2009) · Cambridge University Press eBooks · doi:10.1017/cbo9781139195874.011
Srivatsa, S. (2015) · eDiss (Georg-August-Universität Göttingen) · doi:10.53846/goediss-4855
Studies on Axonal Transport in an Animal Model for Gulf War Syndrome
Baas, P. W. (2008) · doi:10.21236/ada486927
Self-citationThe Impact of Inclusion Formation on Cell Survival
Mouradian, M. M., Tanaka, M., Lee, G., & Junn, E. (2007) · Springer eBooks · doi:10.1007/0-387-28500-8_4
Viscoelastic behavior, deformation, and rupture of cells
Tan, S. C. W. (2011) · doi:10.32657/10356/44627
Dammermann, A., Desai, A. B., & Oegema, K. (2003)
Sharma, R. (2017) · Jaypee Brothers Medical Publishers (P) Ltd. eBooks · doi:10.5005/jp/books/12994_20
Shou, H., Gao, L., Jin, Z., Liu, J.-W., Jiang, S., Shen, Y., & Cheng, W. (2020) · doi:10.21203/rs.2.24806/v1
Lombino, F. L., Schwarz, J. R., Pechmann, Y., Schweizer, M., Glatzel, M., Gee, C. E., Gromova, K. V., & Kneussel, M. (2022) · bioRxiv (Cold Spring Harbor Laboratory) · doi:10.1101/2022.05.04.490623
Faculty Opinions recommendation of Microtubule release from the centrosome in migrating cells.
Carlier, M. (2002) · Faculty Opinions – Post-Publication Peer Review of the Biomedical Literature · doi:10.3410/f.1010973.174358
Using Drosophila Larval Neuromuscular Junction and Muscle Cells to Visualize Microtubule Network
Zhang, S., Wang, X., Liu, Z., Jin, S., & Mao, C. (2023) · Journal of Visualized Experiments · doi:10.3791/65774
Yuen, W. S., Zhang, Q.-H., Dunstan, M., Adhikari, D., O’Connor, A. E., Dunleavy, J. E. M., O’Bryan, M. K., & Carroll, J. (2023) · bioRxiv (Cold Spring Harbor Laboratory) · doi:10.1101/2023.10.22.563510
Sasmita, A. O. (2024) · eDiss (Georg-August-Universität Göttingen) · doi:10.53846/goediss-10403
Mechanisms of cortical microtubule organization in epidermal keratinocytesPreprint
Guo, K., & Merdes, A. (2024) · bioRxiv (Cold Spring Harbor Laboratory) · doi:10.1101/2024.10.08.617151
Axon-specific microtubule regulation drives asymmetric regeneration of sensory neuron axonsPreprint
Costa, A. C., Murillo, B. R., Bessa, R., Ribeiro, R., da Silva, T. F., Porfírio-Rodrigues, P., Martins, G. G., Brites, P., Kneussel, M., Misgeld, T., et al. (2024) · eLife · doi:10.7554/elife.104069.1
Axon-specific microtubule regulation drives asymmetric regeneration of sensory neuron axonsPreprint
Costa, A. C., Murillo, B. R., Bessa, R., Ribeiro, R., da Silva, T. F., Porfírio-Rodrigues, P., Martins, G. G., Brites, P., Kneussel, M., Misgeld, T., et al. (2025) · eLife · doi:10.7554/elife.104069.2
Flamingo/Starry Night in embryonic abdominal sensory axon development of Drosophila
Steinel, M. C. (2008) · Minerva Access (University of Melbourne)
Wang, L., Tantai, J., & Zhu, X. (2020) · Figshare · doi:10.6084/m9.figshare.12618023
Wang, L., 澹台冀澂, & Zhu, X. (2020) · Figshare · doi:10.6084/m9.figshare.12618026
Wang, L., 澹台冀澂, & Zhu, X. (2020) · Figshare · doi:10.6084/m9.figshare.12618032
Regulation of microtubule abundance and minus end dynamics by Katanin, CAMSAPs, WDR47 and kinesin-13Preprint
Rai, D., Radul, E., Hua, S., Spoelstra, M. F. M., Katrukha, E. A., Stecker, K. E., Jiang, K., & Akhmanova, A. S. (2026) · bioRxiv (Cold Spring Harbor Laboratory) · doi:10.64898/2026.03.26.714132
Stochastic modeling of intracellular processes : bidirectional transport and microtubule dynamics
Ebbinghaus, M. (2011) · theses.fr (ABES) · doi:10.70675/3c6f399az9f54z4135z95f3z1bfa414517d2
Etude de l'implication des microtubules dans le trafic intracellulaire
Fourrière, L. (2016) · theses.fr (ABES) · doi:10.70675/1d94d1cdze6b7z41ccz80baz3c7fa8e55e69
Exploring microtubule-based motor circuit wiring via the analysis of the Fidgetin-like 1 interactome
Atkins, M. (2018) · theses.fr (ABES) · doi:10.70675/ae26c87bz0c4cz4390z9089z3583a8bf6913
Distinct disassembly modes shape cytoskeletal assembly and fluctuations
Momin, M. S. A., Cohen, M. R., & Mohapatra, L. (2026) · Biophysical Reports · doi:10.1016/j.bpr.2026.100263
SPG4 Hereditary Spastic Paraplegia: From Etiology to Therapy
Piermarini, E., & Baas, P. W. (2026) · Movement Disorders · doi:10.1002/mds.70453
Self-citationDistinct tubulin C-terminal tails control the efficiency of a microtubule severing machine
Dewage, M. R., Kahawatte, S., Ross, J. L., & Dima, R. I. (2026) · The Journal of Chemical Physics · doi:10.1063/5.0345522
Cell Cycle Studies on the Human Nek3, Nek5 and Nek11 Protein Kinases
Sahota, N. (2011) · Figshare
Metadata
- Authors
- Ahmad, F. J., Yu, W., McNally, F. J., & Baas, P. W.
- Affiliations
- University of Wisconsin–Madison (US)
- Corresponding author
- Yu, Wenqian
- Venue
- The Journal of Cell Biology
- Publisher
- Rockefeller University Press
- Published
- 1999-04-19
- Volume
- 145
- Issue
- 2
- Pages
- 305-315
- ISSN
- 0021-9525 (ISSN-L)
- 1540-8140
- PMC
- PMC2133110
- OpenAlex
- W2066803550
- Cited by
- 253
- References
- 21
- Citations by year
- 2026: 5 · 2025: 7 · 2024: 8 · 2023: 8 · 2022: 9 · 2021: 6 · 2020: 13 · 2019: 13 · 2018: 8 · 2017: 8 · 2016: 12 · 2015: 8 · 2014: 10 · 2013: 6 · 2012: 14
- FWCI
- 4.01
- Type
- journal article
- Language
- en
- Open access
- green
- www.ncbi.nlm.nih.gov
- Licence
- cc-by-nc-sa
- Locations
- The Journal of Cell Biology (publishedVersion)
- Europe PMC (PubMed Central) (publishedVersion, cc-by-nc-sa)
- PubMed Central (publishedVersion, cc-by-nc-sa)
- PubMed (publishedVersion)
- Topics
- Life Sciences › Biochemistry, Genetics and Molecular Biology › Cell Biology › Microtubule and mitosis dynamics
- Life Sciences › Neuroscience › Developmental Neuroscience › Neurogenesis and neuroplasticity mechanisms
- Health Sciences › Medicine › Oncology › Cancer Treatment and Pharmacology
- Keywords
- katanin, microtubule severing, axon growth, microtubule length regulation, microtubule transport, sympathetic neurons, microtubule ends
- MeSH terms
- Katanin, Adenosine Triphosphatases, Animals, Animals, Newborn, Axons, Cells, Cultured, Ganglia, Sympathetic, Microscopy, Electron, Microtubules, Neurons, Trimethoprim, Sulfamethoxazole Drug Combination, Microscopy, Immunoelectron, Centrosome, Rats
About these checks
Registry, retraction, Cites and statistics results are computed, not judged, with one exception: a printed reference that no index lists is read once by a model before it counts as a citation error. Claims are extracted by a model and kept only when their quote appears verbatim in the text; each cited source is then checked, with a model’s help, for whether it says what the claim relies on. Those verdicts can be wrong — read the claim’s quote and the cited source before relying on one.
Statistics and arithmetic are recomputed, not judged.
Confidence bands are shown only for fields calibrated on our annotated test set. None is calibrated yet, so no band is shown.
What counts as a claim ›How we measure confidence ›How we check this ›
Are you an author, or do you see a problem with this page? Request a review
