

The DOI matches its Crossref record; 43 of the 44 references it cites were found in a registry or an index.
Myostatin negatively regulates satellite cell activation and self-renewal
Open accessAbstract
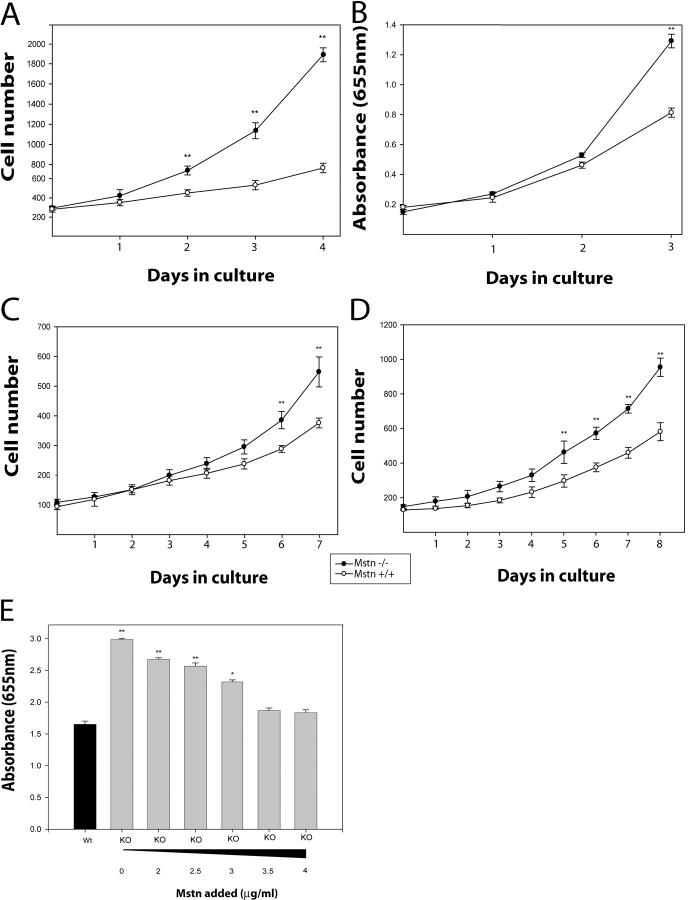
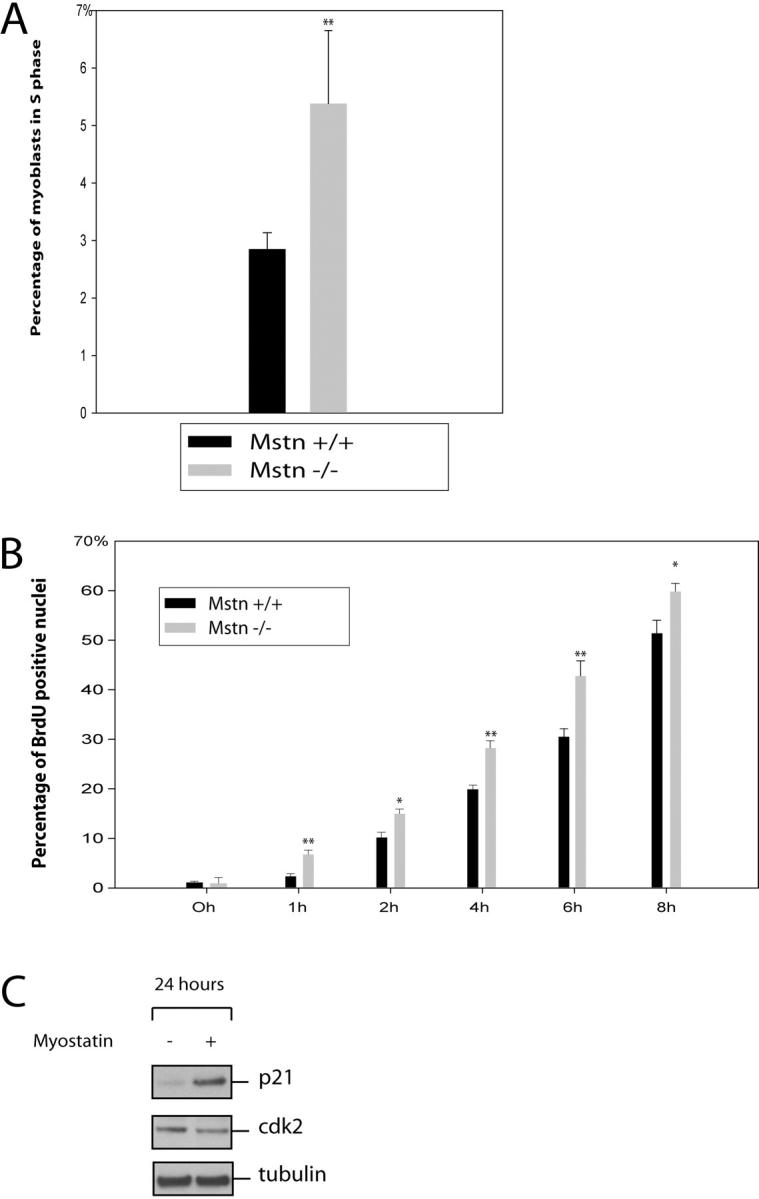
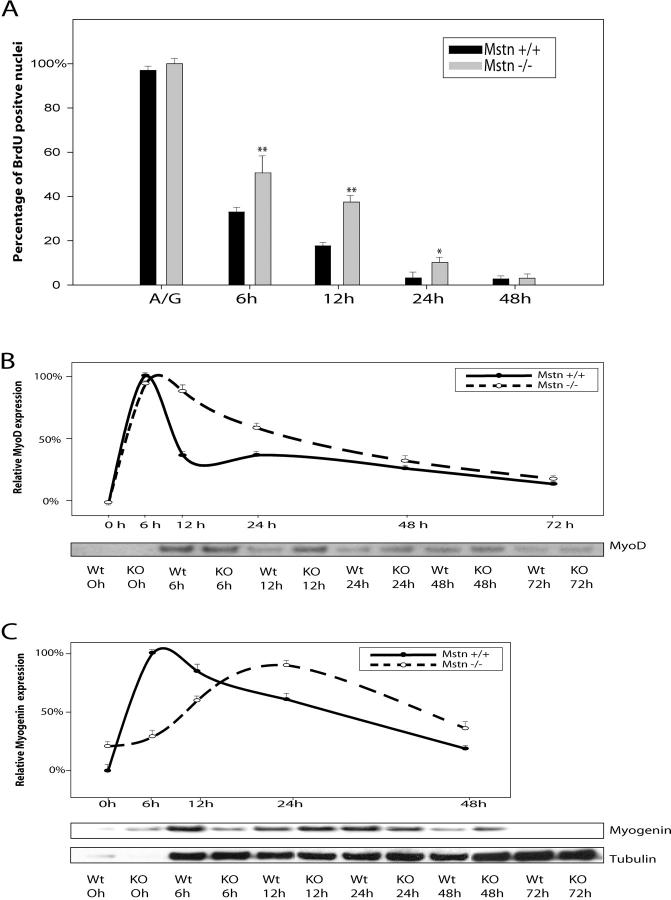
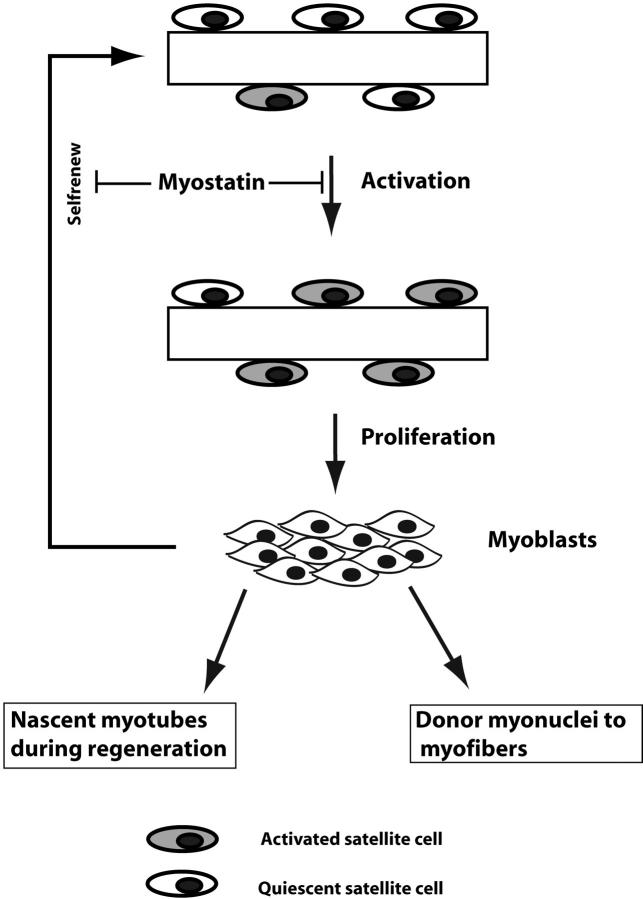
Satellite cells are quiescent muscle stem cells that promote postnatal muscle growth and repair. Here we show that myostatin, a TGF-β member, signals satellite cell quiescence and also negatively regulates satellite cell self-renewal. BrdU labeling in vivo revealed that, among the Myostatin-deficient satellite cells, higher numbers of satellite cells are activated as compared with wild type. In contrast, addition of Myostatin to myofiber explant cultures inhibits satellite cell activation. Cell cycle analysis confirms that Myostatin up-regulated p21, a Cdk inhibitor, and decreased the levels and activity of Cdk2 protein in satellite cells. Hence, Myostatin negatively regulates the G1 to S progression and thus maintains the quiescent status of satellite cells. Immunohistochemical analysis with CD34 antibodies indicates that there is an increased number of satellite cells per unit length of freshly isolated Mstn−/− muscle fibers. Determination of proliferation rate suggests that this elevation in satellite cell number could be due to increased self-renewal and delayed expression of the differentiation gene (myogenin) in Mstn−/− adult myoblasts. Taken together, these results suggest that Myostatin is a potent negative regulator of satellite cell activation and thus signals the quiescence of satellite cells.
Overview
The claims and statistics of this paper haven’t been checked yet.
Run the check — free, no account needed. It reads the open-access text and checks the sources it cites.
Integrity signals
Registry
Cites
Statistics
Figures
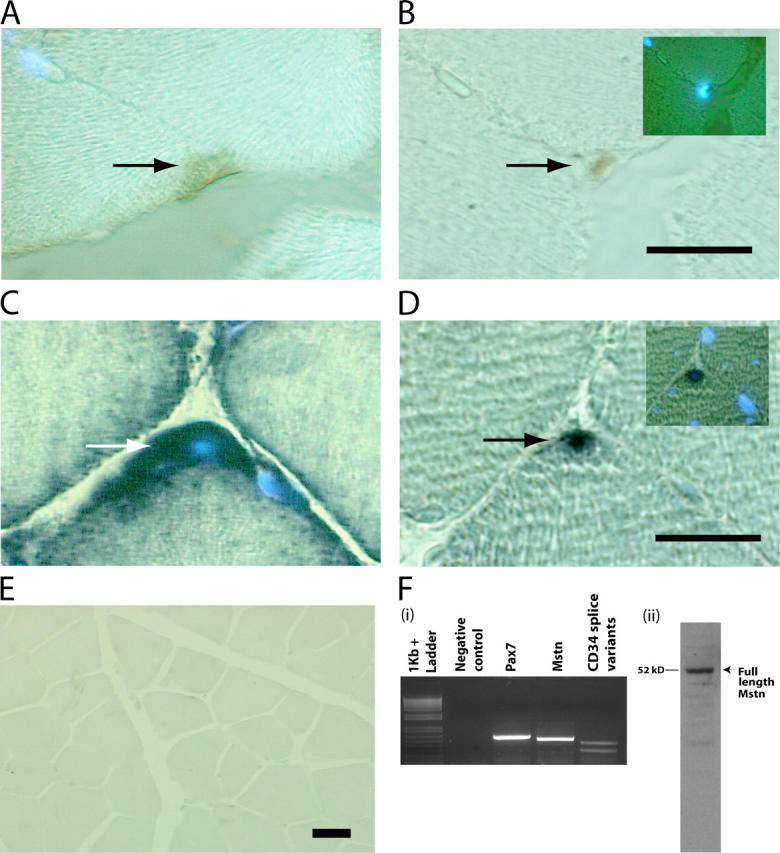
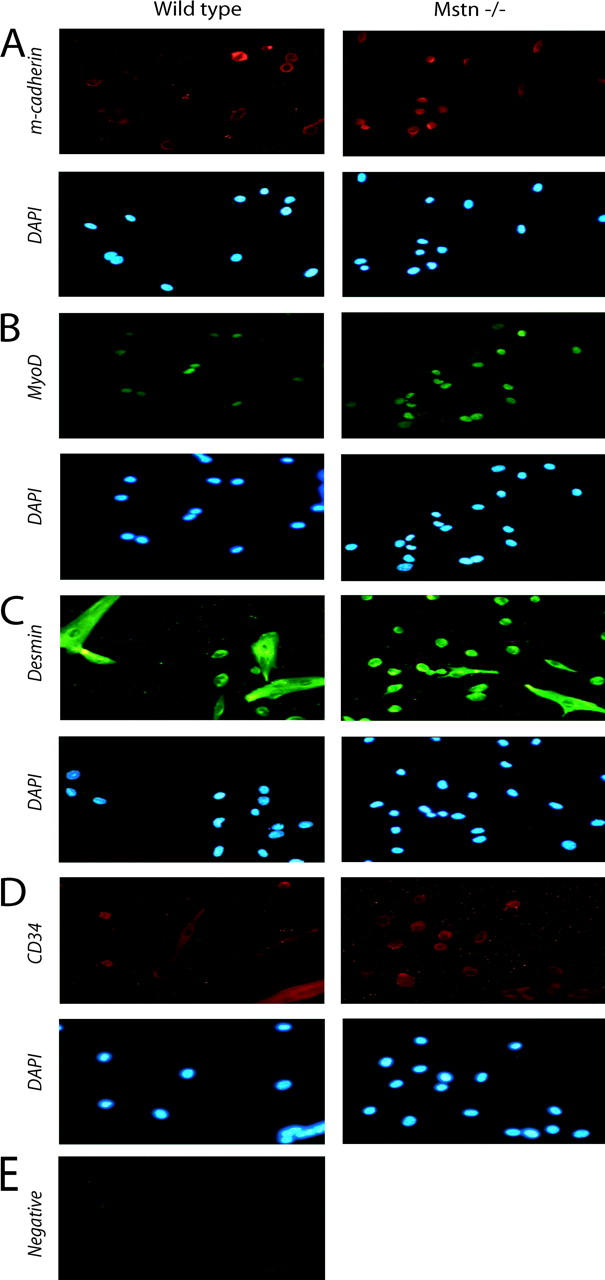
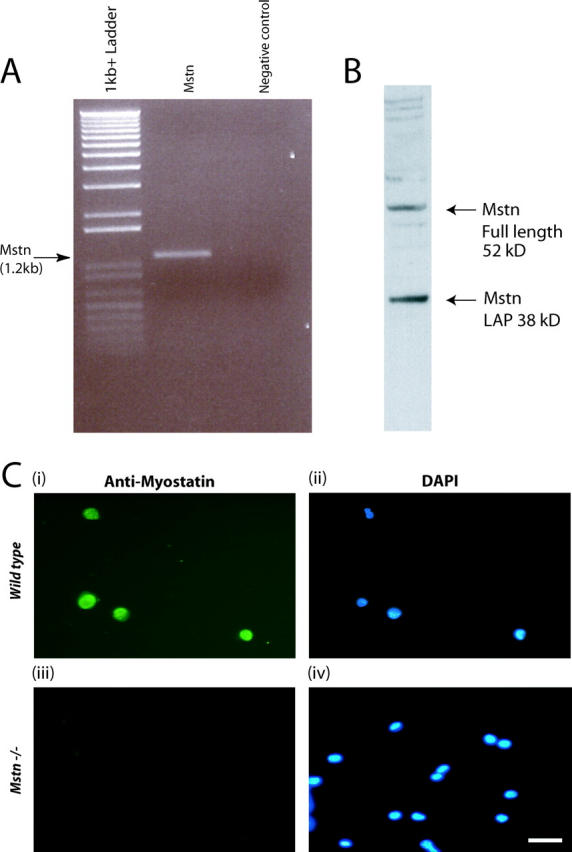
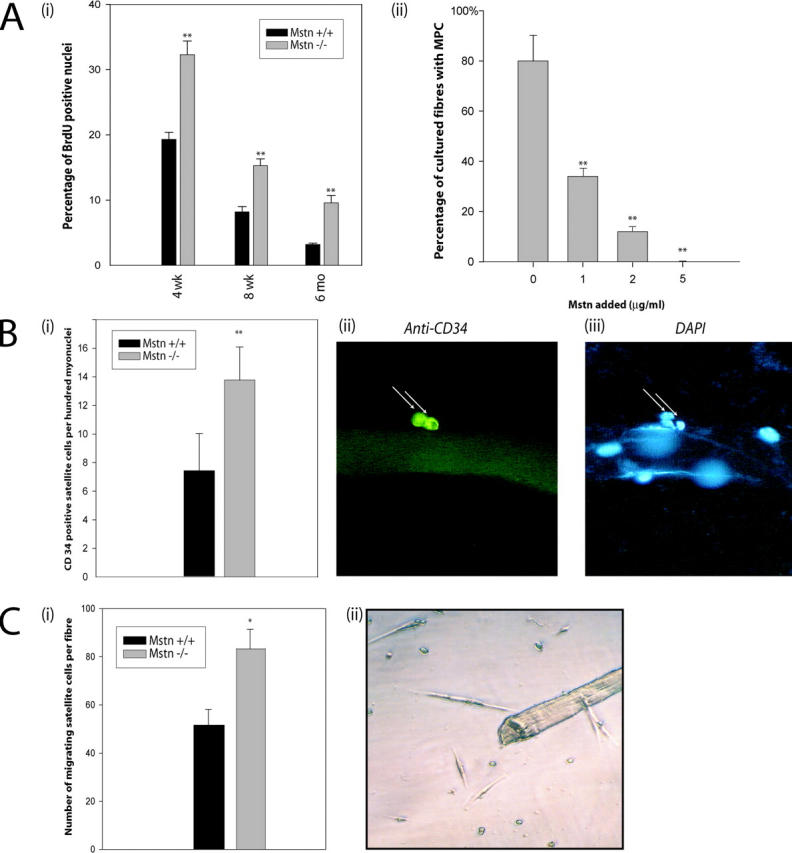
Verification
Claims the paper makes
The claims and statistics of this paper haven’t been checked yet.
Run the check — free, no account needed. It reads the open-access text and checks the sources it cites.
Claims other papers make about this one
Each is checked against this paper’s own text: does it say what the citing paper says it does?
In the citing paper
“The induction of p21 could negatively regulate the G1 to S progression of satellite cells19.”
From In vivo partial reprogramming of myofibers promotes muscle regeneration by remodeling the stem cell niche (2021) · cites this paper as [19]
Self-check
Percentages, sums and reported differences re-computed from the paper’s own numbers.
The self-check needs the paper’s full text.
Citations
Cites
Regulation of skeletal muscle mass in mice by a new TGF-p superfamily member
McPherron, A. C., Lawler, A. M., & Lee, S.-J. (1997) · Nature · doi:10.1038/387083a0 · Cited by 4,013
Isolation and functional properties of murine hematopoietic stem cells that are replicating in vivo.
Goodell, M. A., Brose, K., Paradis, G. A., Conner, A. N., & Mulligan, R. C. (1996) · The Journal of Experimental Medicine · doi:10.1084/jem.183.4.1797 · Cited by 2,902
Pax7 Is Required for the Specification of Myogenic Satellite Cells
Seale, P., Sabourin, L. A., Girgis-Gabardo, A., Mansouri, A., Gruß, P., & Rudnicki, M. A. (2000) · Cell · doi:10.1016/s0092-8674(00)00066-0 · Cited by 2,345
Double muscling in cattle due to mutations in the myostatin gene
McPherron, A. C., & Lee, S.-J. (1997) · Proceedings of the National Academy of Sciences · doi:10.1073/pnas.94.23.12457 · Cited by 2,039
Mutations in myostatin ( GDF8 ) in Double-Muscled Belgian Blue and Piedmontese Cattle
Kambadur, R., Sharma, M., Smith, T. P. L., & Bass, J. J. (1997) · Genome Research · doi:10.1101/gr.7.9.910 · Cited by 1,204
Self-citationMyostatin, a Negative Regulator of Muscle Growth, Functions by Inhibiting Myoblast Proliferation
Thomas, M., Langley, B., Berry, C., Sharma, M., Kirk, S., Bass, J., & Kambadur, R. (2000) · Journal of Biological Chemistry · doi:10.1074/jbc.m004356200 · Cited by 1,014
Self-citationCornelison, D., & Wold, B. J. (1997) · Developmental Biology · doi:10.1006/dbio.1997.8721 · Cited by 934
Expression of Cd34 and Myf5 Defines the Majority of Quiescent Adult Skeletal Muscle Satellite Cells
Beauchamp, J. R., Heslop, L., Yu, D. S., Tajbakhsh, S., Kelly, R. G., Wernig, A., BUCKINGHAM, M. E., Partridge, T. A., & Zammit, P. S. (2000) · The Journal of Cell Biology · doi:10.1083/jcb.151.6.1221 · Cited by 917
Myostatin Inhibits Myoblast Differentiation by Down-regulating MyoD Expression
Langley, B. C., Thomas, M., Bishop, A., Sharma, M., Gilmour, S., & Kambadur, R. (2002) · Journal of Biological Chemistry · doi:10.1074/jbc.m204291200 · Cited by 910
Self-citationFunctional improvement of dystrophic muscle by myostatin blockade
Bogdanovich, S., Krag, T. O. B., Barton, E. R., Morris, L. D., Whittemore, L.-A., Ahima, R. S., & Khurana, T. S. (2002) · Nature · doi:10.1038/nature01154 · Cited by 831
Research works printed but not linked: 4
- 1989, Med. Sci. Sports Exerc., 21, S164
- 1999, Am. J. Physiol., 277, R601
- 1993, Mol. Cell Biol. Hum. Dis. Ser., 3, 210
- 1997, Methods Mol. Biol., 75, 131
Cited by
Sorted by citations
Items 401–500 of 781
Cancer-Associated Cachexia: Bridging Clinical Findings with Mechanistic Insights in Human Studies
Koh, K., Scott, R., Feliciano, E. M. C., Janowitz, T., Goncalves, M. D., White, E., Laird, B. J. A., Haase, K., & Jamal‐Hanjani, M. (2025) · Cancer Discovery · doi:10.1158/2159-8290.cd-25-0293 · Cited by 27
Skeletal muscle and metabolic flexibility in response to changing energy demands in wild birds
Swanson, D. L., Zhang, Y., & Jiménez, A. G. (2022) · Frontiers in Physiology · doi:10.3389/fphys.2022.961392 · Cited by 28
Swanson, D. L., King, M. O., & Harmon, E. B. (2014) · Journal of Comparative Physiology B · doi:10.1007/s00360-013-0798-4 · Cited by 24
Mosler, S., Relizani, K., Mouisel, É., Amthor, H., & Diel, P. R. (2014) · Physiological Reports · doi:10.1002/phy2.262 · Cited by 24
Geng, J., Peng, F., Xiong, F., Shang, Y., Zhao, C., Li, W., & Zhang, C. (2009) · Cytotherapy · doi:10.3109/14653240903131632 · Cited by 24
Myostatin inhibits proliferation and insulin-stimulated glucose uptake in mouse liver cells
Watts, R., Ghozlan, M., Hughey, C. C., Johnsen, V. L., Shearer, J., & Hittel, D. S. (2014) · Biochemistry and Cell Biology · doi:10.1139/bcb-2014-0004 · Cited by 24
Dalbo, V. J., Roberts, M. D., Mobley, C. B., Ballmann, C. G., Kephart, W. C., Fox, C. D., Santucci, V. A., Conover, C. F., Beggs, L. A., Balaez, A., et al. (2016) · Andrologia · doi:10.1111/and.12622 · Cited by 24
Myokines in Appetite Control and Energy Balance
Grannell, A., Kokkinos, A. D., & le Roux, C. W. (2022) · Muscles · doi:10.3390/muscles1010003 · Cited by 24
Cellular targets of estrogen signaling in regeneration of inner ear sensory epithelia
McCullar, J. S., & Oesterle, E. C. (2009) · Hearing Research · doi:10.1016/j.heares.2009.01.012 · Cited by 25
Linc-RAM is required for FGF2 function in regulating myogenic cell differentiation
Zhao, Y., Cao, F., Yu, X., Chen, C., Meng, J., Zhong, R., Zhang, Y., & Zhu, D. (2018) · RNA Biology · doi:10.1080/15476286.2018.1431494 · Cited by 25
Alami-Durante, H., Cluzeaud, M., Bazin, D., Schrama, J. W., Saravanan, S., & Geurden, I. (2019) · Comparative Biochemistry and Physiology Part A Molecular & Integrative Physiology · doi:10.1016/j.cbpa.2019.01.009 · Cited by 23
Novel treatments for cancer cachexia
Bossola, M., Pacelli, F., & Doglietto, G. B. (2007) · Expert Opinion on Investigational Drugs · doi:10.1517/13543784.16.8.1241 · Cited by 23
Skeletal muscle development in normal and double‐muscled cattle
Martyn, J. K., Bass, J. J., & Oldham, J. M. (2004) · The Anatomical Record Part A Discoveries in Molecular Cellular and Evolutionary Biology · doi:10.1002/ar.a.20140 · Cited by 23
Signaling Pathways that Mediate Skeletal Muscle Hypertrophy: Effects of Exercise Training
Fernandes, T. M., rsula, P. R., Stphano, F. S., Clber, R., & Edilamar, M. (2012) · InTech eBooks · doi:10.5772/51087 · Cited by 22
Identification and Characterization of a Non-muscular Myostatin in the Nile Tilapia
Segev-Hadar, A., Alupo, G., Tal, K., Nitzan, T., & Biran, J. (2020) · Frontiers in Endocrinology · doi:10.3389/fendo.2020.00094 · Cited by 22
Ibrahim, D., Al-Khalaifah, H. S., Abdelfattah‐Hassan, A., Eldoumani, H., Khater, S. I., Arisha, A. H., Mohamed, S. A. M., Ismail, T. A., & Tolba, S. A. (2021) · Animals · doi:10.3390/ani11071906 · Cited by 22
Poulin-Brière, A., Rezaei, E., & Pozzi, S. (2021) · Frontiers in Neuroscience · doi:10.3389/fnins.2021.790114 · Cited by 21
Myostatin is a negative regulator of adult neurogenesis after spinal cord injury in zebrafish
Saraswathy, V. M., Zhou, L., McAdow, A. R., Burris, B., Dogra, D., Reischauer, S., & Mokalled, M. H. (2022) · Cell Reports · doi:10.1016/j.celrep.2022.111705 · Cited by 23
Differential effects of right and left heart failure on skeletal muscle in rats
Knapp, F., Niemann, B., Li, L., Molenda, N., Kracht, M., Schulz, R., & Rohrbach, S. (2020) · Journal of Cachexia Sarcopenia and Muscle · doi:10.1002/jcsm.12612 · Cited by 22
Emerging Treatment Options for Sarcopenia in Chronic Liver Disease
Kim, Y. (2021) · Life · doi:10.3390/life11030250 · Cited by 26
Khaerunnisa, I., Pramujo, M., Arief, I. I., Budiman, C., Gunawan, A., Jakaria, J., & Sumantri, C. (2016) · International Journal of Poultry Science · doi:10.3923/ijps.2016.316.324 · Cited by 21
Vargas-Mendoza, N., Madrigal‐Santillán, E., Álvarez‐González, I., Madrigal‐Bujaidar, E., Anguiano‐Robledo, L., Aguilar-Faisal, L., Morales-Martínez, M., Delgado‐Olivares, L., Rodríguez-Negrete, E. V., Morales‐González, Á., et al. (2022) · Plants · doi:10.3390/plants11192517 · Cited by 23
Spatiotemporal expression of decorin and myostatin during rat skeletal muscle development
Nishimura, T., Oyama, K., Kishioka, Y., Wakamatsu, J., & Hattori, A. (2007) · Biochemical and Biophysical Research Communications · doi:10.1016/j.bbrc.2007.07.104 · Cited by 21
Satellite cell function, intramuscular inflammation and exercise in chronic kidney disease
O’Sullivan, T. F., Smith, A. C., & Watson, E. L. (2018) · Clinical Kidney Journal · doi:10.1093/ckj/sfy052 · Cited by 22
Relative Contributions of Myostatin and the GH/IGF-1 Axis in Body Composition and Muscle Strength
Lozier, N. R., Kopchick, J. J., & Lacalle, S. D. (2018) · Frontiers in Physiology · doi:10.3389/fphys.2018.01418 · Cited by 20
Impaired muscle stem cell function and abnormal myogenesis in acquired myopathies
Deprez, A., Orfi, Z., Rieger, L., & Dumont, N. A. (2022) · Bioscience Reports · doi:10.1042/bsr20220284 · Cited by 23
Shono, J., Sakaguchi, S., Suzuki, T., Do, M. Q., Mizunoya, W., Nakamura, M., Sato, Y., Furuse, M., Yamada, K., Ikeuchi, Y., et al. (2013) · Animal Science Journal · doi:10.1111/asj.12105 · Cited by 20
Xie, Y., Perry, B. D., Espinoza, D., Zhang, P., & Price, S. R. (2018) · Biochemical and Biophysical Research Communications · doi:10.1016/j.bbrc.2018.07.056 · Cited by 20
Al‐Sajee, D., Nissar, A. A., Coleman, S. K., Rebalka, I. A., Chiang, A., Wathra, R., van der Ven, P. F. M., Orfanos, Z., & Hawke, T. J. (2015) · Acta Physiologica · doi:10.1111/apha.12455 · Cited by 20
Southard, S. M., Kim, J.-R., Low, S., Tsika, R. W., & Lepper, C. (2016) · eLife · doi:10.7554/elife.15461 · Cited by 20
Musculoskeletal complications of Cushing syndrome
Leszczyńska, D., Szatko, A., Papierska, L., Zgliczyński, W., & Glinicki, P. (2023) · Reumatologia/Rheumatology · doi:10.5114/reum/169889 · Cited by 57
Impact of cancer cachexia on respiratory muscle function and the therapeutic potential of exercise
Murphy, B. T., Mackrill, J. J., & O’Halloran, K. D. (2022) · The Journal of Physiology · doi:10.1113/jp283569 · Cited by 20
Salzler, R. R., Shah, D., Dore, A. T., Bauerlein, R., Miloscio, L., Latres, E., Papadopoulos, N. J., Olson, W. C., MacDonald, D., & Duan, X. (2016) · PROTEOMICS · doi:10.1002/pmic.201600006 · Cited by 19
Mitrofanova, O. V., Дементьева, Н. В., Krutikova, A. A., Yurchenko, O. P., Вахрамеев, А. Б., & Terletskiy, V. P. (2017) · Cytology and Genetics · doi:10.3103/s0095452717030082 · Cited by 19
Muscle wasting in the presence of disease, why is it so variable?
Kemp, P. R., Griffiths, M., & Polkey, M. I. (2018) · Biological reviews/Biological reviews of the Cambridge Philosophical Society · doi:10.1111/brv.12489 · Cited by 21
Roles of important candidate genes on broiler meat quality
SAXENA, V. K., SACHDEV, A. K., Gopal, R., & PRAMOD, A. B. (2009) · World s Poultry Science Journal · doi:10.1017/s0043933909000003 · Cited by 19
Satellite cell activation and number following acute and chronic exercise: A mini review
Martin, N. R., & Lewis, M. P. (2012) · Cellular and Molecular Exercise Physiology · doi:10.7457/cmep.v1i1.e3 · Cited by 20
Hair Cell Regeneration: Mechanisms Guiding Cellular Proliferation and Differentiation
Oesterle, E. C., & Stone, J. S. (2008) · Springer eBooks · doi:10.1007/978-0-387-73364-7_5 · Cited by 19
The Role of Genetic Variation in Muscle Strength
Kostek, M. C., Hubal, M. J., & Pescatello, L. S. (2010) · American Journal of Lifestyle Medicine · doi:10.1177/1559827610387251 · Cited by 22
Myostatin negatively regulates the expression of the steroid receptor co‐factor ARA70
Siriett, V., Nicholas, G., Berry, C., Watson, T. J., Hennebry, A., Thomas, M., Ling, N., Sharma, M., & Kambadur, R. (2005) · Journal of Cellular Physiology · doi:10.1002/jcp.20456 · Cited by 19
Self-citationSanvee, G. M., Bouitbir, J., & Krähenbühl, S. (2021) · Biochemical Pharmacology · doi:10.1016/j.bcp.2021.114649 · Cited by 18
Combined Transcriptome and Metabolome Analysis of Smooth Muscle of Myostatin Knockout Cattle
Gu, M., Wang, S., Di, A., Wu, D., Hai, C., Liu, X., Bai, C., Su, G., Yang, L., & Li, G. (2023) · International Journal of Molecular Sciences · doi:10.3390/ijms24098120 · Cited by 18
Muroya, S., Watanabe, K., Hayashi, S., MIYAKE, M., Konashi, S., Sato, Y., Takahashi, M., KAWAHATA, S., YOSHIKAWA, Y., Aso, H., et al. (2009) · Animal Science Journal · doi:10.1111/j.1740-0929.2009.00684.x · Cited by 18
Sente, T., Berendoncks, A. M. V., Jonckheere, A. I., Rodenburg, R. J., Lauwers, P., Hoof, V. O. V., Wouters, A., Lardon, F., Hoymans, V. Y., & Vrints, C. J. (2016) · BMC Cardiovascular Disorders · doi:10.1186/s12872-016-0278-3 · Cited by 18
Myostatin and NF-κB Regulate Skeletal Myogenesis Through Distinct Signaling Pathways
Bakkar, N., Wackerhage, H., & Guttridge, D. C. (2005) · Signal Transduction · doi:10.1002/sita.200400039 · Cited by 18
Improvement of muscular atrophy by AAV–SaCas9-mediated myostatin gene editing in aged mice
Weng, S., Gao, F., Wang, J., Li, X., Chu, B., Yang, G., & Yang, G. (2020) · Cancer Gene Therapy · doi:10.1038/s41417-020-0178-7 · Cited by 17
Knapp, M., Supruniuk, E., & Górski, J. (2023) · Biomolecules · doi:10.3390/biom13121777 · Cited by 17
Ahmad, S. S., Ahmad, K., Lim, J. H., Shaikh, S., Lee, E. J., & Choi, I. (2024) · International Journal of Biological Macromolecules · doi:10.1016/j.ijbiomac.2024.131411 · Cited by 17
Imanaka, M., Iida, K., Murawaki, A., Nishizawa, H., Fukuoka, H., Takeno, R., Takahashi, Y., Okimura, Y., Kaji, H., & Chihara, K. (2008) · PubMed · doi:10.24546/81000142 · Cited by 17
Applications of Myostatin (MSTN) Gene in the Livestock Animals and Humans: A Review
Ahad, W. A., Andrabi, M., Beigh, S. A., Bhat, R. A., & Shah, R. A. (2017) · International Journal of Current Microbiology and Applied Sciences · doi:10.20546/ijcmas.2017.609.222 · Cited by 17
Satellite cell activity in muscle regeneration after contusion in rats
Srikuea, R., Pholpramool, C., Kitiyanant, Y., & Yimlamai, T. (2010) · Clinical and Experimental Pharmacology and Physiology · doi:10.1111/j.1440-1681.2010.05439.x · Cited by 17
Myostatin Regulates Tissue Potency and Cardiac Calcium-Handling Proteins
Jackson, M. F., Li, N., & Rodgers, B. D. (2014) · Endocrinology · doi:10.1210/en.2013-2014 · Cited by 18
Price, S. R., & Wang, X. H. (2025) · Kidney Research and Clinical Practice · doi:10.23876/j.krcp.24.214 · Cited by 18
Unveiling the Promise: Navigating Clinical Trials 1978–2024 for PDAC
Dominguez, A. A., Perz, M., Xu, Y., Cedillo, L. G., Huang, O. L., McIntyre, C. A., Vudatha, V., Trevino, J. G., Liu, J., & Wang, P. (2024) · Cancers · doi:10.3390/cancers16213564 · Cited by 17
Absence of Hyperplasia inGasp-1Overexpressing Mice is Dependent on Myostatin Up-Regulation
Brun, C. E., Pèrié, L., Baraige, F., Vernus, B., Bonnieu, A., & Blanquet, V. (2014) · Cellular Physiology and Biochemistry · doi:10.1159/000366335 · Cited by 19
Activin Potentiates Proliferation in Mature Avian Auditory Sensory Epithelium
McCullar, J. S., Ty, S., Campbell, S., & Oesterle, E. C. (2010) · Journal of Neuroscience · doi:10.1523/jneurosci.5154-09.2010 · Cited by 16
Stern, A., Ashwell, C. M., Dasarathy, S., & Mozdziak, P. E. (2015) · animal · doi:10.1017/s1751731115000117 · Cited by 16
Zhao, M., Gao, T., Zhang, L., Li, J. L., Lv, P. A., Yu, L. L., Gao, F., & Zhou, G. (2017) · Poultry Science · doi:10.3382/ps/pex150 · Cited by 16
Shulgina, N. S., Churova, M. V., Мурзина, С. А., Krupnova, M. Y., & Немова, Н. Н. (2021) · Life · doi:10.3390/life11040328 · Cited by 16
Efficient myoblast expansion for regenerative medicine use
Jarocha, D. J., Stangel‐Wójcikiewicz, K., Basta, A., & Majka, M. (2014) · International Journal of Molecular Medicine · doi:10.3892/ijmm.2014.1763 · Cited by 16
Duddy, W. J., Cohen, T. V., Duguez, S., & Partridge, T. A. (2011) · Experimental Cell Research · doi:10.1016/j.yexcr.2011.05.013 · Cited by 16
Zhao, B., Li, E. J., Wall, R. J., & Yang, J. (2009) · BMC Genomics · doi:10.1186/1471-2164-10-305 · Cited by 16
Jeanplong, F., Falconer, S. J., Thomas, M., Matthews, K. G., Oldham, J. M., Watson, T. J., & McMahon, C. D. (2012) · Open Journal of Molecular and Integrative Physiology · doi:10.4236/ojmip.2012.24018 · Cited by 16
Self-citationHealthy skeletal muscle aging: The role of satellite cells, somatic mutations and exercise
Franco, I., Fernandez‐Gonzalo, R., Vrtačnik, P., Lundberg, T. R., Eriksson, M., & Gustafsson, T. P. (2019) · International review of cytology · doi:10.1016/bs.ircmb.2019.03.003 · Cited by 18
Featured characteristics and pivotal roles of satellite cells in skeletal muscle regeneration
Song, T., & Sadayappan, S. (2019) · Journal of Muscle Research and Cell Motility · doi:10.1007/s10974-019-09553-7 · Cited by 20
Sun, X., Li, L., Liu, Z., Zhao, D., Yang, A., Zhou, L., Wu, B., & Tian, J. (2020) · Aquaculture · doi:10.1016/j.aquaculture.2020.734982 · Cited by 16
Nattrass, G. S., Quigley, S. P., Gardner, G. E., Bawden, C. S., McLaughlan, C. J., Hegarty, R. S., & Greenwood, P. L. (2006) · Australian Journal of Agricultural Research · doi:10.1071/ar05101 · Cited by 16
Myostatin Induces DNA Damage in Skeletal Muscle of Streptozotocin-induced Type 1 Diabetic Mice
Sriram, S., Subramanian, S., Juvvuna, P. K., McFarlane, C., Salerno, M. S., Kambadur, R., & Sharma, M. (2014) · Journal of Biological Chemistry · doi:10.1074/jbc.m113.483115 · Cited by 15
Self-citationRetractedBijeh, N., Ahmadi, M. M., Moghadam, B. H., Eskandari, M., & Golestani, F. (2022) · Biological Research For Nursing · doi:10.1177/10998004211073123 · Cited by 15
Ji, S., Li, H., Huang, X., Sun, J. H., Kaneko, G., & Ji, H. (2023) · Aquaculture · doi:10.1016/j.aquaculture.2023.740148 · Cited by 15
Rosales-Nieto, C. A., Thompson, A. N., & Martin, G. B. (2018) · Animal Production Science · doi:10.1071/an17787 · Cited by 15
Formicola, L., Pannérec, A., Correra, R. M., Gayraud-Morel, B., Ollitrault, D., Besson, V., Tajbakhsh, S., Lachey, J. L., Seehra, J. S., Marazzi, G., et al. (2018) · Frontiers in Physiology · doi:10.3389/fphys.2018.00515 · Cited by 17
Mathematical Model of Muscle Wasting in Cancer Cachexia
Farhang‐Sardroodi, S., & Wilkie, K. P. (2020) · Journal of Clinical Medicine · doi:10.3390/jcm9072029 · Cited by 16
Tripathi, A. K., Ramani, U. V., Rank, D. N., & Joshi, C. G. (2011) · Journal of Muscle Research and Cell Motility · doi:10.1007/s10974-011-9245-x · Cited by 15
Salabi, F., Nazari, M., Chen, Q., Nimal, J., Tong, J., & Cao, G. (2014) · Journal of Biotechnology · doi:10.1016/j.jbiotec.2014.10.038 · Cited by 15
Kocsis, T., Trencsényi, G., Szabó, K., Baán, J. A., Müller, G., Mendler, L., Garai, I., Reinauer, H., Deak, F., László, A., et al. (2016) · American Journal of Physiology-Endocrinology and Metabolism · doi:10.1152/ajpendo.00216.2016 · Cited by 16
Potential Myogenic Stem Cell Populations: Sources, Plasticity, and Application for Cardiac Repair
Schabort, E. J., Myburgh, K. H., Wiehe, J. M., Torzewski, J., & Niesler, C. U. (2009) · Stem Cells and Development · doi:10.1089/scd.2008.0387 · Cited by 15
The Ins and Outs of Satellite Cell Myogenesis: The Role of the Ruling Growth Factors
Shefer, G., & Yablonka‐Reuveni, Z. (2008) · Springer eBooks · doi:10.1007/978-1-4020-6768-6_6 · Cited by 15
Kim, B., Min, Y., Jeong, Y. D., Ramani, S., Lim, H., Jo, Y., Kim, W., Choi, Y. H., & Park, S. (2022) · Journal of Animal Science and Technology · doi:10.5187/jast.2022.e93 · Cited by 14
The effect of myostatin silencing by lentiviral-mediated RNA interference on goat fetal fibroblasts
Lü, J., Wei, C., Zhang, X., Xu, L., Zhang, S., Liu, J., Cao, J., Zhao, F., Zhang, L., Li, B., et al. (2013) · Molecular Biology Reports · doi:10.1007/s11033-013-2494-6 · Cited by 14
Jayawardena, T. U., Kim, S., & Jeon, Y. (2021) · Critical Reviews in Food Science and Nutrition · doi:10.1080/10408398.2021.1969889 · Cited by 15
Efficient and Specific Generation of MSTN-Edited Hu Sheep Using C-CRISPR
Guo, R., Wang, H., Meng, C., Gui, H., Li, Y., Chen, F., Zhang, C., Zhang, H., Ding, Q., Zhang, J., et al. (2023) · Genes · doi:10.3390/genes14061216 · Cited by 16
Myostatin preferentially down-regulates the expression of fast 2x myosin heavy chain in cattle
Hayashi, S., MIYAKE, M., Watanabe, K., Aso, H., HAYASHI, S., Ohwada, S., & Yamaguchi, T. (2008) · Proceedings of the Japan Academy Series B · doi:10.2183/pjab.84.354 · Cited by 14
Myostatin: genetic variants, therapy and gene doping
Yamada, A. K., Verlengia, R., & Júnior, C. R. B. (2012) · Brazilian Journal of Pharmaceutical Sciences · doi:10.1590/s1984-82502012000300003 · Cited by 13
Increased Myostatin Synthesis in Rat Gastrocnemius Muscles under High-Protein Diet
Nakazato, K., Hirose, T., & Song, H. (2006) · International Journal of Sport Nutrition and Exercise Metabolism · doi:10.1123/ijsnem.16.2.153 · Cited by 14
Yamaguchi, A., Fujikawa, T., Tateoka, M., Soya, H., Sakuma, K., Sugiura, T., Morita, I., Ikeda, Y., & Hirai, T. (2006) · Acta Physiologica · doi:10.1111/j.1748-1716.2006.01569.x · Cited by 14
Park, J.-W., Lee, J. H., Han, J. S., Shin, S. P., & Park, T. S. (2020) · Molecular Biology Reports · doi:10.1007/s11033-020-05935-0 · Cited by 13
Sharma, G., Banerjee, R., & Srivastava, S. (2023) · ACS Omega · doi:10.1021/acsomega.3c07480 · Cited by 13
The myostatin null mutation and clenbuterol administration elicit additive effects in mice
Dilger, A. C., Gabriel, S. R., Kutzler, L. W., MCKEITH, F. K., & Killefer, J. (2009) · animal · doi:10.1017/s1751731109991297 · Cited by 14
Contributions of Muscle-Resident Progenitor Cells to Homeostasis and Disease
Dey, D., Goldhamer, D. J., & Yu, P. B. (2015) · Current Molecular Biology Reports · doi:10.1007/s40610-015-0025-z · Cited by 13
Xi, G., Hathaway, M. R., Dayton, W. R., & White, M. E. (2006) · Journal of Animal Science · doi:10.2527/jas.2006-351 · Cited by 13
HEMA 3 Staining: A Simple Alternative for the Assessment of Myoblast Differentiation
Levitt, D. E., Adler, K. A., & Simon, L. (2019) · Current Protocols in Stem Cell Biology · doi:10.1002/cpsc.101 · Cited by 13
Velleman, S. G., & McFarland, D. C. (2014) · Elsevier eBooks · doi:10.1016/b978-0-12-407160-5.00016-6 · Cited by 13
Growth Factors, Muscle Function, and Doping
Goldspink, G., Wessner, B., Tschan, H., & Bachl, N. (2010) · Endocrinology and Metabolism Clinics of North America · doi:10.1016/j.ecl.2009.11.001 · Cited by 13
Buford, T. W., Cooke, M. B., Shelmadine, B., Hudson, G. M., Redd, L., & Willoughby, D. S. (2011) · Aging Clinical and Experimental Research · doi:10.1007/bf03324957 · Cited by 13
Østbye, T.-K. K., Bardal, T., Vegusdal, A., Wetten, O. F., Kjørsvik, E., & Andersen, Ø. (2007) · Comparative Biochemistry and Physiology Part D Genomics and Proteomics · doi:10.1016/j.cbd.2006.12.003 · Cited by 13
Li, R., Ferreira, M. P., Cooke, M. B., Bounty, P. L., Campbell, B. I., Greenwood, M., Willoughby, D. S., & Kreider, R. B. (2015) · Amino Acids · doi:10.1007/s00726-015-1947-8 · Cited by 13
Endurance exercise remodels skeletal muscle by suppressing Ythdf1-mediated myostatin expression
Huang, X., Xu, C., Zhang, J., Wu, W., Wang, Z., Pang, Q., Liu, Z., & Liu, B. (2025) · Cell Death and Disease · doi:10.1038/s41419-025-07379-5 · Cited by 14
Molecular analysis of muscle progenitor cells on extracellular matrix coatings and hydrogels
Palade, J., Pal, A., Rawls, A., Stabenfeldt, S. E., & Wilson‐Rawls, J. (2019) · Acta Biomaterialia · doi:10.1016/j.actbio.2019.08.019 · Cited by 12
Pan, B., Long, H., Yuan, Y., Zhang, H., Peng, Y., Zhou, D., Liu, C., Xiang, B., Huang, Y., Zhao, Y., et al. (2022) · Animals · doi:10.3390/ani12141839 · Cited by 12
Metadata
- Authors
- McCroskery, S., Thomas, M., Maxwell, L., Sharma, M., & Kambadur, R.
- Affiliations
- University of Auckland (NZ)
- AgResearch (NZ)
- Corresponding author
- Kambadur, Ravi
- ORCID
- Thomas, Mark
- Venue
- The Journal of Cell Biology
- Publisher
- Rockefeller University Press
- Published
- 2003-09-08
- Volume
- 162
- Issue
- 6
- Pages
- 1135-1147
- ISSN
- 0021-9525 (ISSN-L)
- 1540-8140
- PMC
- PMC2172861
- OpenAlex
- W2048134135
- Cited by
- 784
- References
- 44
- Citations by year
- 2026: 20 · 2025: 20 · 2024: 22 · 2023: 17 · 2022: 25 · 2021: 32 · 2020: 26 · 2019: 25 · 2018: 33 · 2017: 28 · 2016: 42 · 2015: 38 · 2014: 54 · 2013: 54 · 2012: 48
- FWCI
- 11.05
- Type
- journal article
- Language
- en
- Open access
- green
- www.ncbi.nlm.nih.gov
- Licence
- cc-by-nc-sa
- Locations
- The Journal of Cell Biology (publishedVersion)
- Europe PMC (PubMed Central) (publishedVersion, cc-by-nc-sa)
- PubMed Central (publishedVersion, cc-by-nc-sa)
- PubMed (publishedVersion)
- Topics
- Life Sciences › Biochemistry, Genetics and Molecular Biology › Molecular Biology › Muscle Physiology and Disorders
- Life Sciences › Biochemistry, Genetics and Molecular Biology › Molecular Biology › TGF-β signaling in diseases
- Health Sciences › Medicine › Genetics (clinical) › Neurogenetic and Muscular Disorders Research
- Keywords
- myostatin, satellite cells, muscle stem cells, quiescence, self-renewal, satellite cell activation, p21, CDK2, G1/S cell cycle progression, myogenesis, myogenin, Mstn knockout mice, TGF-beta signaling
- MeSH terms
- Animals, Cell Differentiation, Cell Division, Regeneration, Down-Regulation, Up-Regulation, G1 Phase, S Phase, Transforming Growth Factor beta, Cyclins, Protein Serine-Threonine Kinases, Myogenin, Mice, Knockout, Muscle, Skeletal, Muscle Fibers, Skeletal, Gene Expression Regulation, Developmental, Cyclin-Dependent Kinases, Antigens, CD34, Feedback, Physiological, Myoblasts, Satellite Cells, Skeletal Muscle, CDC2-CDC28 Kinases, Cyclin-Dependent Kinase Inhibitor p21, Cyclin-Dependent Kinase 2, Mice, Myostatin
About these checks
Registry, retraction, Cites and statistics results are computed, not judged, with one exception: a printed reference that no index lists is read once by a model before it counts as a citation error. Claims are extracted by a model and kept only when their quote appears verbatim in the text; each cited source is then checked, with a model’s help, for whether it says what the claim relies on. Those verdicts can be wrong — read the claim’s quote and the cited source before relying on one.
Statistics and arithmetic are recomputed, not judged.
Confidence bands are shown only for fields calibrated on our annotated test set. None is calibrated yet, so no band is shown.
What counts as a claim ›How we measure confidence ›How we check this ›
Are you an author, or do you see a problem with this page? Request a review
