CoChat

Optic nerve astrocyte reactivity protects function in experimental glaucoma and other nerve injuries

Open access
Sun, Daniel, Moore, Sara, Jakobs, Tatjana C. · 2017 · Journal of Experimental Medicine

The DOI matches its Crossref record; the references it cites are not checked yet.

Abstract

Reactive remodeling of optic nerve head astrocytes is consistently observed in glaucoma and other optic nerve injuries. However, it is unknown whether this reactivity is beneficial or harmful for visual function. In this study, we used the Cre recombinase (Cre)–loxP system under regulation of the mouse glial fibrillary acidic protein promoter to knock out the transcription factor signal transducer and activator of transcription 3 (STAT3) from astrocytes and test the effect this has on reactive remodeling, ganglion cell survival, and visual function after experimental glaucoma and nerve crush. After injury, STAT3 knockout mice displayed attenuated astrocyte hypertrophy and reactive remodeling; astrocytes largely maintained their honeycomb organization and glial tubes. These changes were associated with increased loss of ganglion cells and visual function over a 30-day period. Thus, reactive astrocytes play a protective role, preserving visual function. STAT3 signaling is an important mediator of various aspects of the reactive phenotype within optic nerve astrocytes.

Overview

The claims and statistics of this paper haven’t been checked yet.

Free: it reads the open-access text and checks the first 5 claims that cite a source we can check. Create a free account to check every claim.

A few free checks a day · papers already verified open instantly · results are public

Integrity signals

Registry

Crossref · 10.1084/jem.20160412

Cites

Statistics

Figures

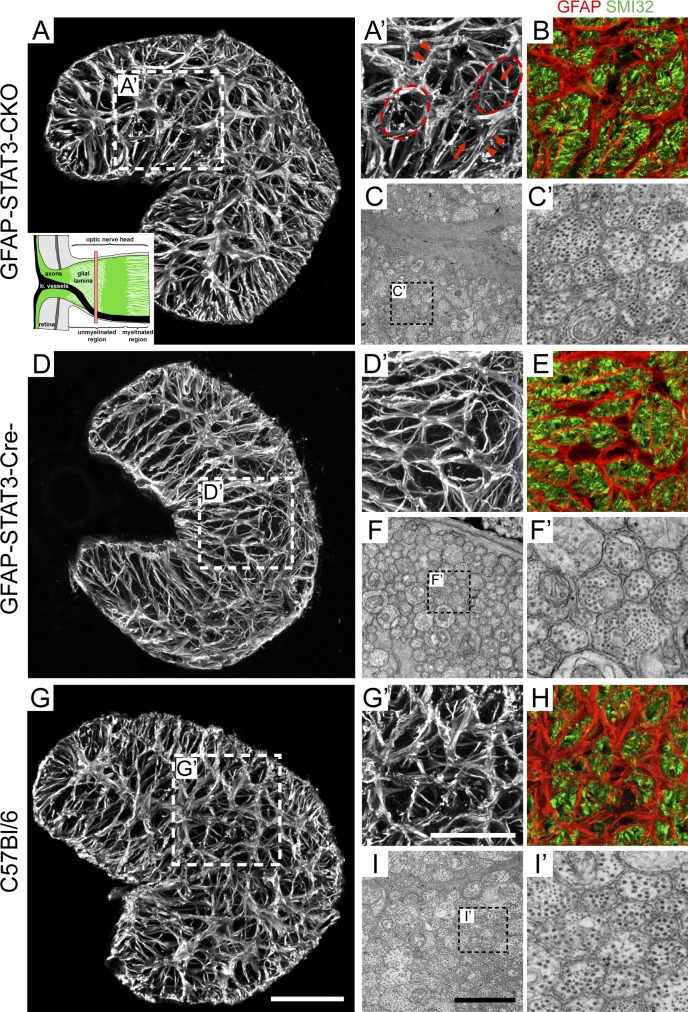
Figure 1. Untreated GFAP-STAT3-CKO mice have a glial lamina that appeared similar to its control strain and C57BL/6 mice. (A–B, D–E, and G–H) Transverse cross sections of optic nerves from the different mouse strains labeled for GFAP alone (A, A’, D, D’, G, and G’) or colocalized with SMI32 (B, E, and H). (A, inset) The red bar in the schematic of the optic nerve head indicates where the transverse sections have been made. Arrows indicate the thin processes of astrocytes, arrowheads indicate the thick main processes, and the dashed ellipses indicate glial tubes. (C, C’, F, F’, I, and I’) Ultrastructural examination of the optic nerve showing the axon–astrocyte organization and their morphology. Each panel represents a typical finding from a sample of three to five mice. Bars: (A, D, and G) 50 µm; (A’, B, D’, E, G’, and H) 20 µm; (C, F, and I) 2 µm.
Figure 1. Untreated GFAP-STAT3-CKO mice have a glial lamina that appeared similar to its control strain and C57BL/6 mice. (A–B, D–E, and G–H) Transverse cross sections of optic nerves from the different mouse strains labeled for GFAP alone (A, A’, D, D’, G, and G’) or colocalized with SMI32 (B, E, and H). (A, inset) The red bar in the schematic of the optic nerve head indicates where the transverse sections have been made. Arrows indicate the thin processes of astrocytes, arrowheads indicate the thick main processes, and the dashed ellipses indicate glial tubes. (C, C’, F, F’, I, and I’) Ultrastructural examination of the optic nerve showing the axon–astrocyte organization and their morphology. Each panel represents a typical finding from a sample of three to five mice. Bars: (A, D, and G) 50 µm; (A’, B, D’, E, G’, and H) 20 µm; (C, F, and I) 2 µm.CC BY-NC-SA · PubMed Central
Figure 2. Injury induces an early up-regulation of pSTAT3 in astrocytes of the glial lamina. (A–AA) Longitudinal sections of the optic nerve head from the different mouse strains and injuries stained for pSTAT3 (arrows). (E’) An enlargement from E showing colocalization of pSTAT3 with GFAP-labeled astrocytes. At no time after injury was there pSTAT3 labeling in GFAP-STAT3-CKO mice (not depicted). Each panel represents a typical finding from a sample of three to five mice. Bars: (A–AA, except E’) 50 µm; (E’) 10 µm.
Figure 2. Injury induces an early up-regulation of pSTAT3 in astrocytes of the glial lamina. (A–AA) Longitudinal sections of the optic nerve head from the different mouse strains and injuries stained for pSTAT3 (arrows). (E’) An enlargement from E showing colocalization of pSTAT3 with GFAP-labeled astrocytes. At no time after injury was there pSTAT3 labeling in GFAP-STAT3-CKO mice (not depicted). Each panel represents a typical finding from a sample of three to five mice. Bars: (A–AA, except E’) 50 µm; (E’) 10 µm.CC BY-NC-SA · PubMed Central
Figure 3. Immunostaining of STAT3 within the optic nerve head and pSTAT3 within the retina. (A–D) Transverse cross sections of the glial lamina from normal C57BL/6 mice and those that underwent chronic OHT immunostained for STAT3. (E–H) Vertical sections of the retina immunostained for either GFAP alone or for GFAP (green) and pSTAT3 (red). Arrows show the GFAP-labeled processes of mildly reactive Müller cells. Arrowheads show the cell bodies of GFAP-labeled astrocytes. (I–L) Vertical sections of the retina immunostained for either glutamine synthetase (GS) alone or for glutamine synthetase (green) and pSTAT3 (red). Arrows show colocalization of glutamine synthetase–labeled Müller cells with pSTAT3. (M–O) Vertical sections of the retina immunostained for GFAP (green) and pSTAT3 (red). Arrows show the cell bodies of GFAP-labeled astrocytes. For all the images, we observed a similar labeling pattern at day 1 (not depicted). GCL, ganglion cell layer; INL, inner nuclear layer; IPL, inner plexiform layer. Each panel represents a typical finding from a sample of three to five mice. Bars: (A–D) 10 µm; (E–L) 25 µm; (M–O) 25 µm.
Figure 3. Immunostaining of STAT3 within the optic nerve head and pSTAT3 within the retina. (A–D) Transverse cross sections of the glial lamina from normal C57BL/6 mice and those that underwent chronic OHT immunostained for STAT3. (E–H) Vertical sections of the retina immunostained for either GFAP alone or for GFAP (green) and pSTAT3 (red). Arrows show the GFAP-labeled processes of mildly reactive Müller cells. Arrowheads show the cell bodies of GFAP-labeled astrocytes. (I–L) Vertical sections of the retina immunostained for either glutamine synthetase (GS) alone or for glutamine synthetase (green) and pSTAT3 (red). Arrows show colocalization of glutamine synthetase–labeled Müller cells with pSTAT3. (M–O) Vertical sections of the retina immunostained for GFAP (green) and pSTAT3 (red). Arrows show the cell bodies of GFAP-labeled astrocytes. For all the images, we observed a similar labeling pattern at day 1 (not depicted). GCL, ganglion cell layer; INL, inner nuclear layer; IPL, inner plexiform layer. Each panel represents a typical finding from a sample of three to five mice. Bars: (A–D) 10 µm; (E–L) 25 µm; (M–O) 25 µm.CC BY-NC-SA · PubMed Central
Figure 4. STAT3 KO mice show attenuated astrocyte reactivity and remodeling after injury. (A) A transverse section of the glial lamina from normal C57BL/6 mice immunostained for GFAP. (B) Changes in the amount of GFAP immunonegative space within the glial lamina across the various mouse strains and injury models. (C–K) Transverse sections of the glial lamina immunostained for GFAP. (L) A comparison of the change in the thickness of GFAP-labeled processes within the glial lamina across the various mouse strains and injury models. (B and L) See Table S1 for the absolute numbers. Also, we are not making comparisons across injury models but, rather, between strains within each injury model. In all cases, there were no statistical differences between GFAP-STAT3-Cre− and C57BL/6 mice. Each gray dot represents an individual mouse (n = 6 for each group), and for each mouse in L, processes from 10–15 astrocytes were averaged. Horizontal lines represent the group means and SD. One-way ANOVA with Tukey posttest was used. *, P < 0.05; **, P < 0.01. (A and C–K) Each image represents a typical finding from a sample of six mice. The dashed ellipses indicate the distinct glial tubes. Bar, 20 µm.
Figure 4. STAT3 KO mice show attenuated astrocyte reactivity and remodeling after injury. (A) A transverse section of the glial lamina from normal C57BL/6 mice immunostained for GFAP. (B) Changes in the amount of GFAP immunonegative space within the glial lamina across the various mouse strains and injury models. (C–K) Transverse sections of the glial lamina immunostained for GFAP. (L) A comparison of the change in the thickness of GFAP-labeled processes within the glial lamina across the various mouse strains and injury models. (B and L) See Table S1 for the absolute numbers. Also, we are not making comparisons across injury models but, rather, between strains within each injury model. In all cases, there were no statistical differences between GFAP-STAT3-Cre− and C57BL/6 mice. Each gray dot represents an individual mouse (n = 6 for each group), and for each mouse in L, processes from 10–15 astrocytes were averaged. Horizontal lines represent the group means and SD. One-way ANOVA with Tukey posttest was used. *, P < 0.05; **, P < 0.01. (A and C–K) Each image represents a typical finding from a sample of six mice. The dashed ellipses indicate the distinct glial tubes. Bar, 20 µm.CC BY-NC-SA · PubMed Central
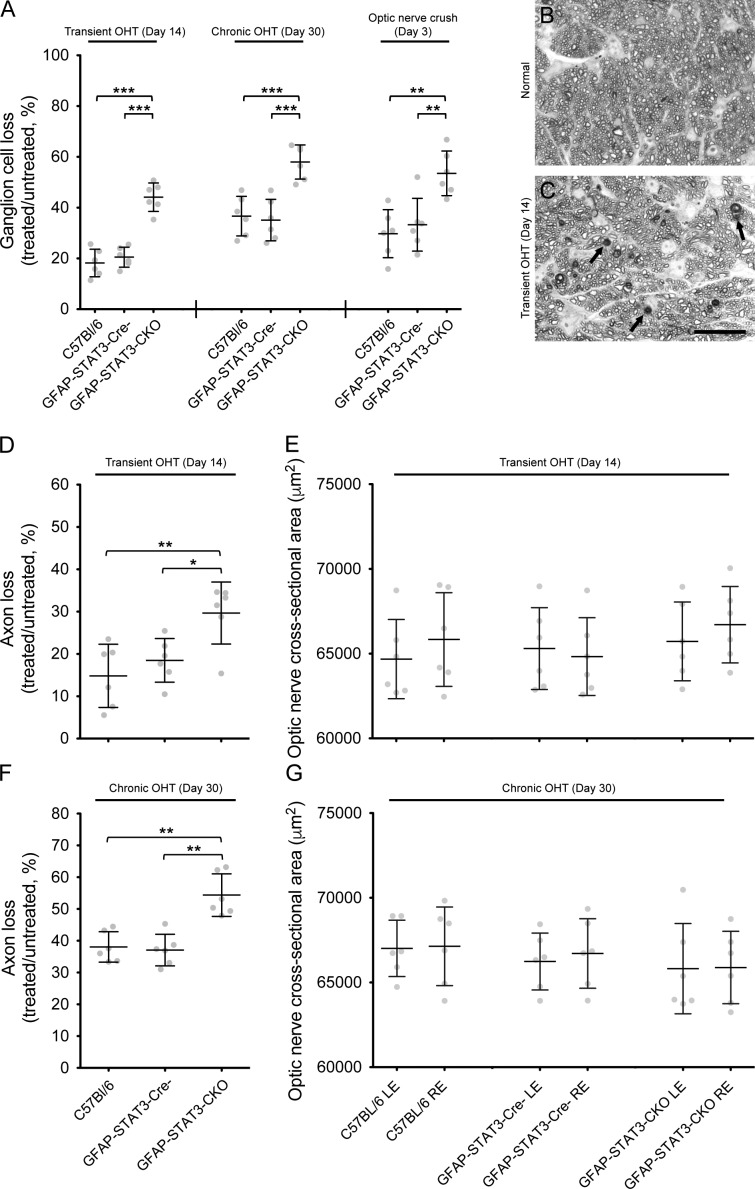
Figure 5. Ganglion cell soma and axon loss in the different mouse strains after transient and chronic OHT. (A) Ganglion cell loss in the treated eye, as a percentage of the untreated contralateral eye, across the various mouse strains and injury models. We are not making comparisons across injury models but, rather, between strains within each injury model. In all cases, there were no statistical differences between GFAP-STAT3-Cre− and C57BL/6 mice. (B and C) A representative PPD-stained cross section of normal (B) and injured (C) optic nerve from GFAP-STAT3-CKO mice. Damaged axons show a major loss of the normal axon profile, as well as clumps of myelin debris. These axons stain darkly with PPD (C, arrows). Bar, 20 µm. (D–G) Axon loss in the treated eye as a percentage of the untreated contralateral eye for each mouse strain after transient (D) and chronic (F) OHT and the changes in the optic nerve cross-sectional area (E and G). There was no significant difference in the cross-sectional area of the optic nerve for the different mouse strains after both injuries. Each gray dot represents an individual mouse (n = 6 for each group). Horizontal lines represent the group means and SD. See Table S2 for the absolute numbers. LE, left eye; RE, right eye. One-way ANOVA with Tukey posttest was used. *, P < 0.05; **, P < 0.01; ***, P < 0.001.
Figure 5. Ganglion cell soma and axon loss in the different mouse strains after transient and chronic OHT. (A) Ganglion cell loss in the treated eye, as a percentage of the untreated contralateral eye, across the various mouse strains and injury models. We are not making comparisons across injury models but, rather, between strains within each injury model. In all cases, there were no statistical differences between GFAP-STAT3-Cre− and C57BL/6 mice. (B and C) A representative PPD-stained cross section of normal (B) and injured (C) optic nerve from GFAP-STAT3-CKO mice. Damaged axons show a major loss of the normal axon profile, as well as clumps of myelin debris. These axons stain darkly with PPD (C, arrows). Bar, 20 µm. (D–G) Axon loss in the treated eye as a percentage of the untreated contralateral eye for each mouse strain after transient (D) and chronic (F) OHT and the changes in the optic nerve cross-sectional area (E and G). There was no significant difference in the cross-sectional area of the optic nerve for the different mouse strains after both injuries. Each gray dot represents an individual mouse (n = 6 for each group). Horizontal lines represent the group means and SD. See Table S2 for the absolute numbers. LE, left eye; RE, right eye. One-way ANOVA with Tukey posttest was used. *, P < 0.05; **, P < 0.01; ***, P < 0.001.CC BY-NC-SA · PubMed Central
Figure 6. Representative ERG responses from the various mouse strains at day 30 after injury. Responses from the untreated left eye are in gray, and the treated right eye is in black. Outer retinal function is represented by the scotopic waveforms and inner retinal function by the STR. Scotopic responses were obtained using a single-flash intensity of 2.13 log cd.s.m−2, and STRs were obtained using a single-flash intensity of −5.00 log cd.s.m−2. Each waveform represents a typical finding from a sample of six mice.
Figure 6. Representative ERG responses from the various mouse strains at day 30 after injury. Responses from the untreated left eye are in gray, and the treated right eye is in black. Outer retinal function is represented by the scotopic waveforms and inner retinal function by the STR. Scotopic responses were obtained using a single-flash intensity of 2.13 log cd.s.m−2, and STRs were obtained using a single-flash intensity of −5.00 log cd.s.m−2. Each waveform represents a typical finding from a sample of six mice.CC BY-NC-SA · PubMed Central
Figure 7. Changes in the pSTR amplitudes after injury. (A–D) A single-flash intensity of −5.00 log cd.s.m−2 was used to measure pSTR. The actual percentage value for the pSTR amplitude at day 30 is tabulated in D, where values are mean ± SD. A two-way repeated-measures ANOVA with Bonferroni posttest for three selected comparisons was performed (GFAP-STAT3-CKO vs. GFAP-STAT3-Cre−, GFAP-STAT3-CKO vs. C57BL/6, and GFAP-STAT3-Cre− vs. C57BL/6). Here, we only show the statistical differences between the GFAP-STAT3-CKO mice and its control strain (GFAP-STAT3-Cre−). There was no significant difference between GFAP-STAT3-Cre− and C57BL/6 mice for any injury and for any times after injury. Changes in the pSTR amplitude were calculated from the same eye before and after injury (e.g., amplitude after injury/amplitude before injury × 100%). Each colored dot represents an individual mouse (n = 6 for each mouse strain in each injury model). *, P < 0.05; **, P < 0.01; ***, P < 0.001.
Figure 7. Changes in the pSTR amplitudes after injury. (A–D) A single-flash intensity of −5.00 log cd.s.m−2 was used to measure pSTR. The actual percentage value for the pSTR amplitude at day 30 is tabulated in D, where values are mean ± SD. A two-way repeated-measures ANOVA with Bonferroni posttest for three selected comparisons was performed (GFAP-STAT3-CKO vs. GFAP-STAT3-Cre−, GFAP-STAT3-CKO vs. C57BL/6, and GFAP-STAT3-Cre− vs. C57BL/6). Here, we only show the statistical differences between the GFAP-STAT3-CKO mice and its control strain (GFAP-STAT3-Cre−). There was no significant difference between GFAP-STAT3-Cre− and C57BL/6 mice for any injury and for any times after injury. Changes in the pSTR amplitude were calculated from the same eye before and after injury (e.g., amplitude after injury/amplitude before injury × 100%). Each colored dot represents an individual mouse (n = 6 for each mouse strain in each injury model). *, P < 0.05; **, P < 0.01; ***, P < 0.001.CC BY-NC-SA · PubMed Central
Figure 8. Changes in the scotopic a- and b-wave amplitudes after injury. (A–F) A single-flash intensity of 2.13 log cd.s.m−2 was used to measure the a- and b-wave. A two-way repeated-measures ANOVA with Bonferroni posttest for three selected comparisons was performed (GFAP-STAT3-CKO vs. GFAP-STAT3-Cre−, GFAP-STAT3-CKO vs. C57BL/6, and GFAP-STAT3-Cre− vs. C57BL/6). There was no significant difference between the mouse strains for each of the injuries. Changes in the a- and b-wave amplitude were calculated from the same eye before and after injury (e.g., amplitude after injury/amplitude before injury × 100%). Each colored dot represents an individual mouse (n = 6 for each mouse strain in each injury model).
Figure 8. Changes in the scotopic a- and b-wave amplitudes after injury. (A–F) A single-flash intensity of 2.13 log cd.s.m−2 was used to measure the a- and b-wave. A two-way repeated-measures ANOVA with Bonferroni posttest for three selected comparisons was performed (GFAP-STAT3-CKO vs. GFAP-STAT3-Cre−, GFAP-STAT3-CKO vs. C57BL/6, and GFAP-STAT3-Cre− vs. C57BL/6). There was no significant difference between the mouse strains for each of the injuries. Changes in the a- and b-wave amplitude were calculated from the same eye before and after injury (e.g., amplitude after injury/amplitude before injury × 100%). Each colored dot represents an individual mouse (n = 6 for each mouse strain in each injury model).CC BY-NC-SA · PubMed Central
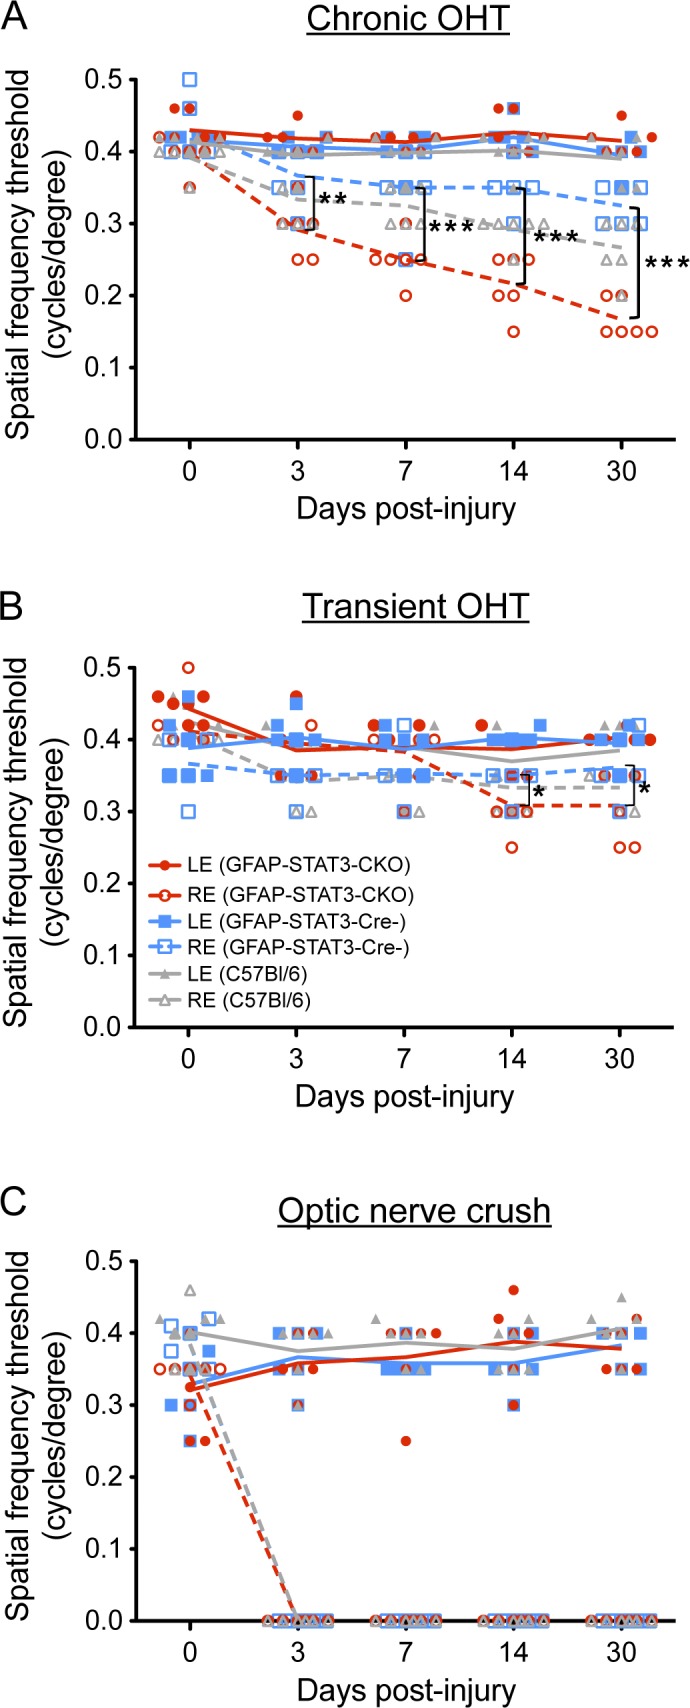
Figure 9. Changes in spatial frequency threshold after injury. (A–C) Each panel shows the treated right eye (RE; dashed colored lines) and untreated left eye (LE; solid colored lines). A two-way repeated-measures ANOVA with Bonferroni posttest for three selected comparisons was performed (GFAP-STAT3-CKO vs. GFAP-STAT3-Cre−, GFAP-STAT3-CKO vs. C57BL/6, and GFAP-STAT3-Cre− vs. C57BL/6). There was no significant difference between any of the untreated left eyes of any mouse strains in any of the injuries. Each colored dot represents an individual mouse (n = 6 for each mouse strain in each injury model). *, P < 0.05; **, P < 0.01; ***, P < 0.001.
Figure 9. Changes in spatial frequency threshold after injury. (A–C) Each panel shows the treated right eye (RE; dashed colored lines) and untreated left eye (LE; solid colored lines). A two-way repeated-measures ANOVA with Bonferroni posttest for three selected comparisons was performed (GFAP-STAT3-CKO vs. GFAP-STAT3-Cre−, GFAP-STAT3-CKO vs. C57BL/6, and GFAP-STAT3-Cre− vs. C57BL/6). There was no significant difference between any of the untreated left eyes of any mouse strains in any of the injuries. Each colored dot represents an individual mouse (n = 6 for each mouse strain in each injury model). *, P < 0.05; **, P < 0.01; ***, P < 0.001.CC BY-NC-SA · PubMed Central

Verification

Claims the paper makes

The claims and statistics of this paper haven’t been checked yet.

Free: it reads the open-access text and checks the first 5 claims that cite a source we can check. Create a free account to check every claim.

A few free checks a day · papers already verified open instantly · results are public

Claims other papers make about this one

Each is checked against this paper’s own text: does it say what the citing paper says it does?

Self-check

Percentages, sums and reported differences re-computed from the paper’s own numbers.

The self-check needs the paper’s full text.

Citations

The citation lists are queued

They are fetched later and appear here then.

References 132 · Cited by 130

Metadata

Authors
Sun, D., Moore, S., & Jakobs, T. C.
Affiliations
Massachusetts Eye and Ear Infirmary (US)
Corresponding author
Sun, Daniel
Venue
Journal of Experimental Medicine
Published
2017-04-17
Volume
214
Issue
5
Pages
1411-1430
ISSN
  • 0022-1007 (ISSN-L)
  • 1540-9538
OpenAlex
W2605876272
Cited by
130
References
132
Citations by year
2026: 8 · 2025: 9 · 2024: 15 · 2023: 17 · 2022: 21 · 2021: 17 · 2020: 15 · 2019: 14 · 2018: 10 · 2017: 3
FWCI
11.21
Type
journal article
Language
en
Open access
Locations
  • The Journal of Experimental Medicine (publishedVersion, cc-by-nc-sa)
  • PubMed Central (publishedVersion, cc-by-nc-sa)
  • PubMed (publishedVersion)
  • Digital Access to Scholarship at Harvard (DASH) (Harvard University) (submittedVersion, cc-by)
Funders
  • National Institutes of Health (R01 EY022092, R01 EY019703, P30 EY003790)
  • Research to Prevent Blindness
  • National Glaucoma Research
  • BrightFocus Foundation
Topics
  • Health Sciences › Medicine › Ophthalmology › Glaucoma and retinal disorders
  • Life Sciences › Neuroscience › Cellular and Molecular Neuroscience › Nerve injury and regeneration
  • Health Sciences › Medicine › Clinical Neurology › Traumatic Brain Injury and Neurovascular Disturbances
Keywords
glaucoma, STAT3, astrocyte activation, reactive astrocytes, ganglion cell survival, visual function, optic nerve crush, glial fibrillary acidic protein promoter, astrocyte hypertrophy, neuroprotection
MeSH terms
Animals, Astrocytes, Glaucoma, Male, Mice, Inbred C57BL, Neuronal Plasticity, Optic Nerve, Retinal Ganglion Cells, Vision, Ocular, Mice, Knockout, STAT3 Transcription Factor, Mice

About these checks

Registry, retraction, Cites and statistics results are computed, not judged, with one exception: a printed reference that no index lists is read once by a model before it counts as a citation error. Claims are extracted by a model and kept only when their quote appears verbatim in the text; each cited source is then checked, with a model’s help, for whether it says what the claim relies on. Those verdicts can be wrong — read the claim’s quote and the cited source before relying on one.

Statistics and arithmetic are recomputed, not judged.

Confidence bands are shown only for fields calibrated on our annotated test set. None is calibrated yet, so no band is shown.

What counts as a claim ›How we measure confidence ›How we check this ›

Are you an author, or do you see a problem with this page? Request a review

How to cite

Cite CoChat for the checks on this page, and the paper for its own findings.

This page
CoChat. (2026). Citation check: Optic nerve astrocyte reactivity protects function in experimental glaucoma and other nerve injuries. https://app.cochat.ai/papers/10.1084/jem.20160412
The paper
Sun, D., Moore, S., & Jakobs, T. C. (2017). Optic nerve astrocyte reactivity protects function in experimental glaucoma and other nerve injuries. Journal of Experimental Medicine. https://doi.org/10.1084/jem.20160412

Data sources

Bibliographic data: Semantic Scholar, OpenAlex, Crossref.

Contains information from the Semantic Scholar Academic Graph Datasets, made available under the ODC Attribution License (ODC-BY 1.0).

Semantic Scholar’s data is described in: Kinney, R., et al. (2023). The Semantic Scholar Open Data Platform. arXiv:2301.10140.