

The DOI matches its Crossref record; 90 of the 91 references it cites were found in a registry or an index.
Peptidylarginine deiminase 4 promotes age-related organ fibrosis
Open accessAbstract
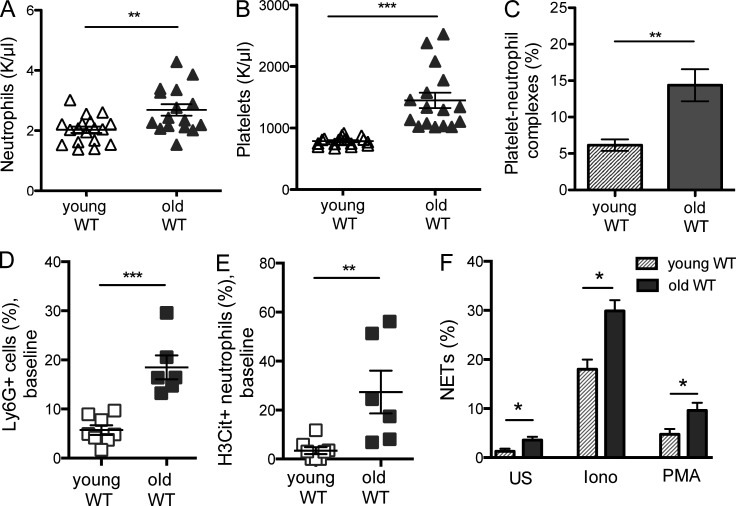
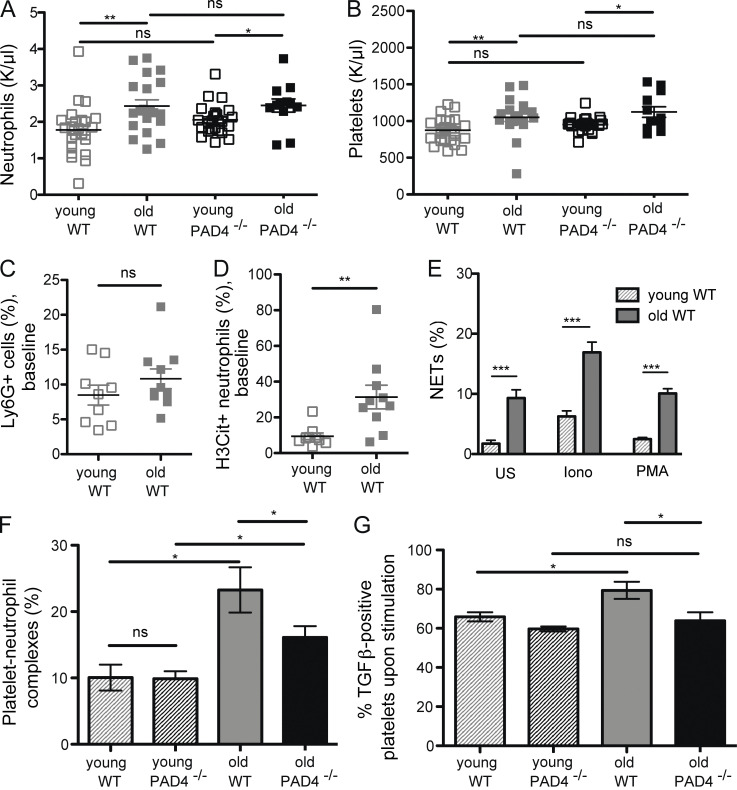
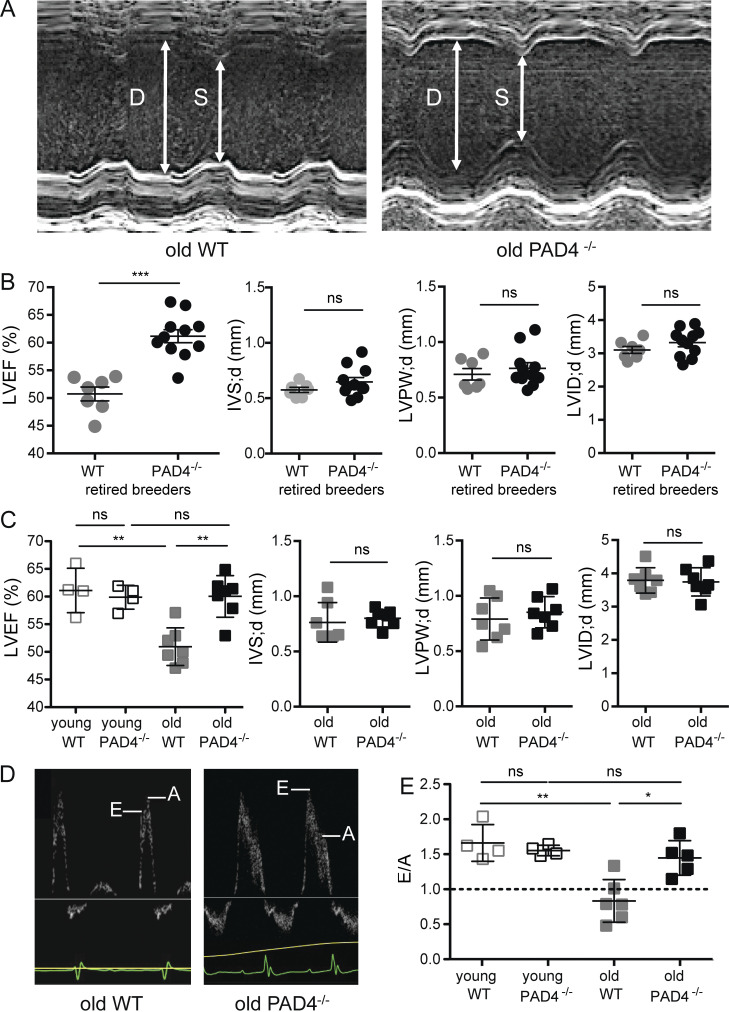
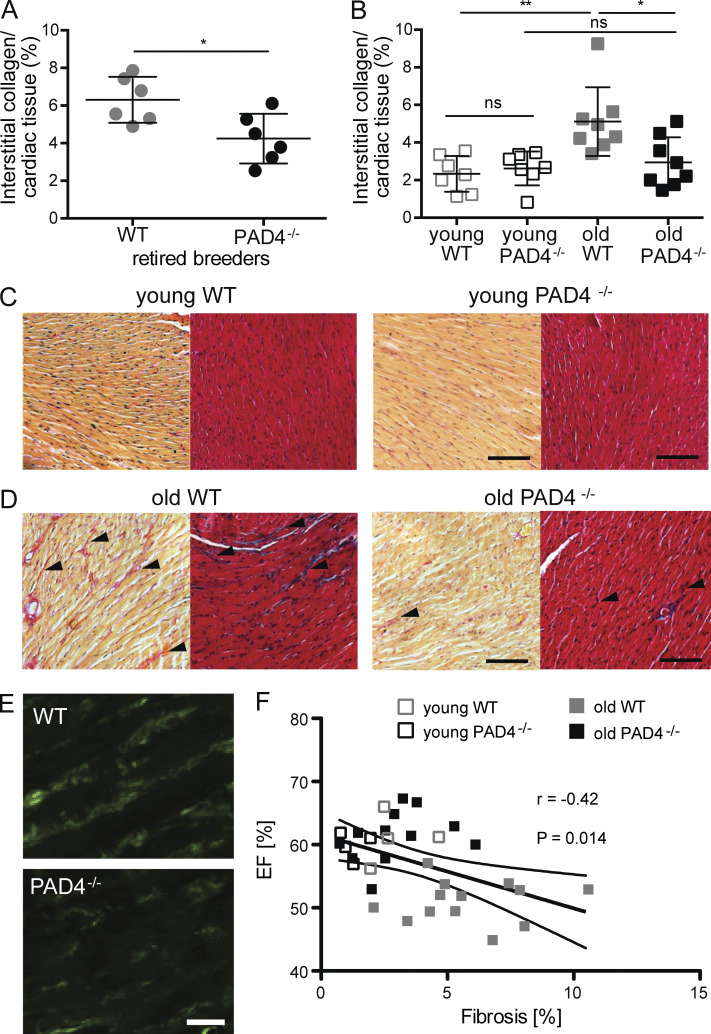
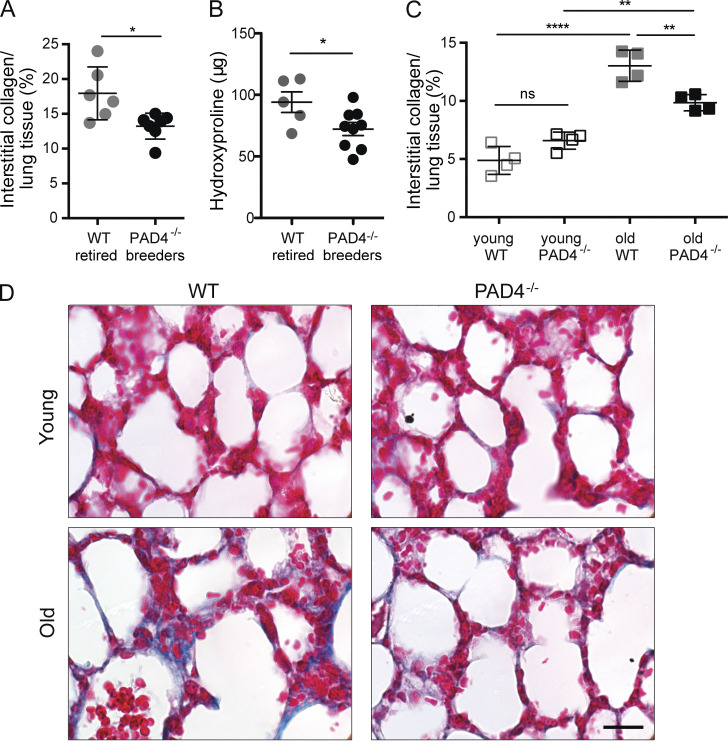
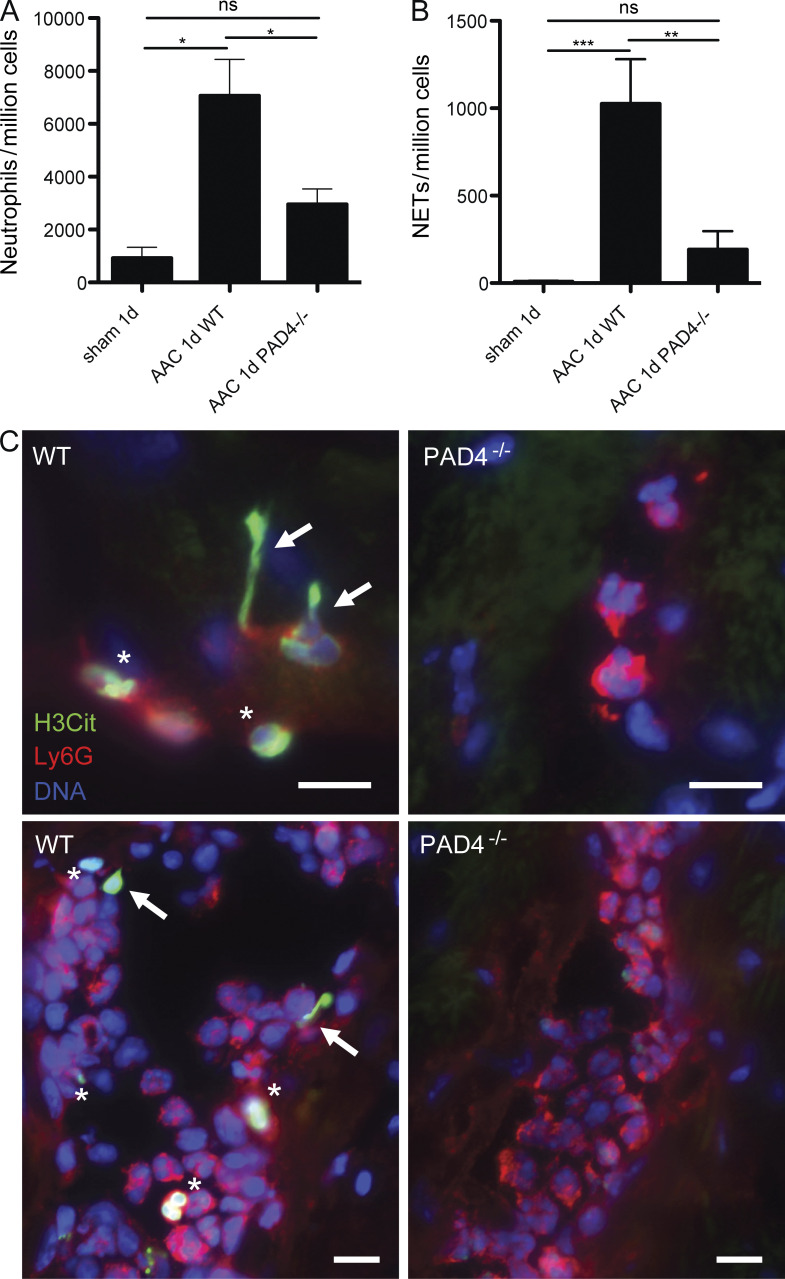
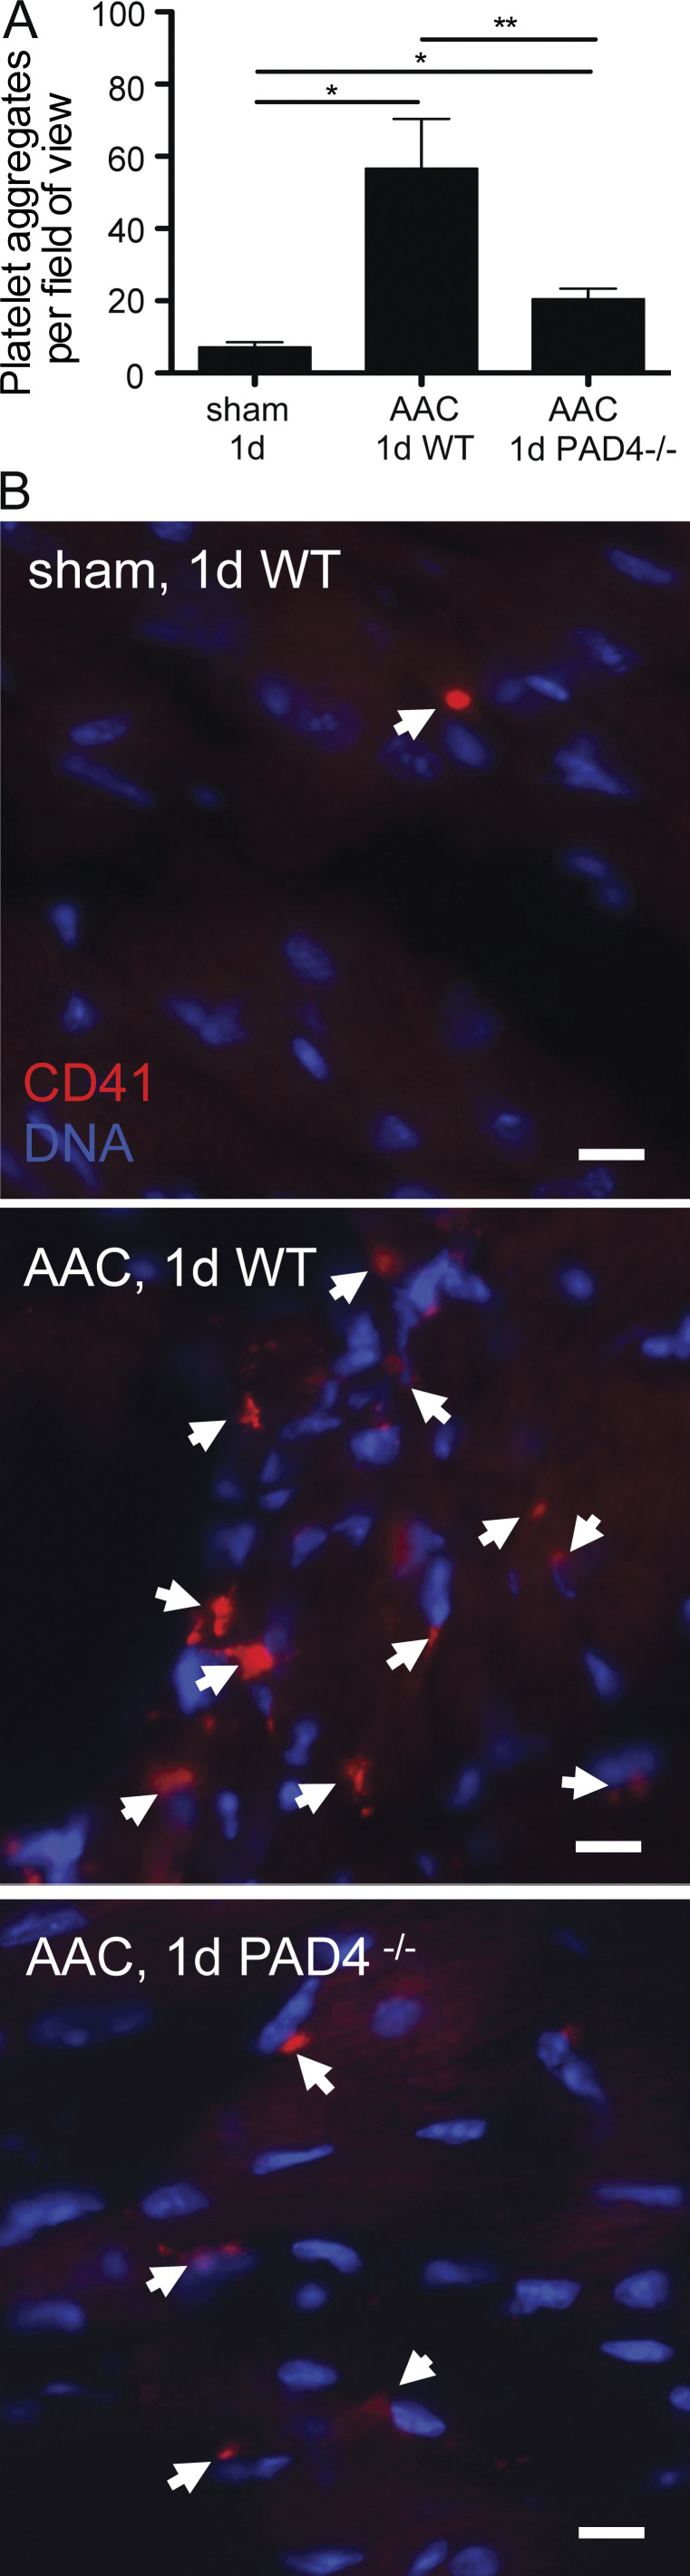
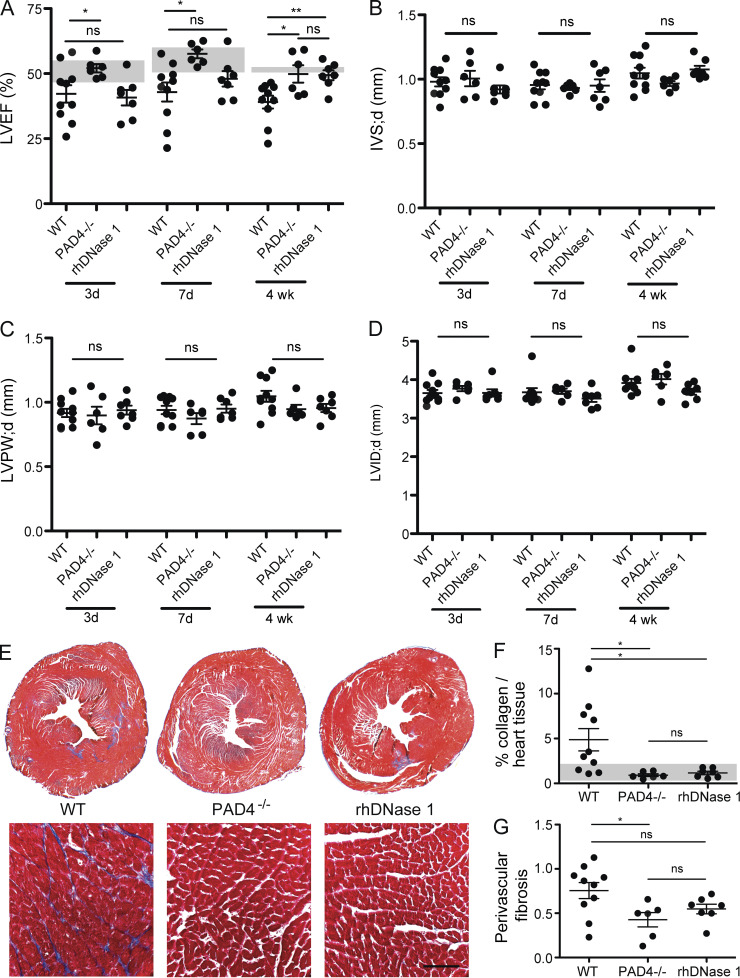
Aging promotes inflammation, a process contributing to fibrosis and decline in organ function. The release of neutrophil extracellular traps (NETs [NETosis]), orchestrated by peptidylarginine deiminase 4 (PAD4), damages organs in acute inflammatory models. We determined that NETosis is more prevalent in aged mice and investigated the role of PAD4/NETs in age-related organ fibrosis. Reduction in fibrosis was seen in the hearts and lungs of aged PAD4−/− mice compared with wild-type (WT) mice. An increase in left ventricular interstitial collagen deposition and a decline in systolic and diastolic function were present only in WT mice, and not in PAD4−/− mice. In an experimental model of cardiac fibrosis, cardiac pressure overload induced NETosis and significant platelet recruitment in WT but not PAD4−/− myocardium. DNase 1 was given to assess the effects of extracellular chromatin. PAD4 deficiency or DNase 1 similarly protected hearts from fibrosis. We propose a role for NETs in cardiac fibrosis and conclude that PAD4 regulates age-related organ fibrosis and dysfunction.
Overview
The claims and statistics of this paper haven’t been checked yet.
Run the check — free, no account needed. It reads the open-access text and checks the sources it cites.
Integrity signals
Registry
Cites
Statistics
Figures
Verification
Claims the paper makes
The claims and statistics of this paper haven’t been checked yet.
Run the check — free, no account needed. It reads the open-access text and checks the sources it cites.
Claims other papers make about this one
Each is checked against this paper’s own text: does it say what the citing paper says it does?
The cited source says what the claim attributes to it.
In the citing paper
“A previous study found that aged mice exhibited an increased propensity for NETosis compared to younger mice.”
From Inflammation and aging: signaling pathways and intervention therapies (2023) · cites this paper as [270]
The cited source says what the claim attributes to it.
In the citing paper
“This heightened NETosis activity was associated with the activation of peptidylarginine deiminase 4 (PAD4), an enzyme involved in the formation of NETs.”
From Inflammation and aging: signaling pathways and intervention therapies (2023) · cites this paper as [270]
The cited source says what the claim attributes to it.
In the citing paper
“The excessive formation of NETs, in turn, was implicated in the development of age-related organ fibrosis.270”
From Inflammation and aging: signaling pathways and intervention therapies (2023) · cites this paper as [270]
Self-check
Percentages, sums and reported differences re-computed from the paper’s own numbers.
The self-check needs the paper’s full text.
Citations
Cites
Neutrophil Extracellular Traps Kill Bacteria
Brinkmann, V., Reichard, U., Goosmann, C., Fauler, B., Uhlemann, Y., Weiss, D. S., Weinrauch, Y., & Zychlinsky, A. (2004) · Science · doi:10.1126/science.1092385 · Cited by 10,268
Mizgerd, J. P., Kubo, H., Kutkoski, G. J., Bhagwan, S. D., Scharffetter-Kochanek, K., Beaudet, A. L., & Doerschuk, C. M. (1997) · The Journal of Experimental Medicine · doi:10.1084/jem.186.8.1357 · Cited by 7,332
Neutrophil recruitment and function in health and inflammation
Kolaczkowska, E., & Kubes, P. (2013) · Nature Reviews Immunology · doi:10.1038/nri3399 · Cited by 5,472
Theory and Practice of Histological Techniques
Goss, G. R. (2009) · The American Journal of Surgical Pathology · doi:10.1097/pas.0b013e3181805089 · Cited by 5,454
Woessner, J. F. (1961) · Archives of Biochemistry and Biophysics · doi:10.1016/0003-9861(61)90291-0 · Cited by 3,849
Mechanisms of fibrosis: therapeutic translation for fibrotic disease
Wynn, T. A., & Ramalingam, T. R. (2012) · Nature Medicine · doi:10.1038/nm.2807 · Cited by 3,541
Oxidative Stress, Caloric Restriction, and Aging
Sohal, R. S., & Weindruch, R. H. (1996) · Science · doi:10.1126/science.273.5271.59 · Cited by 3,133
Extracellular DNA traps promote thrombosis
Fuchs, T. A., Brill, A. G., Duerschmied, D., Schatzberg, D., Monestier, M., Myers, D. D., Wrobleski, S. K., Wakefield, T. W., Hartwig, J. H., & Wagner, D. D. (2010) · Proceedings of the National Academy of Sciences · doi:10.1073/pnas.1005743107 · Cited by 2,591
Self-citationJunqueira, L. C. U., Bignolas, G., & Brentani, H. (1979) · The Histochemical Journal · doi:10.1007/bf01002772 · Cited by 2,570
Platelet TLR4 activates neutrophil extracellular traps to ensnare bacteria in septic blood
Clark, S. R., Ma, A. C., Tavener, S. A., McDonald, B., Goodarzi, Z., Kelly, M. M., Patel, K. D., Chakrabarti, S., McAvoy, E., Sinclair, G. D., et al. (2007) · Nature Medicine · doi:10.1038/nm1565 · Cited by 2,309
Research works printed but not linked: 1
- Bancroft, 2008, Connective tissue and stains, 135
Cited by
Sorted by citations
Neutrophil extracellular traps in immunity and disease
Papayannopoulos, V. (2017) · Nature reviews. Immunology · doi:10.1038/nri.2017.105 · Cited by 3,571
Inflammation and aging: signaling pathways and intervention therapies
Li, X., Li, C., Zhang, W., Wang, Y., Qian, P., & Huang, H. (2023) · Signal Transduction and Targeted Therapy · doi:10.1038/s41392-023-01502-8 · Cited by 1,443
“The excessive formation of NETs, in turn, was implicated in the development of age-related organ fibrosis.(270) In conclusion, the process of aging can adversely affect the ability of neutrophils to undergo NETosis.”
BackgroundCardiac fibrosis: Cell biological mechanisms, molecular pathways and therapeutic opportunities
Frangogiannis, N. G. (2018) · Molecular Aspects of Medicine · doi:10.1016/j.mam.2018.07.001 · Cited by 888
Neutrophils as emerging therapeutic targets
Németh, T., Sperandio, M., & Mócsai, A. (2020) · Nature Reviews Drug Discovery · doi:10.1038/s41573-019-0054-z · Cited by 676
Neutrophil phenotypes and functions in cancer: A consensus statement
Quail, D. F., Amulic, B., Aziz, M., Barnes, B. J., Eruslanov, E. B., Fridlender, Z. G., Goodridge, H. S., Granot, Z., Hidalgo, A., Huttenlocher, A., et al. (2022) · The Journal of Experimental Medicine · doi:10.1084/jem.20220011 · Cited by 347
Self-citationInflammation, Infection and Venous Thromboembolism
Colling, M. E., Tourdot, B. E., & Kanthi, Y. M. (2021) · Circulation Research · doi:10.1161/circresaha.121.318225 · Cited by 333
Chronic stress increases metastasis via neutrophil-mediated changes to the microenvironment
He, X., Gao, Y., Ng, D., Michalopoulou, E., George, S., Adrover, J. M., Sun, L., Albrengues, J., Daßler‐Plenker, J., Han, X., et al. (2024) · Cancer Cell · doi:10.1016/j.ccell.2024.01.013 · Cited by 311
Neutrophil Extracellular Traps Drive Endothelial-to-Mesenchymal Transition
Pieterse, E., Rother, N., Garsen, M., Hofstra, J. M., Satchell, S. C., Hoffmann, M. H., Loeven, M. A., Knaapen, H. K. A., van der Heijden, O. W. H., Berden, J. H. M., et al. (2017) · Arteriosclerosis Thrombosis and Vascular Biology · doi:10.1161/atvbaha.117.309002 · Cited by 256
Crossing epigenetic frontiers: the intersection of novel histone modifications and diseases
Yao, W., Hu, X., & Wang, X. (2024) · Signal Transduction and Targeted Therapy · doi:10.1038/s41392-024-01918-w · Cited by 257
Electrospun fiber‐based immune engineering in regenerative medicine
Xu, Y., Saiding, Q., Zhou, X. M., Wang, J., Cui, W., & Chen, X. (2024) · Smart Medicine · doi:10.1002/smmd.20230034 · Cited by 211
Extracellular DNA NET-Works With Dire Consequences for Health
Sorvillo, N., Cherpokova, D., Martinod, K., & Wagner, D. D. (2019) · Circulation Research · doi:10.1161/circresaha.119.314581 · Cited by 201
Self-citationExtracellular DNA traps in inflammation, injury and healing
Daniel, C., Leppkes, M., Munoz, L. E., Schley, G., Schett, G. A., & i, M. H. (2019) · Nature Reviews Nephrology · doi:10.1038/s41581-019-0163-2 · Cited by 196
Münzer, P., Negro, R., Fukui, S., Meglio, L. D., Aymonnier, K., Chu, L., Cherpokova, D., Gutch, S., Sorvillo, N., Shi, L. S., et al. (2021) · Frontiers in Immunology · doi:10.3389/fimmu.2021.683803 · Cited by 197
Self-citationNeutrophil extracellular traps promote fibrous vascular occlusions in chronic thrombosis
Sharma, S., Hofbauer, T. M., Ondracek, A. S., Chausheva, S., Alimohammadi, A., Artner, T., Panzenboeck, A., Rinderer, J., Shafran, I. H., Mangold, A., et al. (2020) · Blood · doi:10.1182/blood.2020005861 · Cited by 173
Novel findings in neutrophil biology and their impact on cardiovascular disease
Bonaventura, A., Montecucco, F., Dallegri, F., Carbone, F., Lüscher, T. F., Camici, G. G., & Liberale, L. (2019) · Cardiovascular Research · doi:10.1093/cvr/cvz084 · Cited by 178
JAK2V617F-Mediated Clonal Hematopoiesis Accelerates Pathological Remodeling in Murine Heart Failure
Sano, S., Wang, Y., Yura, Y., Sano, M., Oshima, K., Yang, Y., Katanasaka, Y., Min, K.-D., Matsuura, S., Ravid, K., et al. (2019) · JACC: Basic to Translational Science · doi:10.1016/j.jacbts.2019.05.013 · Cited by 170
Cardiovascular Disease, Aging, and Clonal Hematopoiesis
Evans, M. A., Sano, S., & Walsh, K. X. (2019) · Annual Review of Pathology Mechanisms of Disease · doi:10.1146/annurev-pathmechdis-012419-032544 · Cited by 169
Chirivi, R. G. S., van Rosmalen, J. W. G., van der Linden, M., Euler, M., Schmets, G., Bogatkevich, G. S., Kambas, K., Hahn, J., Braster, Q., Soehnlein, O., et al. (2020) · Cellular and Molecular Immunology · doi:10.1038/s41423-020-0381-3 · Cited by 160
The Pathophysiological Role of Neutrophil Extracellular Traps in Inflammatory Diseases
Bonaventura, A., Liberale, L., Carbone, F., Vecchié, A., Díaz-Cañestro, C., Camici, G. G., Montecucco, F., & Dallegri, F. (2018) · Thrombosis and Haemostasis · doi:10.1160/th17-09-0630 · Cited by 157
Li, M., Lin, C., Deng, H., Strnad, J., Bernabei, L. L., Vogl, D. T., Burke, J. J., & Nefedova, Y. (2020) · Molecular Cancer Therapeutics · doi:10.1158/1535-7163.mct-19-1020 · Cited by 152
Wong, S. L., & Wagner, D. D. (2018) · The FASEB Journal · doi:10.1096/fj.201800691r · Cited by 151
Self-citationNeutrophils in aging and aging‐related pathologies
Avondt, K. V., Strecker, J., Tulotta, C., Minnerup, J., Schulz, C., & Soehnlein, O. (2022) · Immunological Reviews · doi:10.1111/imr.13153 · Cited by 155
PAD4 deficiency improves bleomycin-induced neutrophil extracellular traps and fibrosis in mouse lung
Suzuki, M., Ikari, J., Anazawa, R., Tanaka, N., Katsumata, Y., Shimada, A., Suzuki, E., & Tatsumi, K. (2020) · American Journal of Respiratory Cell and Molecular Biology · doi:10.1165/rcmb.2019-0433oc · Cited by 143
Immunothrombosis and thromboinflammation in host defense and disease
Martinod, K., & Deppermann, C. (2020) · Platelets · doi:10.1080/09537104.2020.1817360 · Cited by 155
Self-citationCathelicidins prime platelets to mediate arterial thrombosis and tissue inflammation
Pircher, J., Czermak, T., Ehrlich, A., Eberle, C., Gaitzsch, E., Margraf, A., Grommes, J., Saha, P., Titova, A., Ishikawa-Ankerhold, H. C., et al. (2018) · Nature Communications · doi:10.1038/s41467-018-03925-2 · Cited by 135
FOXO1/3: Potential suppressors of fibrosis
Xin, Z., Ma, Z., Hu, W., Jiang, S., Yang, Z. P., Li, T. X., Chen, F., Jia, G., & Yang, Y. (2017) · Ageing Research Reviews · doi:10.1016/j.arr.2017.11.002 · Cited by 131
Midkine drives cardiac inflammation by promoting neutrophil trafficking and NETosis in myocarditis
Weckbach, L. T., Grabmaier, U., Uhl, A., Gess, S., Boehm, F., Zehrer, A., Pick, R., Salvermoser, M., Czermak, T., Pircher, J., et al. (2019) · The Journal of Experimental Medicine · doi:10.1084/jem.20181102 · Cited by 132
Nuclear envelope rupture and NET formation is driven by PKCα‐mediated lamin B disassembly
Li, Y., Li, M., Weigel, B., Mall, M., Werth, V. P., & Liu, M. (2020) · EMBO Reports · doi:10.15252/embr.201948779 · Cited by 106
Eghbalzadeh, K., Georgi, L., Louis, T., Zhao, H., Keser, U., Weber, C., Mollenhauer, M., Conforti, A., Wahlers, T., & Paunel‐Görgülü, A. (2019) · Frontiers in Immunology · doi:10.3389/fimmu.2019.02313 · Cited by 108
Sorvillo, N., Mizurini, D. M., Coxon, C. H., Martinod, K., Tilvawala, R. R., Cherpokova, D., Salinger, A. J., Seward, R., Staudinger, C., Weerapana, E., et al. (2019) · Circulation Research · doi:10.1161/circresaha.118.314571 · Cited by 104
Self-citationAn, S., Raju, I., Surenkhuu, B., Kwon, J.-E., Gulati, S., Karaman, M., Pradeep, A., Sinha, S., Mun, C., & Jain, S. K. (2019) · The Ocular Surface · doi:10.1016/j.jtos.2019.03.010 · Cited by 102
Neutrophil extracellular traps and fibrocytes in ST-segment elevation myocardial infarction
Hofbauer, T. M., Mangold, A., Scherz, T., Seidl, V., Panzenboeck, A., Ondracek, A. S., Müller, J., Schneider, M., Binder, T. M., Hell, L., et al. (2019) · Basic Research in Cardiology · doi:10.1007/s00395-019-0740-3 · Cited by 100
Tissue-level inflammation and ventricular remodeling in hypertrophic cardiomyopathy
Becker, R. C., Owens, A. P., & Sadayappan, S. (2020) · Journal of Thrombosis and Thrombolysis · doi:10.1007/s11239-019-02026-1 · Cited by 90
Serum and Serum Albumin Inhibit in vitro Formation of Neutrophil Extracellular Traps (NETs)
Neubert, E., Senger-Sander, S. N., Manzke, V. S., Busse, J., Polo, E., Scheidmann, S. E. F., Schön, M. P., Kruss, S., & Erpenbeck, L. (2019) · Frontiers in Immunology · doi:10.3389/fimmu.2019.00012 · Cited by 91
Self-citationWang, Y., Sano, S., Oshima, K., Sano, M., Watanabe, Y., Katanasaka, Y., Yura, Y., Jung, C. H., Anzai, A., Świrski, F. K., et al. (2019) · Circulation · doi:10.1161/circulationaha.118.038820 · Cited by 88
Insights into peptidylarginine deiminase expression and citrullination pathways
Yu, K., & Proost, P. (2022) · Trends in Cell Biology · doi:10.1016/j.tcb.2022.01.014 · Cited by 89
Aging Reprograms the Hematopoietic-Vascular Niche to Impede Regeneration and Promote Fibrosis
Chen, Y., Pu, Q., Ma, Y., Zhang, H., Ye, T., Zhao, C., Huang, X., Ren, Y., Qiao, L., Liu, H., et al. (2020) · Cell Metabolism · doi:10.1016/j.cmet.2020.11.019 · Cited by 92
Abaricia, J. O., Shah, A. H., & Olivares‐Navarrete, R. (2021) · Biomaterials · doi:10.1016/j.biomaterials.2021.120715 · Cited by 86
CXCL4 drives fibrosis by promoting several key cellular and molecular processes
Affandi, A. J., Carvalheiro, T., Ottria, A., de Haan, J. J., Brans, M. A. D., Brandt, M. M., Tieland, R. G., Lopes, A. P., Malvar‐Fernández, B., Bekker, C. P. J., et al. (2022) · Cell Reports · doi:10.1016/j.celrep.2021.110189 · Cited by 86
HMGB1‐Promoted Neutrophil Extracellular Traps Contribute to Cardiac Diastolic Dysfunction in Mice
Zhang, X., Wang, T., Chen, Z., Wang, H., Yin, Y., Wang, L., Wang, Y., Xu, B., & Xu, W. (2022) · Journal of the American Heart Association · doi:10.1161/jaha.121.023800 · Cited by 77
Silva, J. C., Rodrigues, N. C., Thompson‐Souza, G. A., Muniz, V. S., Neves, J. S., & Figueiredo, R. T. (2019) · Journal of Leukocyte Biology · doi:10.1002/jlb.4a0119-009rr · Cited by 79
Shi, L. S., Yao, H., Liu, Z., Xu, M. Q., Tsung, A., & Wang, Y. (2020) · Molecular Cancer Research · doi:10.1158/1541-7786.mcr-19-0018 · Cited by 73
Gajendran, C., Fukui, S., Sadhu, N. M., Zainuddin, M., Rajagopal, S., Gosu, R., Gutch, S., Fukui, S., Sheehy, C. E., Chu, L., et al. (2023) · Scientific Reports · doi:10.1038/s41598-023-30246-2 · Cited by 70
Self-citationUnraveling Vascular Inflammation
Teague, H., Ahlman, M. A., Alavi, A. A., Wagner, D. D., Lichtman, A. H., Nahrendorf, M., Świrski, F. K., Nestle, F. O., Gelfand, J. M., Kaplan, M. J., et al. (2017) · Journal of the American College of Cardiology · doi:10.1016/j.jacc.2017.07.750 · Cited by 71
Self-citationKim, J. H., Podstawka, J., Lou, Y., Lü, L., Lee, E. K. S., Divangahi, M., Petri, B., Jirik, F. R., Kelly, M. M., & Yipp, B. G. (2018) · Nature Immunology · doi:10.1038/s41590-017-0030-x · Cited by 68
Arroyo, A. B., Reyes‐García, A. M. D. L., Rivera‐Caravaca, J. M., Valledor, P., García‐Barberá, N., Roldán, V., Vicente, V., Martı́nez, C., & Gónzález‐Conejero, R. (2018) · Arteriosclerosis Thrombosis and Vascular Biology · doi:10.1161/atvbaha.117.310597 · Cited by 70
Neutrophil inhibition improves acute inflammation in a murine model of viral myocarditis
Carai, P., González, L. F., Bruggen, S. V., Spalart, V., Giorgio, D. D., Geuens, N., Martinod, K., Jones, E. A. V., & Heymans, S. R. B. (2022) · Cardiovascular Research · doi:10.1093/cvr/cvac052 · Cited by 69
Self-citationBryk, A. H., Prior, S. M., Plens, K., Konieczyńska, M., Hohendorff, J., Malecki, M. T., Butenas, S., & Undas, A. (2019) · Cardiovascular Diabetology · doi:10.1186/s12933-019-0850-0 · Cited by 68
Latella, G., & Rieder, F. (2017) · Current Opinion in Gastroenterology · doi:10.1097/mog.0000000000000363 · Cited by 72
Effect of Adhesion and Substrate Elasticity on Neutrophil Extracellular Trap Formation
Erpenbeck, L., Gruhn, A. L., Kudryasheva, G., Günay, G., Meyer, D., Neubert, E., Grandke, J., Schön, M. P., Rehfeldt, F., & Kruss, S. (2019) · Frontiers in Immunology · doi:10.3389/fimmu.2019.02320 · Cited by 63
Self-citationWang, S., Song, Y., Wang, Z., Chang, X., Wu, H., Yan, Z., Wu, J., He, Z., Kang, L., Hu, W., et al. (2024) · Cellular and Molecular Immunology · doi:10.1038/s41423-024-01158-6 · Cited by 64
NETosis as a Pathogenic Factor for Heart Failure
Ling, S., & Xu, J. (2021) · Oxidative Medicine and Cellular Longevity · doi:10.1155/2021/6687096 · Cited by 64
Roadmap for alleviating the manifestations of ageing in the cardiovascular system
Liberale, L., Tual-Chalot, S., Sedej, S., Ministrini, S., Georgiopoulos, G., Grunewald, M., Bäck, M., Bochaton-Piallat, M.-L., Boon, R. A., Ramos, G. C., et al. (2025) · Nature Reviews Cardiology · doi:10.1038/s41569-025-01130-5 · Cited by 59
Upregulation of citrullination pathway: From Autoimmune to Idiopathic Lung Fibrosis
Samara, K. D., Trachalaki, A., Tsitoura, E., Koutsopoulos, A. V., Lagoudaki, E. D., Lasithiotaki, I., Margaritopoulos, G. A., Pantelidis, P., Bibaki, E., Siafakas, N. M., et al. (2017) · Respiratory Research · doi:10.1186/s12931-017-0692-9 · Cited by 59
Chemokines in cardiac fibrosis
Li, R., & Frangogiannis, N. G. (2020) · Current Opinion in Physiology · doi:10.1016/j.cophys.2020.10.004 · Cited by 55
Prmt1 upregulated by Hdc deficiency aggravates acute myocardial infarction via NETosis
Zhang, Z., Ding, S., Wang, Z., Zhu, X., Zhou, Z., Zhang, W., Yang, X., & Ge, J. (2021) · Acta Pharmaceutica Sinica B · doi:10.1016/j.apsb.2021.10.016 · Cited by 53
Pratt, H. G., Steinberger, K. J., Mihalik, N. E., Ott, S., Whalley, T., Szomolay, B., Boone, B. A., & Eubank, T. D. (2021) · Cancers · doi:10.3390/cancers14010194 · Cited by 58
The Role of Immune Cells in the Pathogenesis of Idiopathic Pulmonary Fibrosis
Xu, Y., Lan, P., & Wang, T. (2023) · Medicina · doi:10.3390/medicina59111984 · Cited by 58
Ding, B., Yang, D., Swendeman, S. L., Christoffersen, C., Nielsen, L. B., Friedman, S. L., Powell, C. A., Hla, T., & Cao, Z. (2020) · Developmental Cell · doi:10.1016/j.devcel.2020.05.024 · Cited by 52
Immunomodulation and immunopharmacology in heart failure
Markousis‐Mavrogenis, G., Baumhove, L., Al‐Mubarak, A. A., Aboumsallem, J. P., Bömer, N., Voors, A. A., & van der Meer, P. (2023) · Nature Reviews Cardiology · doi:10.1038/s41569-023-00919-6 · Cited by 51
Neutrophils are indispensable for adverse cardiac remodeling in heart failure
Antipenko, S. V., Mayfield, N., Jinno, M., Gunzer, M., Ismahil, M. A., Hamid, T., Prabhu, S. D., & Rokosh, G. D. (2024) · Journal of Molecular and Cellular Cardiology · doi:10.1016/j.yjmcc.2024.02.005 · Cited by 51
Von Willebrand factor exacerbates heart failure through formation of neutrophil extracellular traps
Mang, G., Chen, J., Sun, P., Ma, R., Du, J., Wang, X., Cui, J., Yang, M., Tong, Z., Yan, X., et al. (2024) · European Heart Journal · doi:10.1093/eurheartj/ehae517 · Cited by 48
Negreros, M., & Flores-Suárez, L. F. (2021) · Autoimmunity Reviews · doi:10.1016/j.autrev.2021.102781 · Cited by 48
Seipin Knockout Mice Develop Heart Failure With Preserved Ejection Fraction
Bai, B., Yang, W., Fu, Y., Foon, H. L., Tay, W. T., Yang, K., Luo, C., Gunaratne, J., Lee, P., Zile, M. R., et al. (2019) · JACC Basic to Translational Science · doi:10.1016/j.jacbts.2019.07.008 · Cited by 50
Fert-Bober, J., Murray, C. I., Parker, S. J., & Van Eyk, J. E. (2018) · Circulation Research · doi:10.1161/circresaha.118.310966 · Cited by 45
Bruggen, S. V., & Martinod, K. (2022) · Immunological Reviews · doi:10.1111/imr.13179 · Cited by 47
Self-citationPesce, M., Agostoni, P., Bøtker, H. E., Brundel, B. J. J. M., Davidson, S. M., Caterina, R. D., Ferdinandy, P., Girão, H., Gyöngyösi, M., Hulot, J., et al. (2021) · Cardiovascular Research · doi:10.1093/cvr/cvab201 · Cited by 43
Ichimura, S., Misaka, T., Ogawara, R., Tomita, Y., Anzai, F., Sato, Y., Miura, S., Yokokawa, T., Sato, T., Oikawa, M., et al. (2024) · Circulation Heart Failure · doi:10.1161/circheartfailure.123.011057 · Cited by 50
Leukocyte-Dependent Regulation of Cardiac Fibrosis
Okyere, A. D., & Tilley, D. G. (2020) · Frontiers in Physiology · doi:10.3389/fphys.2020.00301 · Cited by 43
Can we remove scar and fibrosis from adult human myocardium?
Vazir, A., Fox, K. M., Westaby, J. D., Evans, M. J., & Westaby, S. (2018) · European Heart Journal · doi:10.1093/eurheartj/ehy503 · Cited by 41
The virtues and vices of protein citrullination
Christophorou, M. A. (2022) · Royal Society Open Science · doi:10.1098/rsos.220125 · Cited by 41
Eosinophils in fungal diseases: An overview
Figueiredo, R. T., & Neves, J. S. (2018) · Journal of Leukocyte Biology · doi:10.1002/jlb.4mr1117-473r · Cited by 43
The role of NETosis in heart failure
Sawa Kostin, D., Krizanic, F., Kelesidis, T., & Pagonas, N. (2024) · Heart Failure Reviews · doi:10.1007/s10741-024-10421-x · Cited by 43
Identification of a Novel HIF-1α-αMβ2 Integrin-NET Axis in Fibrotic Interstitial Lung Disease
Khawaja, A. A., Chong, D. L. W., Sahota, J., Mikolasch, T., Pericleous, C., Ripoll, V. M., Booth, H., Khan, S., Rodriguez‐Justo, M., Giles, I., et al. (2020) · Frontiers in Immunology · doi:10.3389/fimmu.2020.02190 · Cited by 40
Bai, B., Cheng, M., Jiang, L., Xu, J., Chen, H., & Xu, Y. (2021) · Frontiers in Cardiovascular Medicine · doi:10.3389/fcvm.2021.614757 · Cited by 43
The power from within – understanding the driving forces of neutrophil extracellular trap formation
Neubert, E., Meyer, D., Kruss, S., & Erpenbeck, L. (2020) · Journal of Cell Science · doi:10.1242/jcs.241075 · Cited by 42
Self-citationvan der Linden, M., Kumari, S., Montizaan, D., van Dalen, S. C. M., Kip, A., Foster, M. R., Reinieren-Beeren, I., Neubert, E., Erpenbeck, L., Waaijenberg, K., et al. (2023) · mAbs · doi:10.1080/19420862.2023.2281763 · Cited by 38
Self-citationCRP Induces NETosis in Heart Failure Patients with or without Diabetes
Vulesevic, B., Lavoie, S. B., Neagoe, P., Dumas, E., Räkel, A., White, M., & Sirois, M. G. (2019) · ImmunoHorizons · doi:10.4049/immunohorizons.1900026 · Cited by 38
Benzyl butyl phthalate (BBP) induces lung injury and fibrosis through neutrophil extracellular traps
Wang, W., Liu, Z., Zhang, Y., Wang, L., Meng, D., Li, X., Zhang, J., Wu, Y., Zhou, X., & Liu, G. (2022) · Environmental Pollution · doi:10.1016/j.envpol.2022.119743 · Cited by 37
Neutrophil Extracellular Traps: Inflammation and Biomaterial Preconditioning for Tissue Engineering
Fetz, A. E., & Bowlin, G. L. (2022) · Tissue Engineering Part B: Reviews · doi:10.1089/ten.teb.2021.0013 · Cited by 36
NETosis promotes chronic inflammation and fibrosis in systemic lupus erythematosus and COVID-19
Lin, H., Liu, J., Li, N., Zhang, B., Nguyen, V. D., Yao, P., Feng, J., Liu, Q., Chen, Y. Z., Li, G., et al. (2023) · Clinical Immunology · doi:10.1016/j.clim.2023.109687 · Cited by 35
NLRP3-Induced NETosis: A Potential Therapeutic Target for Ischemic Thrombotic Diseases?
Kumar, R. K., Patil, G., & Dayal, S. (2023) · Cells · doi:10.3390/cells12232709 · Cited by 36
Subclinical Inflammation in Heart Failure: A Neutrophil Perspective
Vulesevic, B., Sirois, M. G., Allen, B. G., de Denus, S., & White, M. (2018) · Canadian Journal of Cardiology · doi:10.1016/j.cjca.2018.01.018 · Cited by 36
Witsch, T., Martinod, K., Sorvillo, N., Portier, I., Meyer, S. F. D., & Wagner, D. D. (2018) · Journal of the American Heart Association · doi:10.1161/jaha.117.007004 · Cited by 35
Self-citationAlflen, A., Lopez, P. A., Hartmann, A., Maxeiner, J., Bosmann, M., Sharma, A., Platten, J., Ries, F., Beckert, H., Ruf, W., et al. (2019) · Immunobiology · doi:10.1016/j.imbio.2019.11.002 · Cited by 35
Magnadóttir, B., Hayes, P. M., Gísladóttir, B., Bragason, B. Þ., Hristova, M., Nicholas, A. P., Guðmundsdóttir, S., & Lange, S. (2018) · Developmental & Comparative Immunology · doi:10.1016/j.dci.2018.05.014 · Cited by 34
NADPH Oxidase Inhibition in Fibrotic Pathologies
Bernard, K. F., & Thannickal, V. J. (2020) · Antioxidants and Redox Signaling · doi:10.1089/ars.2020.8032 · Cited by 34
Dragoni, G., Hertogh, G. D., & Vermeire, S. (2020) · Inflammatory Bowel Diseases · doi:10.1093/ibd/izaa095 · Cited by 33
Externalized histones fuel pulmonary fibrosis via a platelet-macrophage circuit of TGFβ1 and IL-27
Riehl, D., Sharma, A., Roewe, J., Murke, F., Ruppert, C., Eming, S. A., Bopp, T., Kleinert, H., Radsak, M. P., Colucci, G., et al. (2023) · Proceedings of the National Academy of Sciences · doi:10.1073/pnas.2215421120 · Cited by 34
Ngo, A. T. P., & Gollomp, K. L. (2022) · Research and Practice in Thrombosis and Haemostasis · doi:10.1002/rth2.12808 · Cited by 34
Nets in fibrosis: Bridging innate immunity and tissue remodeling
Ma, X., Ji-pin, L., Li, M., Qi, G., Wei, L., & Zhang, D. (2024) · International Immunopharmacology · doi:10.1016/j.intimp.2024.112516 · Cited by 32
Shamagian, L. G., Rogers, R. G., Luther, K. M., Angert, D., Echavez, A. K., Liu, W., Middleton, R., Antes, T. J., Valle, J., Fourier, M., et al. (2023) · Scientific Reports · doi:10.1038/s41598-023-39370-5 · Cited by 34
Hiroki, C. H., Hassanabad, M. F., Defaye, M., Sarden, N., Bartlett, A., Farias, R., Nguyen, A., Guerrero-Fonseca, I. M., Yoon, G., Brown, L., et al. (2025) · Immunity · doi:10.1016/j.immuni.2025.05.002 · Cited by 31
The role of platelets in thrombus fibrosis and vessel wall remodeling after venous thrombosis
DeRoo, E., Martinod, K., Cherpokova, D., Fuchs, T., Cifuni, S. M., Chu, L., Staudinger, C., & Wagner, D. D. (2020) · Journal of Thrombosis and Haemostasis · doi:10.1111/jth.15134 · Cited by 31
Self-citationNeutrophil and Eosinophil DNA Extracellular Trap Formation: Lessons From Pathogenic Fungi
Silva, J. C., Thompson‐Souza, G. A., Barroso, M. V., Neves, J. S., & Figueiredo, R. T. (2021) · Frontiers in Microbiology · doi:10.3389/fmicb.2021.634043 · Cited by 31
Kumar, R., Sonkar, V. K., Swamy, J., Ahmed, A., Sharathkumar, A. A., Pierce, G. L., & Dayal, S. (2022) · Journal of the American Heart Association · doi:10.1161/jaha.121.021188 · Cited by 32
Rabadi, M. M., Kim, M., Li, H., Han, S. J., Choi, Y., D’Agati, V. D., & Lee, H. T. (2017) · American Journal of Physiology-Renal Physiology · doi:10.1152/ajprenal.00364.2017 · Cited by 30
Recent advances in the role of neutrophils and neutrophil extracellular traps in acute pancreatitis
Ishqi, H. M., Ali, M., & Dawra, R. K. (2023) · Clinical and Experimental Medicine · doi:10.1007/s10238-023-01180-4 · Cited by 30
Bruggen, S. V., Kraisin, S., Wauwe, J. V., Bomhals, K., Stroobants, M., Carai, P., Frederix, L., Bruaene, A. V. D., Witsch, T., & Martinod, K. (2023) · Philosophical Transactions of the Royal Society B Biological Sciences · doi:10.1098/rstb.2022.0475 · Cited by 28
Self-citationJia, H., Yue, G., Li, P., Peng, R., Jin, R., Chen, Y., Cao, H., Yang, K., Zhang, X., Yi, X., et al. (2025) · Protein & Cell · doi:10.1093/procel/pwaf020 · Cited by 31
Metadata
- Authors
- Martinod, K., Witsch, T., Erpenbeck, L., Savchenko, A., Hayashi, H., Cherpokova, D., Gallant, M., Mauler, M., Cifuni, S. M., & Wagner, D. D.
- Affiliations
- Boston Children's Hospital (US)
- University of Freiburg (DE)
- Corresponding author
- Wagner, Denisa D.
- ORCID
- Venue
- Journal of Experimental Medicine
- Publisher
- Rockefeller University Press
- Published
- 2016-12-28
- Volume
- 214
- Issue
- 2
- Pages
- 439-458
- ISSN
- 0022-1007 (ISSN-L)
- 1540-9538
- PMC
- PMC5294849
- OpenAlex
- W2562661149
- Cited by
- 218
- References
- 91
- Citations by year
- 2026: 14 · 2025: 23 · 2024: 36 · 2023: 28 · 2022: 20 · 2021: 25 · 2020: 22 · 2019: 21 · 2018: 19 · 2017: 10
- FWCI
- 10.11
- Type
- journal article
- Language
- en
- Open access
- hybrid
- doi.org
- Licence
- Locations
- The Journal of Experimental Medicine (publishedVersion, cc-by-nc-sa)
- PubMed Central (publishedVersion, cc-by-nc-sa)
- PubMed (publishedVersion)
- Digital Access to Scholarship at Harvard (DASH) (Harvard University) (submittedVersion, cc-by)
- GRO (submittedVersion)
- Funders
- National Heart, Lung, and Blood Institute (R01HL102101, R01HL125501, 5T32HL066987-13)
- Boston Children’s Hospital
- Deutsche Forschungsgemeinschaft (CH 1734/1-1)
- Topics
- Life Sciences › Immunology and Microbiology › Immunology › Neutrophil, Myeloperoxidase and Oxidative Mechanisms
- Health Sciences › Medicine › Cardiology and Cardiovascular Medicine › Cardiac Fibrosis and Remodeling
- Health Sciences › Medicine › Pulmonary and Respiratory Medicine › Interstitial Lung Diseases and Idiopathic Pulmonary Fibrosis
- Keywords
- PAD4, neutrophil extracellular traps, NETosis, myocardial fibrosis, pulmonary fibrosis, aging, inflammation, DNase1, platelet recruitment, pressure overload, collagen deposition, cardiac function
- MeSH terms
- Protein-Arginine Deiminase Type 4, Age Factors, Animals, Collagen, Fibrosis, Hydrolases, Mice, Inbred C57BL, Myocardium, Pulmonary Fibrosis, Ventricular Function, Left, Reactive Oxygen Species, Mice, Extracellular Traps
About these checks
Registry, retraction, Cites and statistics results are computed, not judged, with one exception: a printed reference that no index lists is read once by a model before it counts as a citation error. Claims are extracted by a model and kept only when their quote appears verbatim in the text; each cited source is then checked, with a model’s help, for whether it says what the claim relies on. Those verdicts can be wrong — read the claim’s quote and the cited source before relying on one.
Statistics and arithmetic are recomputed, not judged.
Confidence bands are shown only for fields calibrated on our annotated test set. None is calibrated yet, so no band is shown.
What counts as a claim ›How we measure confidence ›How we check this ›
Are you an author, or do you see a problem with this page? Request a review
