

The DOI matches its Crossref record; 41 of the 42 references it cites were found in a registry or an index.
Selective inhibition of low-affinity memory CD8(+) T cells by corticosteroids
Open accessAbstract
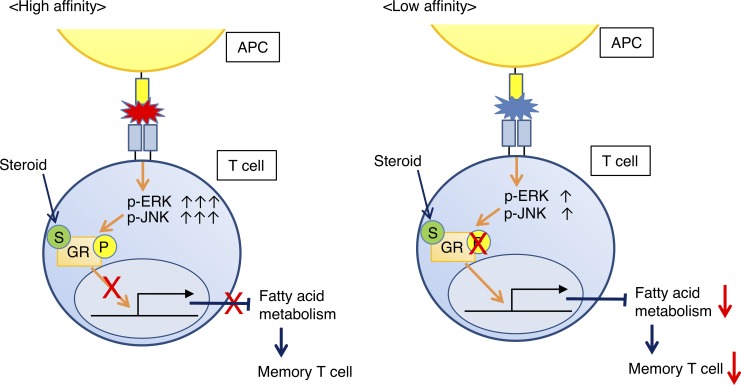
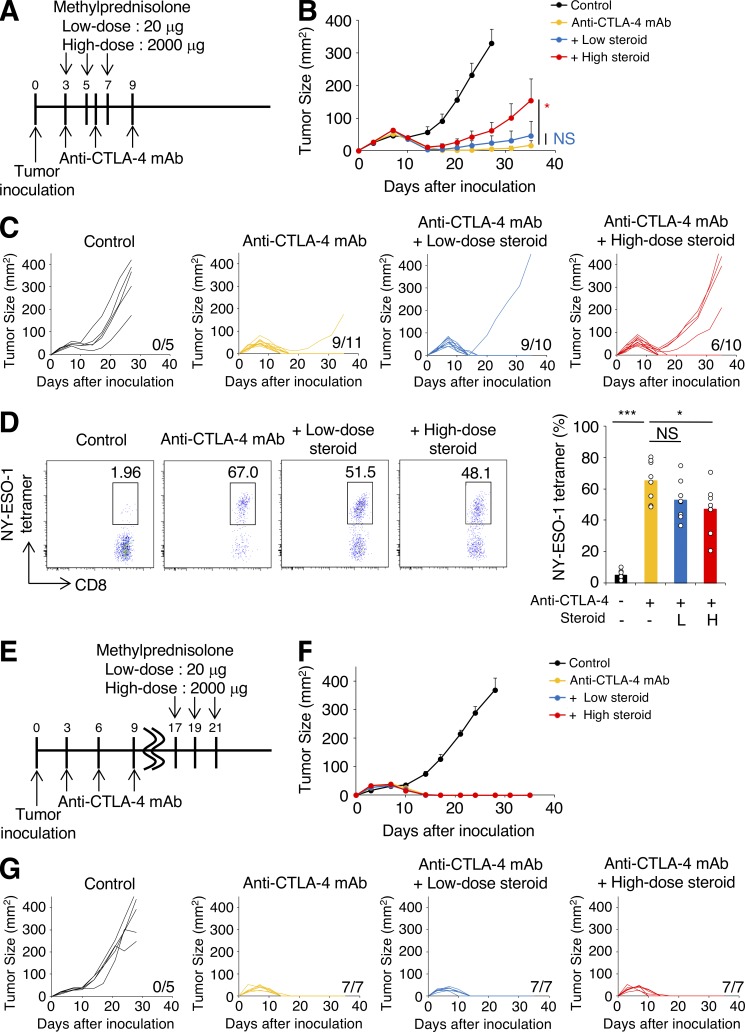
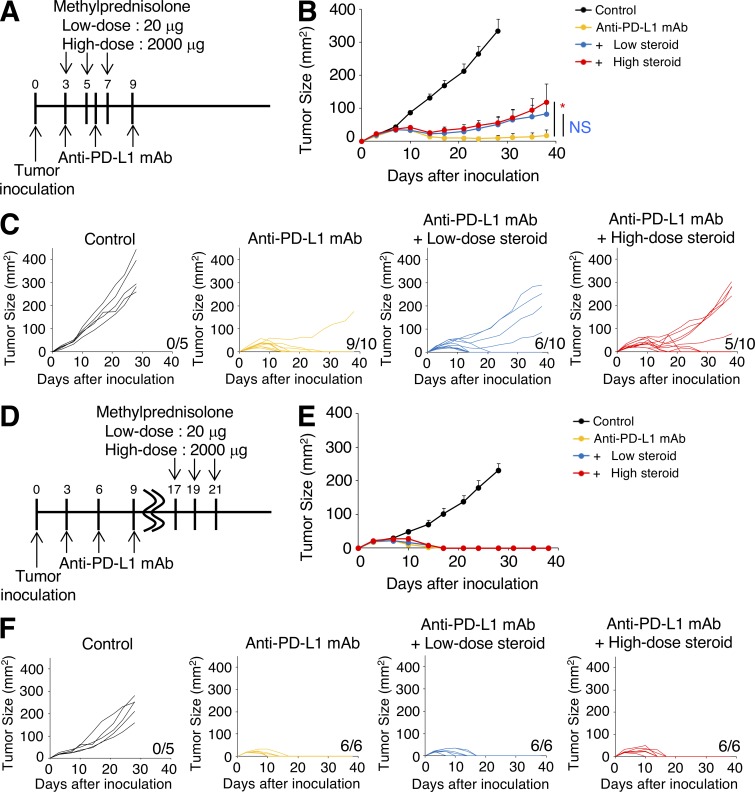
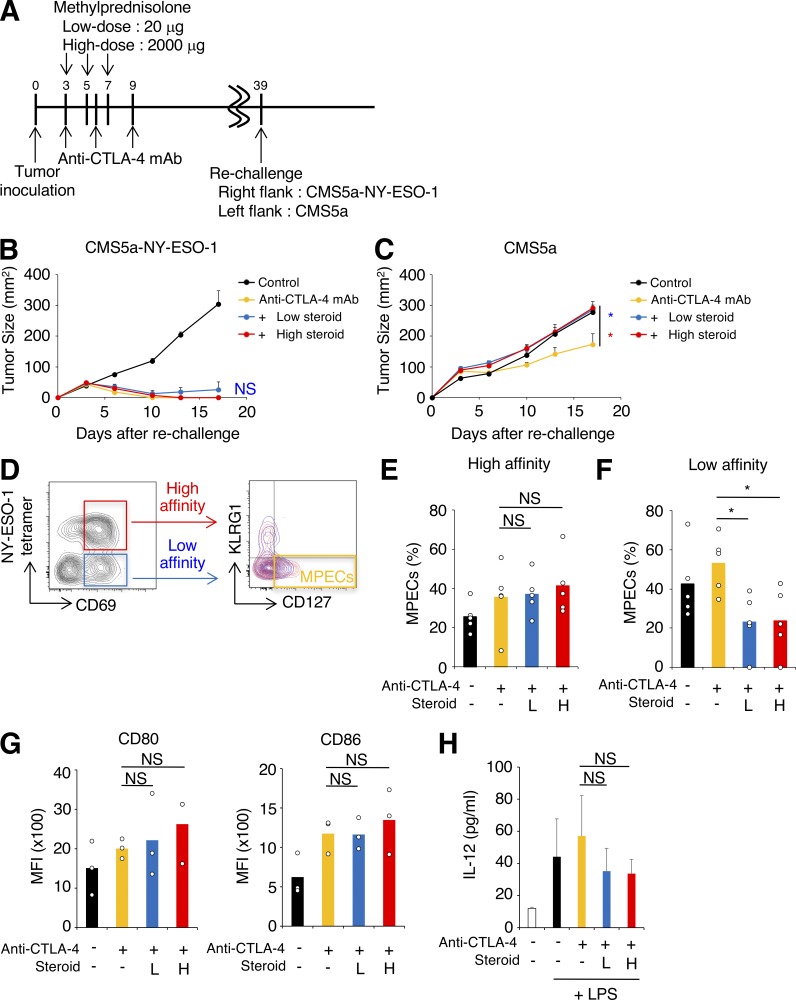
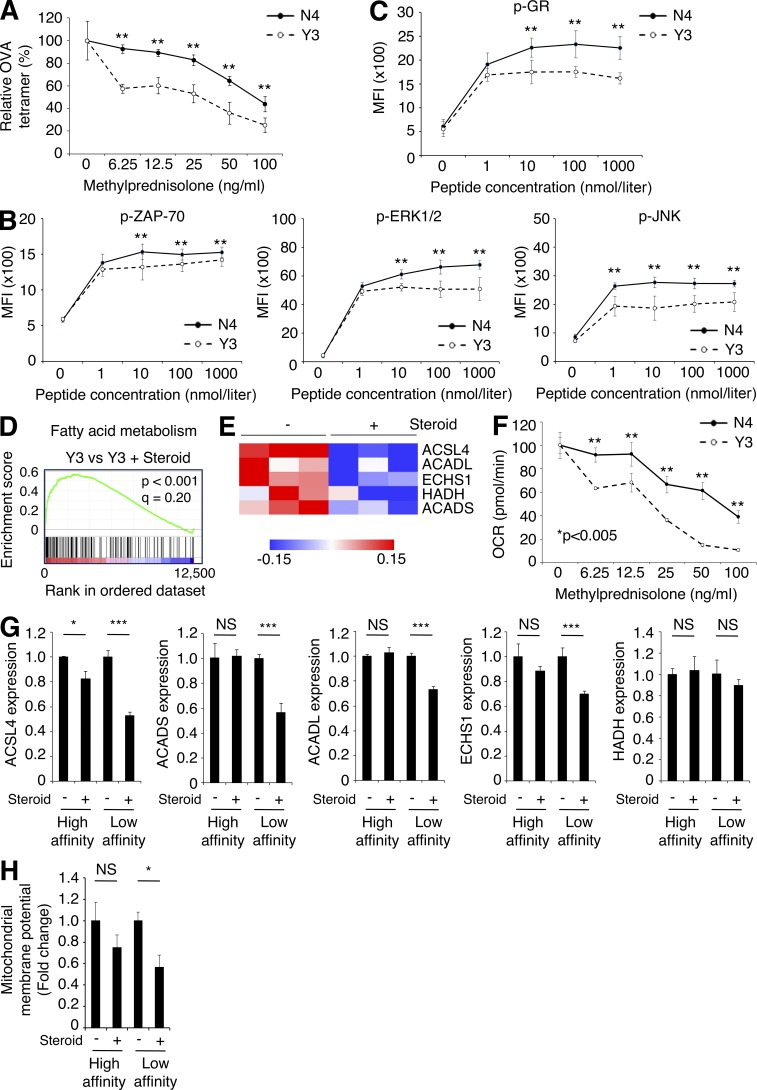
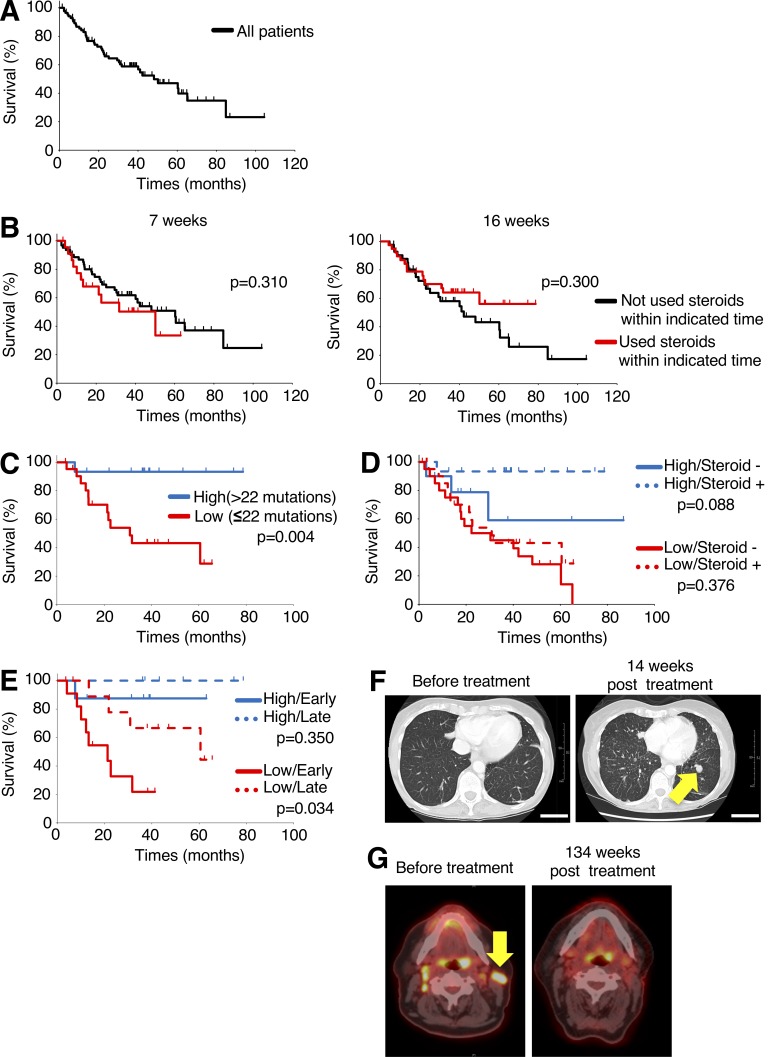
Patients treated with immune checkpoint blockade (ICB) sometimes experience immune-related adverse events (irAEs), requiring immuno-suppressive drugs such as corticosteroids despite the possibility that immunosuppression may impair the antitumor effects of ICB. Here, we address the dilemma of using corticosteroids for the treatment of irAEs induced by ICB. ICB augments neoantigen-specific CD8+ T cell responses, resulting in tumor regression. In our model, simultaneous, but not late, administration of corticosteroids impaired antitumor responses with reduction of CD8+ T cell proliferation. Secondary challenge using tumors with/without the neoantigen showed selective progression in tumors lacking the neoantigen when corticosteroids were administered. Corticosteroids decreased low- but not high-affinity memory T cells by suppressing fatty acid metabolism essential for memory T cells. In a small cohort of human melanoma patients, overall survival was shorter after treatment with CTLA-4 blockade in patients who received early corticosteroids or had low tumor mutation burden. Together, low-affinity memory T cells are dominantly suppressed by corticosteroids, necessitating careful and thoughtful corticosteroid use.
Overview
The claims and statistics of this paper haven’t been checked yet.
Run the check — free, no account needed. It reads the open-access text and checks the sources it cites.
Integrity signals
Registry
Cites
Statistics
Figures
Verification
Claims the paper makes
The claims and statistics of this paper haven’t been checked yet.
Run the check — free, no account needed. It reads the open-access text and checks the sources it cites.
Claims other papers make about this one
Each is checked against this paper’s own text: does it say what the citing paper says it does?
In the citing paper
“Recently, it was reported in a mouse model that early CS treatment reduces antitumor activity of anti-PD-1 and anti-CTLA-4 monoclonal antibody (mAb) in a dose-dependent fashion.41”
From Autoimmune diseases and immune-checkpoint inhibitors for cancer therapy: Review of the literature and personalized risk-based prevention strategy (2020) · cites this paper as [41]
Self-check
Percentages, sums and reported differences re-computed from the paper’s own numbers.
The self-check needs the paper’s full text.
Citations
Cites
Improved Survival with Ipilimumab in Patients with Metastatic Melanoma
Hodi, F. S., O'Day, S. J., McDermott, D. F., Weber, R. W., Sosman, J. A., Haanen, J. B., Gonzalez, R., Robert, C., Schadendorf, D., Hassel, J. C., et al. (2010) · New England Journal of Medicine · doi:10.1056/nejmoa1003466 · Cited by 15,155
Overall Survival with Combined Nivolumab and Ipilimumab in Advanced Melanoma
Wolchok, J. D., Chiarion-Sileni, V., Gonzalez, R., Rutkowski, P., Grob, J.-J., Cowey, C. L., Lao, C. D., Wagstaff, J., Schadendorf, D., Ferrucci, P. F., et al. (2017) · New England Journal of Medicine · doi:10.1056/nejmoa1709684 · Cited by 5,357 · cited 1×
“Deeper insight into these mechanisms could improve irAE management with cortico-steroids, especially as new immunotherapy agents and combinations emerge in the clinic that have the potential additional or novel irAEs (Wolchok et al., 2017).”
Elements of cancer immunity and the cancer–immune set point
Chen, D. S., & Mellman, I. (2017) · Nature · doi:10.1038/nature21349 · Cited by 5,352
Freeman, G. J., Long, A. J., Iwai, Y., Bourque, K., Chernova, T., Nishimura, H., Fitz, L. J., Malenkovich, N., Okazaki, T., Byrne, M. C., et al. (2000) · The Journal of Experimental Medicine · doi:10.1084/jem.192.7.1027 · Cited by 5,294
Molecular and cellular insights into T cell exhaustion
Wherry, E. J., & Kurachi, M. (2015) · Nature Reviews Immunology · doi:10.1038/nri3862 · Cited by 4,652
Enhancement of Antitumor Immunity by CTLA-4 Blockade
Leach, D. R., Krummel, M. F., & Allison, J. P. (1996) · Science · doi:10.1126/science.271.5256.1734 · Cited by 3,955
Batf3 Deficiency Reveals a Critical Role for CD8α + Dendritic Cells in Cytotoxic T Cell Immunity
Hildner, K., Edelson, B. T., Purtha, W. E., Diamond, M., Matsushita, H., Kohyama, M., Calderon, B., Schraml, B. U., Unanue, E. R., Diamond, M. S., et al. (2008) · Science · doi:10.1126/science.1164206 · Cited by 2,081
Joshi, N. S., Cui, W., Chandele, A., Lee, H. K., Urso, D. R., Hagman, J., Gapin, L., & Kaech, S. M. (2007) · Immunity · doi:10.1016/j.immuni.2007.07.010 · Cited by 1,861
T cell costimulatory receptor CD28 is a primary target for PD-1–mediated inhibition
Hui, E., Cheung, J., Zhu, J., Su, X., Taylor, M. J., Wallweber, H. A., Sasmal, D. K., Huang, J., Kim, J. M., Mellman, I., et al. (2017) · Science · doi:10.1126/science.aaf1292 · Cited by 1,689
Enhancing CD8 T-cell memory by modulating fatty acid metabolism
Pearce, E. L., Walsh, M. C., Cejas, P. J., Harms, G. M., Shen, H., Wang, L.-S., Jones, R. G., & Choi, Y. (2009) · Nature · doi:10.1038/nature08097 · Cited by 1,559
Research works printed but not linked: 1
- Griswold, 1975, A colon tumor model for anticancer agent evaluation, Cancer., 36, 2441
Cited by
Sorted by citations
Items 101–124 of 124
Acharya, N., Madi, A., Zhang, H., Klapholz, M., Christian, E., Dixon, K. O., Fell, G. G., Tooley, K., Mangani, D., Xia, J., et al. (2019) · bioRxiv (Cold Spring Harbor Laboratory) · doi:10.1101/799759 · Cited by 2
Suzuki, K., Yokokawa, T., Kawaguchi, T., Takada, S., Tamaki, S., Kawasaki, Y., Yamaguchi, T., Koizumi, K., Matsumoto, T., Sakata, Y., et al. (2024) · Scientific Reports · doi:10.1038/s41598-024-79781-6 · Cited by 1
Kashihara, T., Nakayama, Y., Okuma, K., Nagao, A., Takahashi, K., Kaneda, T., Kubo, Y., Ito, K., Nakamura, S., Okamoto, H., et al. (2025) · Radiation Oncology · doi:10.1186/s13014-025-02733-5 · Cited by 1
Huang, N., & Guan, Y. (2026) · Frontiers in Nutrition · doi:10.3389/fnut.2025.1753660 · Cited by 1
Zhao, Y. X., Guo, Z., Zhang, J. Z., & Zhang, Z. (2026) · Frontiers in Oncology · doi:10.3389/fonc.2026.1728852 · Cited by 1
Tsuji, D., Nakagaki, S., Yonezawa, I., Suzuki, K., Yokokawa, T., Kawasaki, Y., Yamaguchi, T., Kawaguchi, T., Hatori, M., Matsumoto, T., et al. (2023) · Investigational New Drugs · doi:10.1007/s10637-023-01414-y · Cited by 1
Hatori, M., Fukuoka, S., Kimura, S., Kawakami, K., Yamaguchi, K., & Yamaguchi, M. (2024) · Oncology · doi:10.1159/000543026 · Cited by 1
Hatakeyama, S., & Οhyama, C. (2020) · IJU Case Reports · doi:10.1002/iju5.12193
Kostine, M., & Tison, A. (2021) · Springer eBooks · doi:10.1007/978-3-030-56824-5_13
Eliminating Budgeting - Fictions In The Real World
Mainelli, M. R. (2006)
Béal, C., & Derolez, S. (2021) · Revue du Rhumatisme · doi:10.1016/s1169-8330(21)00109-5
Glucocorticoid signaling mediates CD8+ T cell memory differentiationPreprint
Tehseen, A., Kumar, D., Sarkar, R., Singh, S., Dubey, A., & Sehrawat, S. (2022) · bioRxiv · doi:10.1101/2022.07.19.500581 · Cited by 1
Popović, A., Petković, I., Rančić, A., Dimitrijević, A., Brzački, V., Stankov, S. D., Jović, A., & Stojanovic, S. K. (2022) · AFMN Biomedicine · doi:10.5937/afmnai40-40566
Poiret, T., Vikberg, S., Schoutrop, E., Mattsson, J., & Magalhaes, I. (2024) · Figshare · doi:10.6084/m9.figshare.25397536
Poiret, T., Vikberg, S., Schoutrop, E., Mattsson, J., & Magalhaes, I. (2024) · Figshare · doi:10.6084/m9.figshare.25397725
Selective Glucocorticoid Receptor Modulators of Immune Checkpoint FunctionPreprint
Kobylski, R. R., Min, C. K., Nwachukwu, J. C., Koenig, M., Zhang, H., Moncada, L., Venables, T., Schell, B.-B., Stein, W. J., McCown, C., et al. (2026) · bioRxiv (Cold Spring Harbor Laboratory) · doi:10.64898/2026.02.02.703046
Ruggiu, M. (2023) · theses.fr (ABES) · doi:10.70675/de84e089z4e46z475dz8d12z25950ab6f427
Chronic and emerging immune-related adverse events from immune checkpoint inhibitors
Frey, C. (2026) · Disease and Therapeutics · doi:10.1016/j.dist.2026.100011
Liang, W., He, S., Tao, H., Lv, Y., Chen, X., & Peng, L. (2026) · Journal of Agricultural and Food Chemistry · doi:10.1021/acs.jafc.5c15493
Unconventional guardians of the brain: MAIT cells as emerging players in glioblastoma immunity
Eddy, E. M., Patton, T., Barrow, A. D., & Corbett, A. J. (2026) · Frontiers in Immunology · doi:10.3389/fimmu.2026.1896626
Bartalini, L., Rimini, M., Ikeda, M., Abidoye, O., Lucchetti, J., Antonuzzo, L., Kim, J. W., Vogel, A., Lamarca, Á., Nichetti, F., et al. (2026) · Cancers · doi:10.3390/cancers18182921
Development of an experimental mouse model of immune checkpoint inhibitor-related myocarditis
Unten, H., Niimura, T., Hamano, H., Goda, M., Kanamori, M., Kawata, E., Horikawa, I., Aizawa, F., Yagi, K., Kawada, K., et al. (2026) · Journal of Pharmacology and Experimental Therapeutics · doi:10.1016/j.jpet.2026.105050
Metadata
- Authors
- Tokunaga, A., Sugiyama, D., Maeda, Y., Warner, A. B., Panageas, K. S., Ito, S., Togashi, Y., Sakai, C., Wolchok, J. D., & Nishikawa, H.
- Affiliations
- Kyowa Kirin (Japan) (JP)
- Nagoya University (JP)
- National Cancer Centre Japan (JP)
- Memorial Sloan Kettering Cancer Center (US)
- Corresponding author
- Nishikawa, Hiroyoshi
- ORCID
- Venue
- Journal of Experimental Medicine
- Publisher
- Rockefeller University Press
- Published
- 2019-09-19
- Volume
- 216
- Issue
- 12
- Pages
- 2701-2713
- ISSN
- 0022-1007 (ISSN-L)
- 1540-9538
- PMC
- PMC6888983
- OpenAlex
- W2974799401
- Cited by
- 124
- References
- 42
- Citations by year
- 2026: 14 · 2025: 11 · 2024: 23 · 2023: 19 · 2022: 16 · 2021: 21 · 2020: 17 · 2019: 2
- FWCI
- 5.85
- Type
- journal article
- Language
- en
- Open access
- hybrid
- doi.org
- Licence
- Locations
- The Journal of Experimental Medicine (publishedVersion, cc-by-nc-sa)
- PubMed Central (publishedVersion, cc-by-nc-sa)
- PubMed (publishedVersion)
- Funders
- Ministry of Education, Culture, Sports, Science and Technology (17H06162, 16K15551)
- National Cancer Center Research and Development Fund (28-A-7, 31-A-7)
- Naito Foundation
- National Institutes of Health
- National Cancer Institute (P30 CA008748)
- Conquer Cancer Foundation
- American Society of Clinical Oncology
- Topics
- Health Sciences › Medicine › Oncology › Cancer Immunotherapy and Biomarkers
- Life Sciences › Immunology and Microbiology › Immunology › T-cell and B-cell Immunology
- Life Sciences › Immunology and Microbiology › Immunology › Immunotherapy and Immune Responses
- Keywords
- corticosteroids, immune checkpoint blockade, immune-related adverse events, CD8+ T cells, memory T cells, fatty acid metabolism, CTLA-4 blockade, melanoma, tumor mutational burden, neoantigens, antitumor immunity, immunosuppression
- MeSH terms
- Adrenal Cortex Hormones, Animals, Cell Differentiation, Disease Models, Animal, Dose-Response Relationship, Drug, Female, Humans, Immunologic Memory, Immunosuppressive Agents, Lymphocyte Activation, Melanoma, Mutation, Receptors, Steroid, Biomarkers, T-Lymphocyte Subsets, CD8-Positive T-Lymphocytes, Cell Line, Tumor, Mice, CTLA-4 Antigen, Programmed Cell Death 1 Receptor
About these checks
Registry, retraction, Cites and statistics results are computed, not judged, with one exception: a printed reference that no index lists is read once by a model before it counts as a citation error. Claims are extracted by a model and kept only when their quote appears verbatim in the text; each cited source is then checked, with a model’s help, for whether it says what the claim relies on. Those verdicts can be wrong — read the claim’s quote and the cited source before relying on one.
Statistics and arithmetic are recomputed, not judged.
Confidence bands are shown only for fields calibrated on our annotated test set. None is calibrated yet, so no band is shown.
What counts as a claim ›How we measure confidence ›How we check this ›
Are you an author, or do you see a problem with this page? Request a review
