

The DOI matches its Crossref record; 117 of the 120 references it cites were found in a registry or an index, and 2 are not checked yet.
Interpretation and visualization techniques for deep learning models in medical imaging
Open accessAbstract
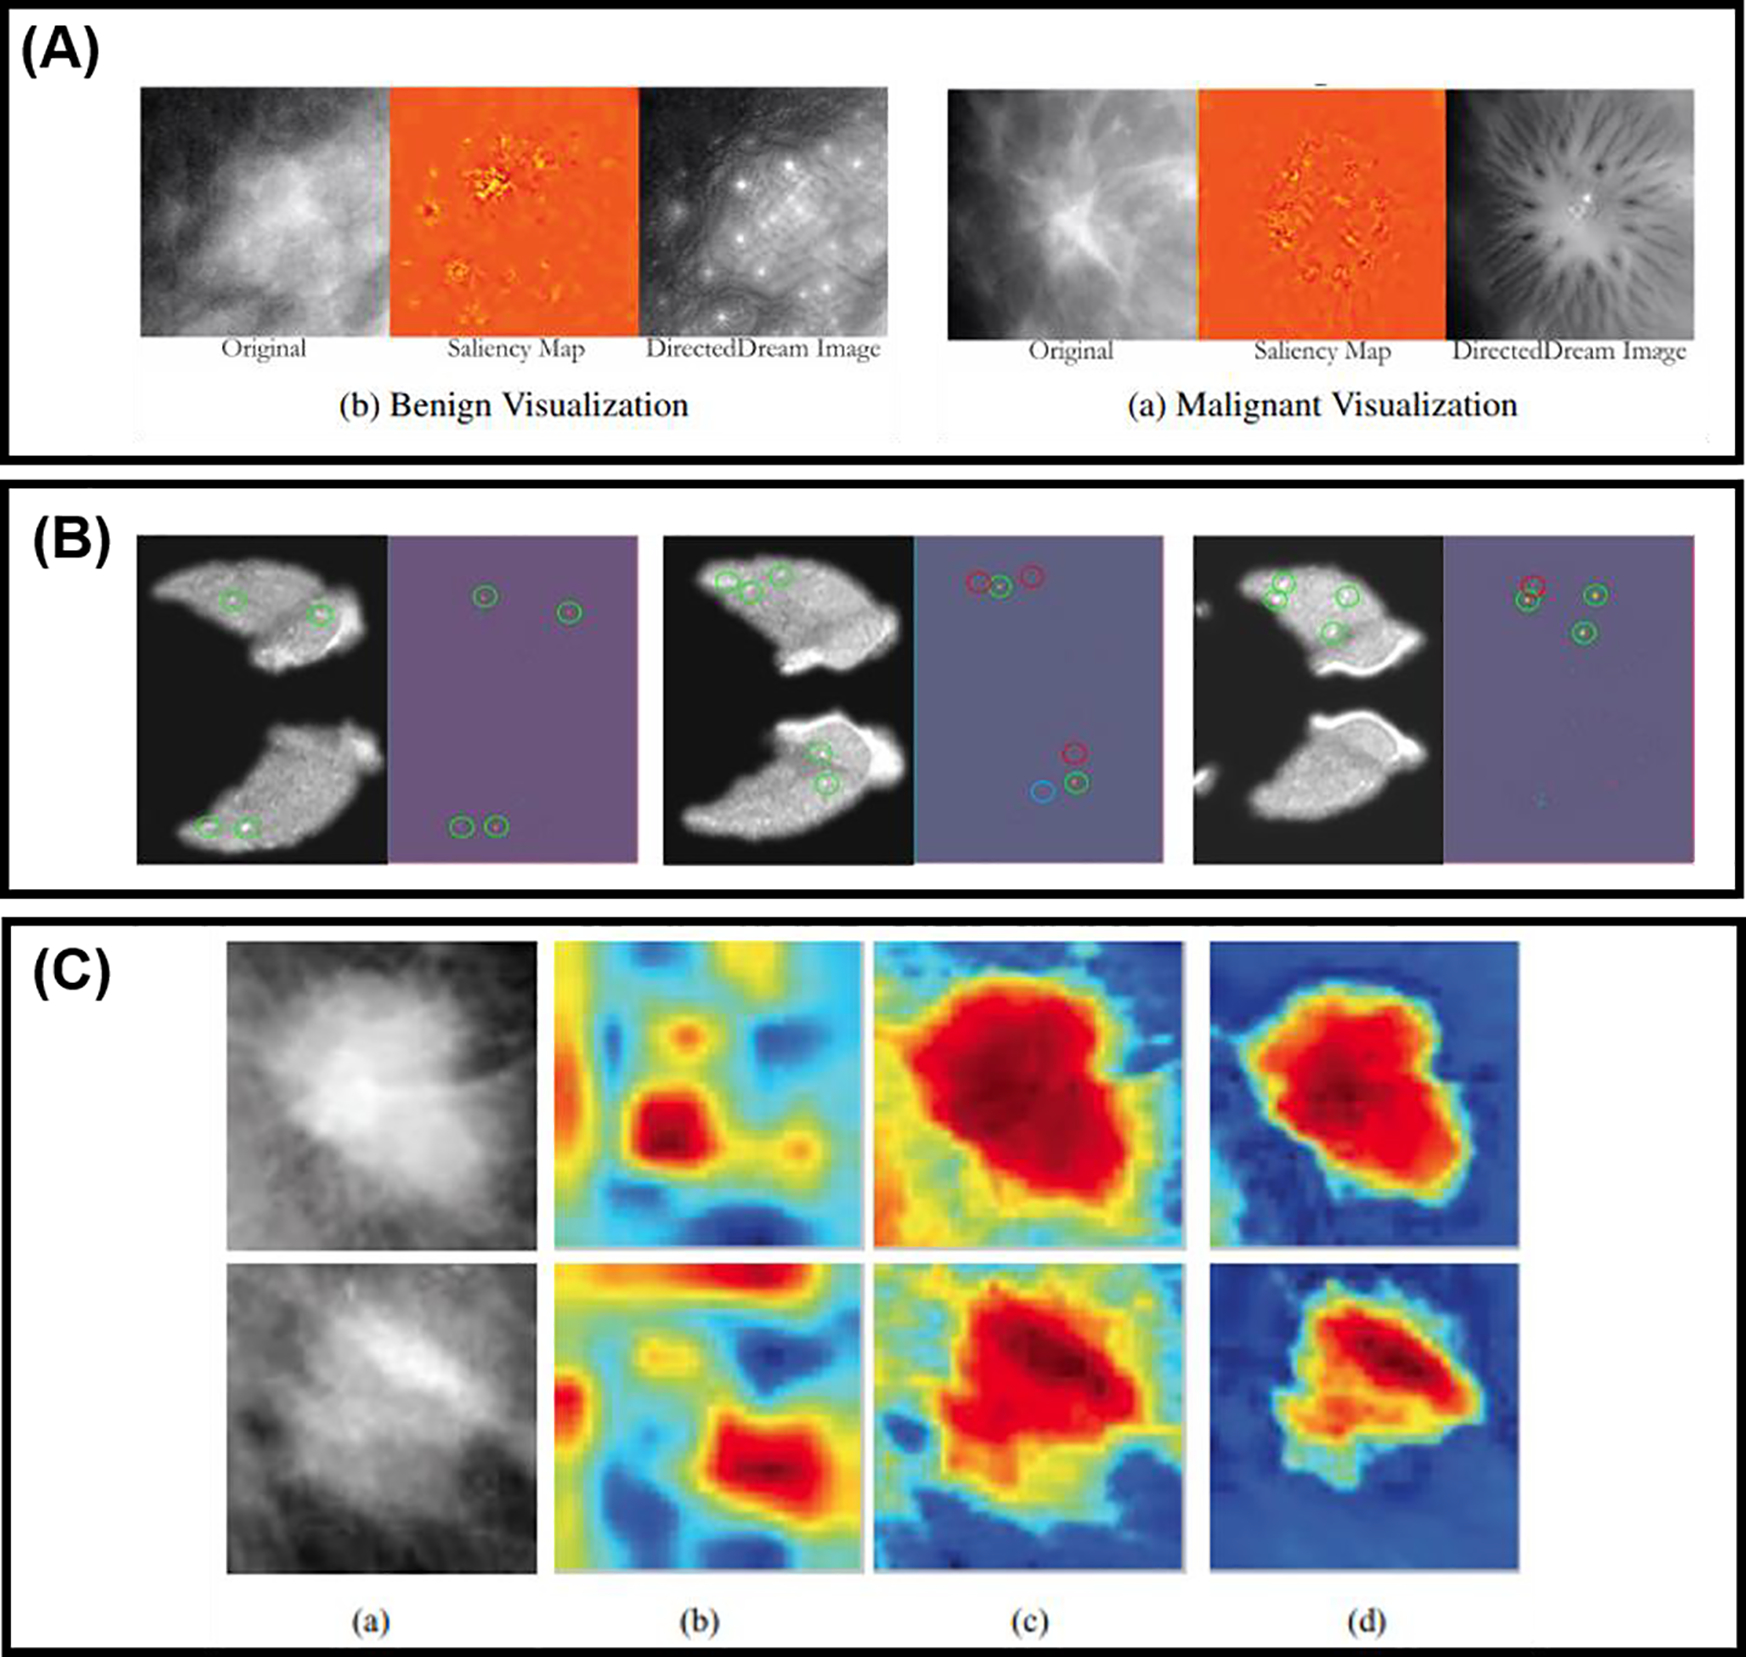
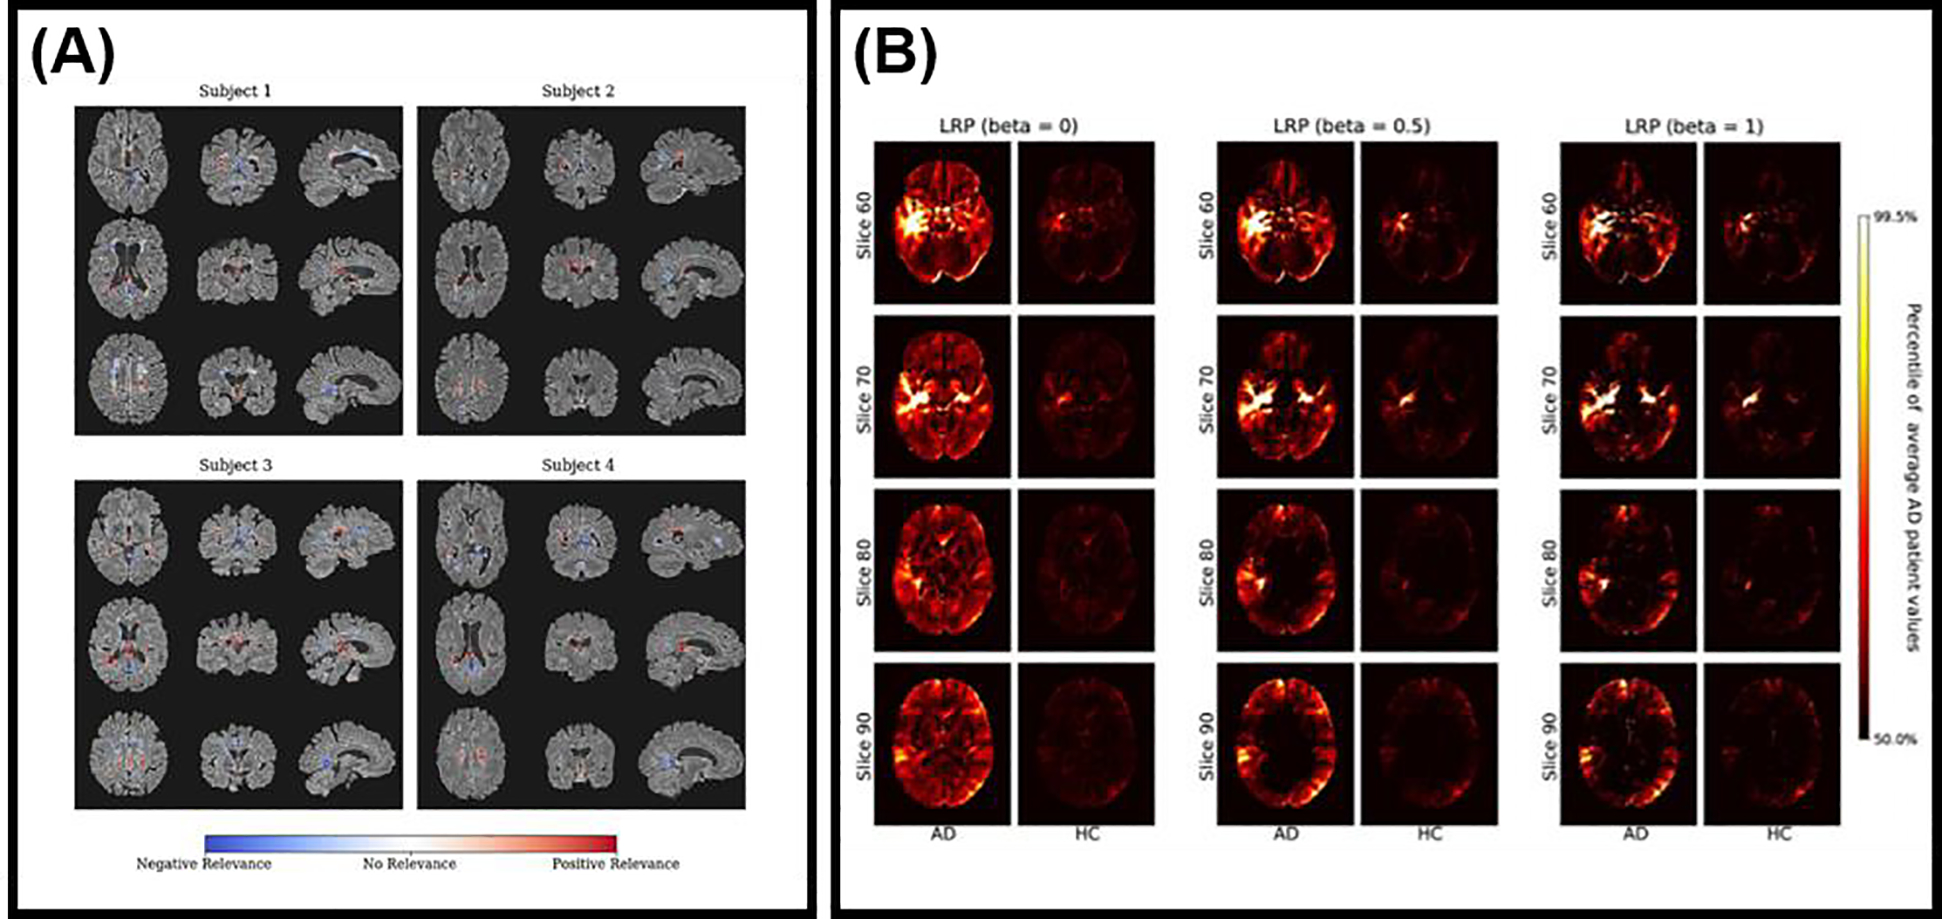
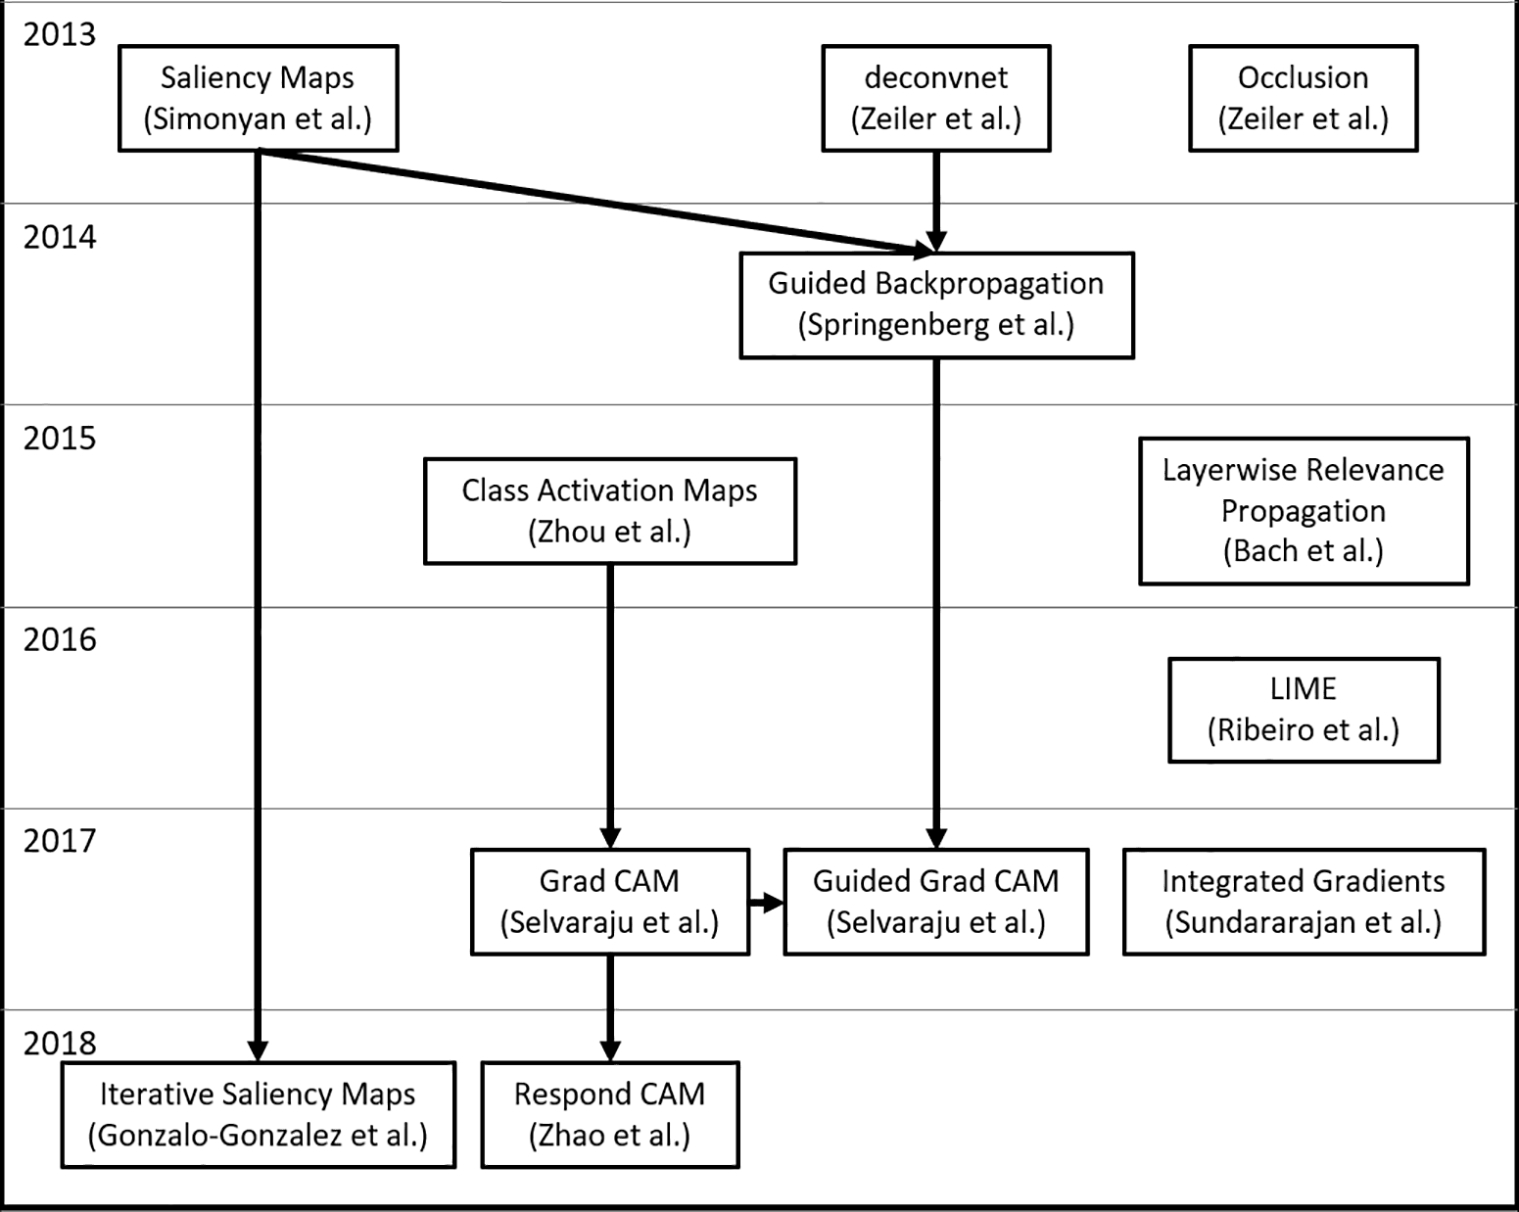
Deep learning (DL) approaches to medical image analysis tasks have recently become popular; however, they suffer from a lack of human interpretability critical for both increasing understanding of the methods’ operation and enabling clinical translation. This review summarizes currently available methods for performing image model interpretation and critically evaluates published uses of these methods for medical imaging applications. We divide model interpretation in two categories: (1) understanding model structure and function and (2) understanding model output. Understanding model structure and function summarizes ways to inspect the learned features of the model and how those features act on an image. We discuss techniques for reducing the dimensionality of high-dimensional data and cover autoencoders, both of which can also be leveraged for model interpretation. Understanding model output covers attribution-based methods, such as saliency maps and class activation maps, which produce heatmaps describing the importance of different parts of an image to the model prediction. We describe the mathematics behind these methods, give examples of their use in medical imaging, and compare them against one another. We summarize several published toolkits for model interpretation specific to medical imaging applications, cover limitations of current model interpretation methods, provide recommendations for DL practitioners looking to incorporate model interpretation into their task, and offer general discussion on the importance of model interpretation in medical imaging contexts.
Overview
The claims and statistics of this paper haven’t been checked yet.
Free: it reads the open-access text and checks the first 5 claims that cite a source we can check. Create a free account to check every claim.
Integrity signals
Registry
Cites
Statistics
Figures

Verification
Claims the paper makes
The claims and statistics of this paper haven’t been checked yet.
Free: it reads the open-access text and checks the first 5 claims that cite a source we can check. Create a free account to check every claim.
Claims other papers make about this one
Each is checked against this paper’s own text: does it say what the citing paper says it does?
The cited source says what the claim attributes to it.
In the citing paper
“This survey adds to the review of Huff et al. (2021), since they mostly focused on examples of visual explanation, while our survey aims for a more holistic approach including non-visual explanation, critiques on XAI, and methods for evaluating XAI.”
From Explainable artificial intelligence (XAI) in deep learning-based medical image analysis (2022) · cites this paper as Huff et al. (2021)
Self-check
Percentages, sums and reported differences re-computed from the paper’s own numbers.
The self-check needs the paper’s full text.
Citations
Cites
Deep Residual Learning for Image Recognition
He, K., Zhang, X., Ren, S., & Sun, J. (2016) · 2016 IEEE Conference on Computer Vision and Pattern Recognition (CVPR) · doi:10.1109/cvpr.2016.90 · Cited by 235,474
ImageNet: A large-scale hierarchical image database
Deng, J., Dong, W., Socher, R., Li, L.-J., Li, K., & Fei-Fei, L. (2009) · 2009 IEEE Conference on Computer Vision and Pattern Recognition · doi:10.1109/cvpr.2009.5206848 · Cited by 65,333
(2008) · Journal of Machine Learning Research · Cited by 33,051
Grad-CAM: Visual Explanations from Deep Networks via Gradient-Based Localization
Selvaraju, R. R., Cogswell, M., Das, A., Vedantam, R., Parikh, D., & Batra, D. (2017) · 2017 IEEE International Conference on Computer Vision (ICCV) · doi:10.1109/iccv.2017.74 · Cited by 24,513
Delving Deep into Rectifiers: Surpassing Human-Level Performance on ImageNet Classification
He, K., Zhang, X., Ren, S., & Sun, J. (2015) · 2015 IEEE International Conference on Computer Vision (ICCV) · doi:10.1109/iccv.2015.123 · Cited by 19,741
Visualizing and understanding convolutional networks
Zeiler, M. D., & Fergus, R. (2014) · Lecture Notes in Computer Science · doi:10.1007/978-3-319-10590-1_53 · Cited by 15,839
A survey on deep learning in medical image analysis
Litjens, G., Kooi, T., Bejnordi, B. E., Setio, A. A. A., Ciompi, F., Ghafoorian, M., van der Laak, J. A. W. M., van Ginneken, B., & Sánchez, C. I. (2017) · Medical Image Analysis · doi:10.1016/j.media.2017.07.005 · Cited by 15,332
(2010) · Cited by 14,134
A survey on Image Data Augmentation for Deep Learning
Shorten, C., & Khoshgoftaar, T. M. (2019) · Journal of Big Data · doi:10.1186/s40537-019-0197-0 · Cited by 13,203
(2016) · Cited by 11,679
Cited by
Explainable artificial intelligence (XAI) in deep learning-based medical image analysis
van der Velden, B. H. M., Kuijf, H. J., Gilhuijs, K. G. A., & Viergever, M. A. (2022) · Medical Image Analysis · doi:10.1016/j.media.2022.102470 · Cited by 1,328
ŞAHiN, E., Arslan, N. N., & Özdemir, D. (2025) · Neural Computing and Applications · doi:10.1007/s00521-024-10437-2 · Cited by 278
Bhati, D., Neha, F., & Amiruzzaman, M. (2024) · Journal of Imaging · doi:10.3390/jimaging10100239 · Cited by 211
Iqbal, S., N. Qureshi, A., Li, J., & Mahmood, T. (2023) · Archives of Computational Methods in Engineering · doi:10.1007/s11831-023-09899-9 · Cited by 210
Explainable AI for Medical Data: Current Methods, Limitations, and Future Directions
Hossain, M. I., Zamzmi, G., Mouton, P. R., Salekin, M. S., Sun, Y., & Goldgof, D. B. (2023) · ACM Computing Surveys · doi:10.1145/3637487 · Cited by 182
Metadata
- Authors
- Huff, D. T., Weisman, A. J., & Jeraj, R.
- Affiliations
- University of Wisconsin–Madison (US)
- Corresponding author
- Jeraj, Robert
- Venue
- Physics in Medicine & Biology
- Publisher
- IOP Publishing
- Published
- 2021-02-01
- Volume
- 66
- Issue
- 4
- Pages
- 04TR01
- ISSN
- 0031-9155 (ISSN-L)
- 1361-6560
- PMC
- PMC8236074
- OpenAlex
- W3108932871
- Cited by
- 172
- References
- 120
- Citations by year
- 2026: 29 · 2025: 40 · 2024: 50 · 2023: 24 · 2022: 21 · 2021: 8
- FWCI
- 0.46
- Type
- journal article
- Language
- en
- Open access
- hybrid
- doi.org
- Licence
- cc-by-nc-nd
- publishingsupport.iopscience.iop.org/iop-standard/v1 (vor)
- iopscience.iop.org/info/page/text-and-data-mining (tdm)
- Locations
- Physics in Medicine and Biology (publishedVersion, cc-by-nc-nd)
- PubMed (publishedVersion)
- PubMed Central (acceptedVersion, cc-by-nc-nd)
- Funders
- National Institutes of Health (T32CA009206)
- University of Wisconsin Carbone Cancer Center (P30CA014520)
- Topics
- Physical Sciences › Computer Science › Artificial Intelligence › Explainable Artificial Intelligence (XAI)
- Health Sciences › Medicine › Health Informatics › Artificial Intelligence in Healthcare and Education
- Physical Sciences › Computer Science › Computer Vision and Pattern Recognition › Advanced Neural Network Applications
- Keywords
- deep learning interpretability, medical image analysis, model visualization, saliency maps, class activation maps, autoencoder, dimensionality reduction, feature visualization, attribution methods, explainable AI, clinical translation
- MeSH terms
- Deep Learning, Diagnostic Imaging, Humans, Image Processing, Computer-Assisted
About these checks
Registry, retraction, Cites and statistics results are computed, not judged, with one exception: a printed reference that no index lists is read once by a model before it counts as a citation error. Claims are extracted by a model and kept only when their quote appears verbatim in the text; each cited source is then checked, with a model’s help, for whether it says what the claim relies on. Those verdicts can be wrong — read the claim’s quote and the cited source before relying on one.
Statistics and arithmetic are recomputed, not judged.
Confidence bands are shown only for fields calibrated on our annotated test set. None is calibrated yet, so no band is shown.
What counts as a claim ›How we measure confidence ›How we check this ›
Are you an author, or do you see a problem with this page? Request a review
How to cite
Cite CoChat for the checks on this page, and the paper for its own findings.
- This page
- CoChat. (2026). Citation check: Interpretation and visualization techniques for deep learning models in medical imaging. https://app.cochat.ai/papers/10.1088/1361-6560/abcd17
- The paper
- Huff, D. T., Weisman, A. J., & Jeraj, R. (2021). Interpretation and visualization techniques for deep learning models in medical imaging. Physics in Medicine & Biology. https://doi.org/10.1088/1361-6560/abcd17
Data sources
Bibliographic data: Semantic Scholar, OpenAlex, Crossref.
Contains information from the Semantic Scholar Academic Graph Datasets, made available under the ODC Attribution License (ODC-BY 1.0).
Semantic Scholar’s data is described in: Kinney, R., et al. (2023). The Semantic Scholar Open Data Platform. arXiv:2301.10140.
