

The DOI matches its Crossref record; 30 of the 30 references it cites were found in a registry or an index.
RTExtract: time-series NMR spectra quantification based on 3D surface ridge tracking
Open accessAbstract
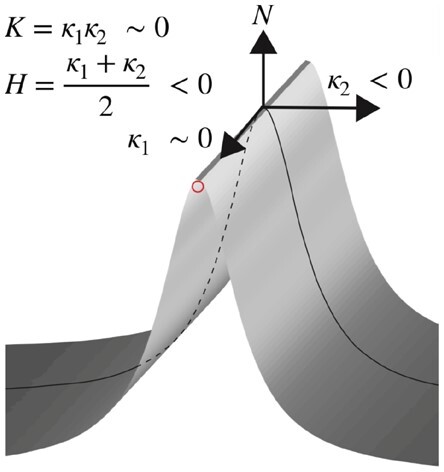
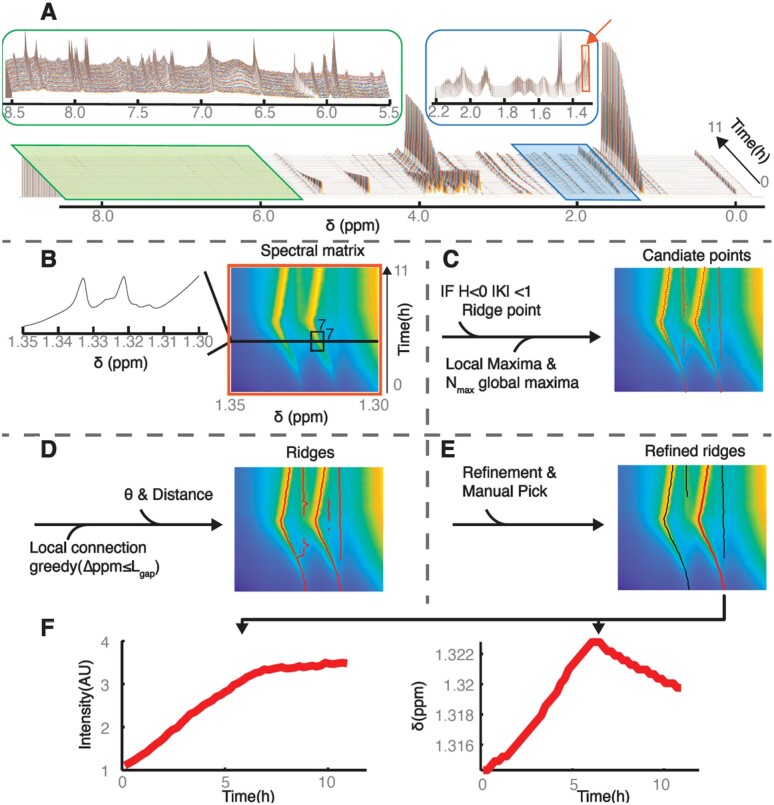
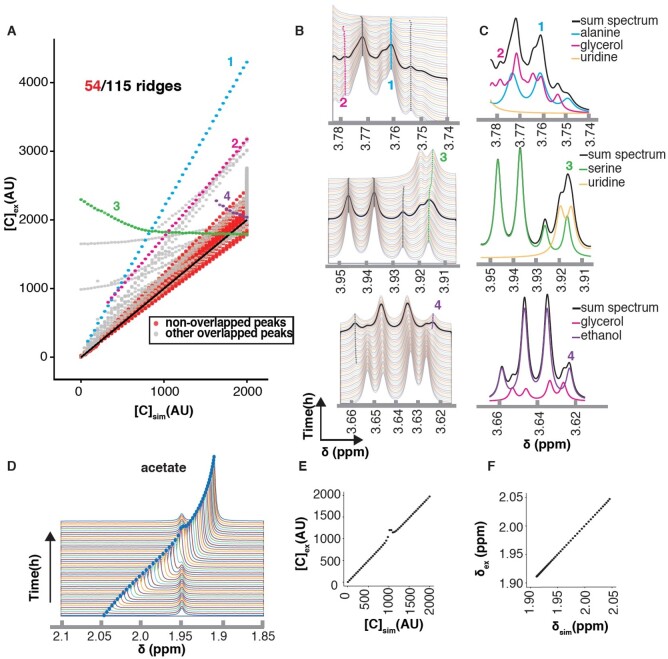
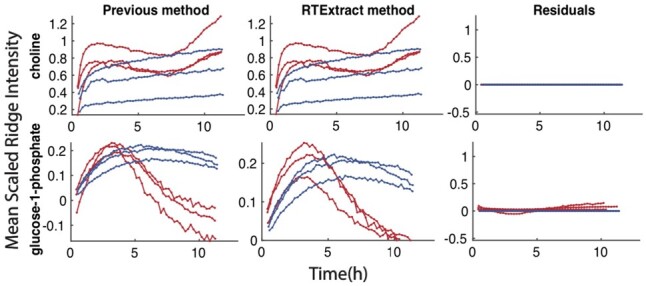
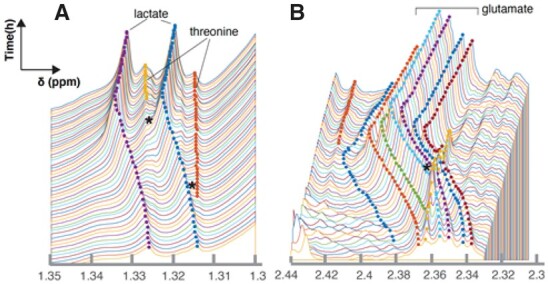
Motivation: Time-series nuclear magnetic resonance (NMR) has advanced our knowledge about metabolic dynamics. Before analyzing compounds through modeling or statistical methods, chemical features need to be tracked and quantified. However, because of peak overlap and peak shifting, the available protocols are time consuming at best or even impossible for some regions in NMR spectra. Results: We introduce Ridge Tracking-based Extract (RTExtract), a computer vision-based algorithm, to quantify time-series NMR spectra. The NMR spectra of multiple time points were formulated as a 3D surface. Candidate points were first filtered using local curvature and optima, then connected into ridges by a greedy algorithm. Interactive steps were implemented to refine results. Among 173 simulated ridges, 115 can be tracked (RMSD < 0.001). For reproducing previous results, RTExtract took less than 2 h instead of ∼48 h, and two instead of seven parameters need tuning. Multiple regions with overlapping and changing chemical shifts are accurately tracked. Availability and implementation: Source code is freely available within Metabolomics toolbox GitHub repository (https://github.com/artedison/Edison_Lab_Shared_Metabolomics_UGA/tree/master/metabolomics_toolbox/code/ridge_tracking) and is implemented in MATLAB and R. Supplementary information: Supplementary data are available at Bioinformatics online.
Overview
The claims and statistics of this paper haven’t been checked yet.
Run the check — free, no account needed. It reads the open-access text and checks the sources it cites.
Integrity signals
Registry
Cites
Statistics
Figures
Verification
Claims the paper makes
The claims and statistics of this paper haven’t been checked yet.
Run the check — free, no account needed. It reads the open-access text and checks the sources it cites.
Claims other papers make about this one
Each is checked against this paper’s own text: does it say what the citing paper says it does?
The source backs part of the claim, not all of it — or backs it for a different population, condition or comparison.
In the citing paper
“A limiting factor of the utilization of such unique tools is that complex real-time and in vivo data require dedicated software to investigate them, however nowadays this surge in data collection surpasses the current capacity to extract and interpret information effectively and computational tools are emerging.150–152”
From Connecting metabolome and phenotype: recent advances in functional metabolomics tools for the identification of bioactive natural products (2024) · cites this paper as [152]
Experimental — accuracy not yet measured
Self-check
Percentages, sums and reported differences re-computed from the paper’s own numbers.
The self-check needs the paper’s full text.
Citations
Cites
TrackMate: An open and extensible platform for single-particle tracking
Tinévez, J.-Y., Perry, N., Schindelin, J., Hoopes, G. M., Reynolds, G. D., Laplantine, E., Bednarek, S. Y., Shorte, S. L., & Eliceiri, K. W. (2016) · Methods · doi:10.1016/j.ymeth.2016.09.016 · Cited by 3,427
An unbiased detector of curvilinear structures
Steger, C. T. (1998) · IEEE Transactions on Pattern Analysis and Machine Intelligence · doi:10.1109/34.659930 · Cited by 1,436
Segmentation through variable-order surface fitting
Besl, P. J., & Jain, R. (1988) · IEEE Transactions on Pattern Analysis and Machine Intelligence · doi:10.1109/34.3881 · Cited by 1,077
Invariant surface characteristics for 3D object recognition in range images
Besl, P. J., & Jain, R. (1986) · Computer Vision Graphics and Image Processing · doi:10.1016/0734-189x(86)90220-3 · Cited by 517
Haralick, R. M., Watson, L. T., & Laffey, T. J. (1983) · The International Journal of Robotics Research · doi:10.1177/027836498300200105 · Cited by 281
Real-time metabolome profiling of the metabolic switch between starvation and growth
Link, H., Fuhrer, T., Gerosa, L., Zamboni, N., & Sauer, U. (2015) · Nature Methods · doi:10.1038/nmeth.3584 · Cited by 251
Bayesian deconvolution and quantification of metabolites in complex 1D NMR spectra using BATMAN
Hao, J., Liebeke, M., Astle, W. J., Iorio, M. D., Bundy, J. G., & Ebbels, T. M. D. (2014) · Nature Protocols · doi:10.1038/nprot.2014.090 · Cited by 202
MetaboLab - advanced NMR data processing and analysis for metabolomics
Ludwig, C., & Günther, U. L. (2011) · BMC Bioinformatics · doi:10.1186/1471-2105-12-366 · Cited by 151
Willmore, T. J. (1969) · Journal of the London Mathematical Society · doi:10.1112/jlms/s1-44.1.667 · Cited by 138
Getting Your Peaks in Line: A Review of Alignment Methods for NMR Spectral Data
Vu, T. N., & Laukens, K. (2013) · Metabolites · doi:10.3390/metabo3020259 · Cited by 127
NMR Flow Tube for Online NMR Reaction Monitoring
Foley, D. A., Bez, E., Codina, A., et al. (2014) · Analytical Chemistry · doi:10.1021/ac502300q · Cited by 122
Advancing metabolic models with kinetic information
Link, H., Christodoulou, D., & Sauer, U. (2014) · Current Opinion in Biotechnology · doi:10.1016/j.copbio.2014.01.015 · Cited by 104
Krishnamurthy, K. (2013) · Magnetic Resonance in Chemistry · doi:10.1002/mrc.4022 · Cited by 102
NMRNet: a deep learning approach to automated peak picking of protein NMR spectra
Klukowski, P., Augoff, M., Zięba, M., et al. (2018) · Bioinformatics · doi:10.1093/bioinformatics/bty134 · Cited by 93
Metabolic plasticity in CLL: adaptation to the hypoxic niche
Koczula, K. M., Ludwig, C., Hayden, R., Cronin, L., Pratt, G., Parry, H., Tennant, D., Drayson, M., Bunce, C. M., Khanim, F. L., et al. (2016) · Leukemia · doi:10.1038/leu.2015.187 · Cited by 91
Szakács, Z., Hägele, G., & Roman, T. Y. K. A. (2004) · Analytica Chimica Acta · doi:10.1016/j.aca.2004.07.005 · Cited by 79
Joshi, M. D., Hedberg, A., & McIntosh, L. P. (1997) · Protein Science · doi:10.1002/pro.5560061224 · Cited by 72
In-Vivo NMR Spectroscopy: A Powerful and Complimentary Tool for Understanding Environmental Toxicity
Bastawrous, M., Jenne, A., Anaraki, M. T., & Simpson, A. J. (2018) · Metabolites · doi:10.3390/metabo8020035 · Cited by 70
Takis, P. G., Schäfer, H., Spraul, M., & Luchinat, C. (2017) · Nature Communications · doi:10.1038/s41467-017-01587-0 · Cited by 64
Three-Dimensional Object Recognition from Range Images
Suk, M., & Bhandarkar, S. M. (1992) · Computer science workbench · doi:10.1007/978-4-431-68213-4 · Cited by 57
Self-citationContinuous in vivo Metabolism by NMR
Judge, M. T., Wu, Y., Tayyari, F., Hattori, A., Glushka, J., Ito, T., Arnold, J., & Edison, A. S. (2019) · Frontiers in Molecular Biosciences · doi:10.3389/fmolb.2019.00026 · Cited by 53
Self-citationModelling the acid/base 1H NMR chemical shift limits of metabolites in human urine
Tredwell, G. D., Bundy, J. G., Iorio, M. D., et al. (2016) · Metabolomics · doi:10.1007/s11306-016-1101-y · Cited by 47
Csenki, L., Alm, E., Torgrip, R. J. O., et al. (2007) · Analytical and Bioanalytical Chemistry · doi:10.1007/s00216-007-1475-9 · Cited by 35
Conformational Ensembles: The Role of Neuropeptide Structures in Receptor Binding
Edison, A. S., Espinoza, E., & Zachariah, C. (1999) · Journal of Neuroscience · doi:10.1523/jneurosci.19-15-06318.1999 · Cited by 29
Self-citationComputer vision-based automated peak picking applied to protein NMR spectra
Klukowski, P., Walczak, M., Gonczarek, A., Boudet, J., & Wider, G. (2015) · Bioinformatics · doi:10.1093/bioinformatics/btv318 · Cited by 27
Reducing impacts of organism variability in metabolomics via time trajectory in vivo NMR
Anaraki, M. T., Simpson, M. J., & Simpson, A. J. (2018) · Magnetic Resonance in Chemistry · doi:10.1002/mrc.4759 · Cited by 24
Combining Spectral Ordering with Peak Fitting for One-Dimensional NMR Quantitative Metabolomics
Liebeke, M., Hao, J., Ebbels, T. M. D., & Bundy, J. G. (2013) · Analytical Chemistry · doi:10.1021/ac400237w · Cited by 20
Modelling Short Time Series in Metabolomics: A Functional Data Analysis Approach
Montana, G., Berk, M., & Ebbels, T. M. D. (2011) · Advances in experimental medicine and biology · doi:10.1007/978-1-4419-7046-6_31 · Cited by 15
Brockerman, J., Okon, M., Withers, S. G., et al. (2018) · Protein Science · doi:10.1002/pro.3562 · Cited by 6
Structural Studies of a Neuropeptide Precursor Protein with an RGD Proteolytic Site
Zachariah, C., Cameron, A., Lindberg, I., et al. (2001) · Biochemistry · doi:10.1021/bi010448s · Cited by 4
Cited by
Sorted by citations
Vitale, G. A., Geibel, C., Minda, V., Wang, M., Aron, A. T., & Petras, D. (2024) · Natural Product Reports · doi:10.1039/d3np00050h · Cited by 66
Metadata
- Authors
- Wu, Y., Judge, M. T., Arnold, J., Bhandarkar, S. M., & Edison, A. S.
- Affiliations
- Institute of Bioinformatics
- Department of Genetics
- Department of Computer Science
- University of Georgia (US)
- Corresponding author
- Edison, Arthur S
- Venue
- Bioinformatics
- Publisher
- Oxford University Press (OUP)
- Published
- 2020-07-12
- Volume
- 36
- Issue
- 20
- Pages
- 5068-5075
- ISSN
- 1367-4803 (ISSN-L)
- 1367-4811
- PMC
- PMC7755419
- OpenAlex
- W3031610872
- Cited by
- 8
- References
- 30
- Citations by year
- 2026: 1 · 2024: 1 · 2023: 3 · 2022: 2 · 2020: 1
- FWCI
- 0.49
- Type
- journal article
- Language
- en
- Open access
- hybrid
- doi.org
- Licence
- Locations
- Bioinformatics (publishedVersion, cc-by-nc)
- PubMed Central (publishedVersion, cc-by-nc)
- PubMed (publishedVersion)
- Funders
- National Science Foundation [NSF (1713746)
- Georgia Research Alliance
- Topics
- Life Sciences › Biochemistry, Genetics and Molecular Biology › Molecular Biology › Metabolomics and Mass Spectrometry Studies
- Physical Sciences › Chemistry › Spectroscopy › Advanced NMR Techniques and Applications
- Physical Sciences › Chemistry › Analytical Chemistry › Spectroscopy and Chemometric Analyses
- Keywords
- NMR quantification, 3D surface analysis, peak overlap, peak shift, metabolic dynamics, computer vision, greedy algorithm, metabolomics
- MeSH terms
- Algorithms, Magnetic Resonance Imaging, Magnetic Resonance Spectroscopy, Software, Metabolomics
About these checks
Registry, retraction, Cites and statistics results are computed, not judged, with one exception: a printed reference that no index lists is read once by a model before it counts as a citation error. Claims are extracted by a model and kept only when their quote appears verbatim in the text; each cited source is then checked, with a model’s help, for whether it says what the claim relies on. Those verdicts can be wrong — read the claim’s quote and the cited source before relying on one.
Statistics and arithmetic are recomputed, not judged.
Confidence bands are shown only for fields calibrated on our annotated test set. None is calibrated yet, so no band is shown.
What counts as a claim ›How we measure confidence ›How we check this ›
Are you an author, or do you see a problem with this page? Request a review
