

The DOI matches its Crossref record; 45 of the 45 references it cites were found in a registry or an index.
Protein intrinsically disordered regions have a non-random, modular architecture
Open accessPublished version of a preprint
Abstract
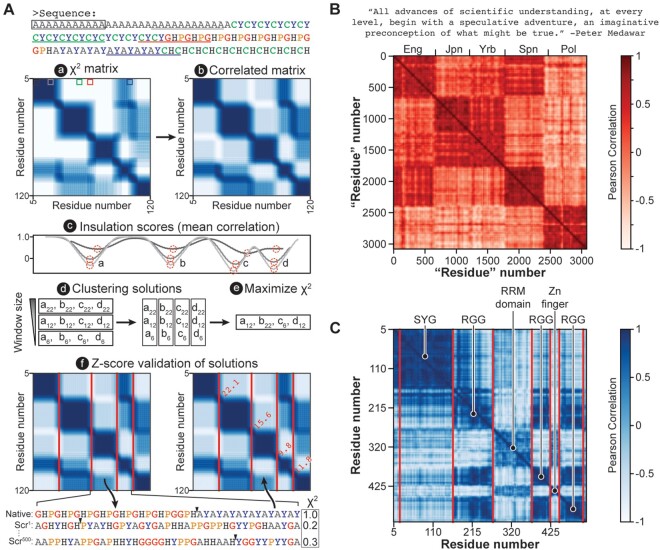
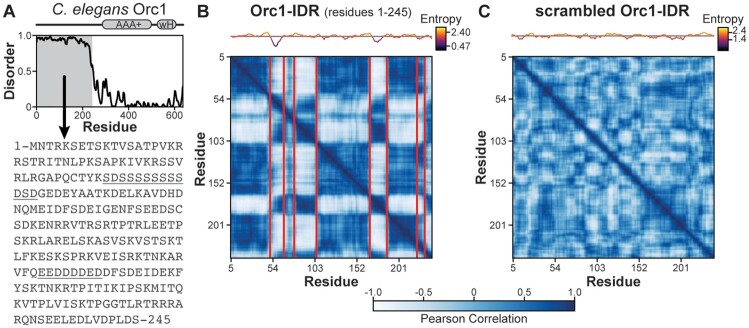
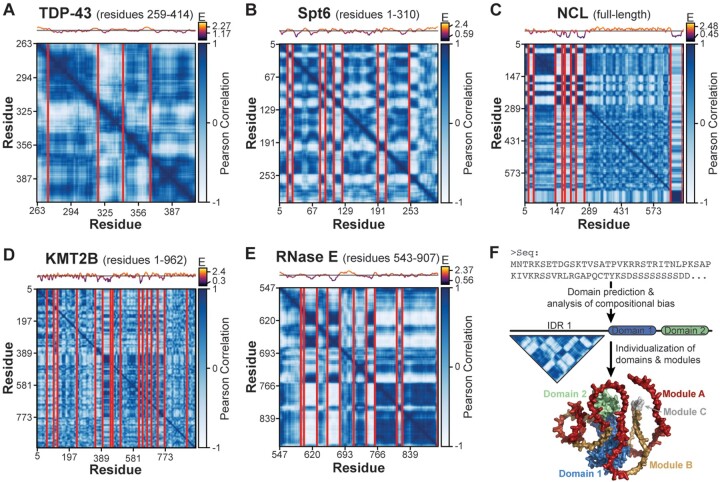
Motivation: Protein sequences can be broadly categorized into two classes: those which adopt stable secondary structure and fold into a domain (i.e. globular proteins), and those that do not. The sequences belonging to this latter class are conformationally heterogeneous and are described as being intrinsically disordered. Decades of investigation into the structure and function of globular proteins has resulted in a suite of computational tools that enable their sub-classification by domain type, an approach that has revolutionized how we understand and predict protein functionality. Conversely, it is unknown if sequences of disordered protein regions are subject to broadly generalizable organizational principles that would enable their sub-classification. Results: Here, we report the development of a statistical approach that quantifies linear variance in amino acid composition across a sequence. With multiple examples, we provide evidence that intrinsically disordered regions are organized into statistically non-random modules of unique compositional bias. Modularity is observed for both low and high-complexity sequences and, in some cases, we find that modules are organized in repetitive patterns. These data demonstrate that disordered sequences are non-randomly organized into modular architectures and motivate future experiments to comprehensively classify module types and to determine the degree to which modules constitute functionally separable units analogous to the domains of globular proteins. Availability and implementation: The source code, documentation, and data to reproduce all figures are freely available at https://github.com/MWPlabUTSW/Chi-Score-Analysis.git. The analysis is also available as a Google Colab Notebook (https://colab.research.google.com/github/MWPlabUTSW/Chi-Score-Analysis/blob/main/ChiScore_Analysis.ipynb).
Overview
The claims and statistics of this paper haven’t been checked yet.
Run the check — free, no account needed. It reads the open-access text and checks the sources it cites.
Integrity signals
Registry
Cites
Statistics
Figures
Verification
Claims the paper makes
The claims and statistics of this paper haven’t been checked yet.
Run the check — free, no account needed. It reads the open-access text and checks the sources it cites.
Self-check
Percentages, sums and reported differences re-computed from the paper’s own numbers.
The self-check needs the paper’s full text.
Citations
Cites
Highly accurate protein structure prediction with AlphaFold
Jumper, J., Evans, R., Pritzel, A., Green, T., Figurnov, M., Ronneberger, O., Tunyasuvunakool, K., Bates, R., Žídek, A., Potapenko, A., et al. (2021) · Nature · doi:10.1038/s41586-021-03819-2 · Cited by 43,764
Intrinsically disordered protein
Dunker, A. K., Lawson, J. D., Brown, C. J., Williams, R. M., Romero, P., Oh, J. S., Oldfield, C. J., Campen, A. M., Ratliff, C. M., Hipps, K. W., et al. (2001) · Journal of Molecular Graphics and Modelling · doi:10.1016/s1093-3263(00)00138-8 · Cited by 2,272
Wang, J., Choi, J.-M., Holehouse, A. S., Lee, H. O., Zhang, X., Jahnel, M., Maharana, S., Lemaitre, R., Pozniakovsky, A., Drechsel, D., et al. (2018) · Cell · doi:10.1016/j.cell.2018.06.006 · Cited by 2,076
Intrinsically Disordered Proteins
Uversky, V. N. (2013) · Brenner's Encyclopedia of Genetics · doi:10.1016/b978-0-12-374984-0.01698-3 · Cited by 1,637
Das, R. K., & Pappu, R. V. (2013) · Proceedings of the National Academy of Sciences · doi:10.1073/pnas.1304749110 · Cited by 1,008
Conicella, A. E., Zerze, G. H., Mittal, J., & Fawzi, N. L. (2016) · Structure · doi:10.1016/j.str.2016.07.007 · Cited by 885
Nucleation, Rapid Folding, and Globular Intrachain Regions in Proteins
Wetlaufer, D. B. (1973) · Proceedings of the National Academy of Sciences · doi:10.1073/pnas.70.3.697 · Cited by 831
Statistics of local complexity in amino acid sequences and sequence databases
Wootton, J. C., & Federhen, S. (1993) · Computers & Chemistry · doi:10.1016/0097-8485(93)85006-x · Cited by 729
Attributes of short linear motifs
Davey, N. E., Van Roey, K., Weatheritt, R. J., Toedt, G., Uyar, B., Altenberg, B., Budd, A., Diella, F., Dinkel, H., & Gibson, T. J. (2011) · Molecular BioSystems · doi:10.1039/c1mb05231d · Cited by 628
CIDER: Resources to Analyze Sequence-Ensemble Relationships of Intrinsically Disordered Proteins
Holehouse, A. S., Das, R. K., Ahad, J., Richardson, M. O. G., & Pappu, R. V. (2017) · Biophysical Journal · doi:10.1016/j.bpj.2016.11.3200 · Cited by 551
Intrinsically Disordered Proteins and Their “Mysterious” (Meta)Physics
Uversky, V. N. (2019) · Frontiers in Physics · doi:10.3389/fphy.2019.00010 · Cited by 532
CATH: increased structural coverage of functional space
Sillitoe, I., Bordin, N., Dawson, N., Waman, V. P., Ashford, P., Scholes, H. M., Pang, C. S. M., Woodridge, L., Rauer, C., Sen, N., et al. (2021) · Nucleic Acids Research · doi:10.1093/nar/gkaa1079 · Cited by 509
Evolutionary Rate Heterogeneity in Proteins with Long Disordered Regions
Brown, C. J., Takayama, S., Campen, A. M., Vise, P., Marshall, T. W., Oldfield, C. J., Williams, C. J., & Keith Dunker, A. (2002) · Journal of Molecular Evolution · doi:10.1007/s00239-001-2309-6 · Cited by 441
Acid blobs and negative noodles
Sigler, P. B. (1988) · Nature · doi:10.1038/333210a0 · Cited by 437
Babu, M. M. (2016) · Biochemical Society Transactions · doi:10.1042/bst20160172 · Cited by 431
The Hitchhiker’s guide to Hi-C analysis: Practical guidelines
Lajoie, B. R., Dekker, J., & Kaplan, N. (2014) · Methods · doi:10.1016/j.ymeth.2014.10.031 · Cited by 399
Functional partitioning of transcriptional regulators by patterned charge blocks
Lyons, H., Veettil, R. T., Pradhan, P., Fornero, C., Cruz, N. D. L., Ito, K., Eppert, M., Roeder, R. G., & Sabari, B. R. (2023) · Cell · doi:10.1016/j.cell.2022.12.013 · Cited by 295
Brown, C. J., Johnson, A. K., Dunker, A., & Daughdrill, G. (2011) · Current Opinion in Structural Biology · doi:10.1016/j.sbi.2011.02.005 · Cited by 288
Metapredict: a fast, accurate, and easy-to-use predictor of consensus disorder and structure
Emenecker, R. J., Griffith, D., & Holehouse, A. S. (2021) · Biophysical Journal · doi:10.1016/j.bpj.2021.08.039 · Cited by 259
Cryo-EM structures of four polymorphic TDP-43 amyloid cores
Cao, Q., Boyer, D. R., Sawaya, M. R., Ge, P., & Eisenberg, D. S. (2019) · Nature Structural & Molecular Biology · doi:10.1038/s41594-019-0248-4 · Cited by 250
Intrinsic disorder in proteins associated with neurodegenerative diseases
Vladimir, N. (2009) · Frontiers in bioscience · doi:10.2741/3594 · Cited by 242
Proteome-wide signatures of function in highly diverged intrinsically disordered regions
Zarin, T., Strome, B., Ba, A. N. N., Alberti, S., Forman-Kay, J. D., & Moses, A. M. (2019) · eLife · doi:10.7554/elife.46883 · Cited by 213
Primary sequence independence for prion formation
Ross, E. D., Edskes, H. K., Terry, M. J., & Wickner, R. B. (2005) · Proceedings of the National Academy of Sciences · doi:10.1073/pnas.0506136102 · Cited by 204
Scrambled Prion Domains Form Prions and Amyloid
Ross, E. D., Baxa, U., & Wickner, R. B. (2004) · Molecular and Cellular Biology · doi:10.1128/mcb.24.16.7206-7213.2004 · Cited by 179
Jiang, L.-L., Che, M., Zhao, J., Zhou, C.-J., Xie, M.-Y., Li, H.-Y., He, J.-H., & Hu, H.-Y. (2013) · Journal of Biological Chemistry · doi:10.1074/jbc.m113.463828 · Cited by 162
Why are “natively unfolded” proteins unstructured under physiologic conditions?
Uversky, V. N., Gillespie, J. R., & Fink, A. L. (2000) · Proteins Structure Function and Bioinformatics · doi:10.1002/1097-0134(20001115)41:3<415::aid-prot130>3.0.co;2-7 · Cited by 132
Murthy, A. C., Tang, W. S., Jovic, N., Janke, A. M., Seo, D. H., Perdikari, T. M., Mittal, J., & Fawzi, N. L. (2021) · Nature Structural & Molecular Biology · doi:10.1038/s41594-021-00677-4 · Cited by 131
Reduced amino acid alphabet is sufficient to accurately recognize intrinsically disordered protein
Weathers, E. A., Paulaitis, M. E., Woolf, T. B., & Hoh, J. H. (2004) · FEBS Letters · doi:10.1016/j.febslet.2004.09.036 · Cited by 130
Ubiquitomics: An Overview and Future
Vere, G., Kealy, R., Kessler, B. M., & Pinto-Fernández, A. (2020) · Biomolecules · doi:10.3390/biom10101453 · Cited by 122
Uncovering Non-random Binary Patterns Within Sequences of Intrinsically Disordered Proteins
Cohan, M. C., Shinn, M. K., Lalmansingh, J. M., & Pappu, R. V. (2021) · Journal of Molecular Biology · doi:10.1016/j.jmb.2021.167373 · Cited by 117
A new class of disordered elements controls DNA replication through initiator self-assembly
Parker, M. W., Bell, M., Mir, M., Kao, J. A., Darzacq, X., Botchan, M. R., & Berger, J. M. (2019) · eLife · doi:10.7554/elife.48562 · Cited by 116
Self-citationMobiDB-lite 3.0: fast consensus annotation of intrinsic disorder flavors in proteins
Necci, M., Piovesan, D., Clementel, D., Dosztányi, Z., & Tosatto, S. C. E. (2020) · Bioinformatics · doi:10.1093/bioinformatics/btaa1045 · Cited by 86
Patthy, L. (1994) · Current Opinion in Structural Biology · doi:10.1016/s0959-440x(94)90108-2 · Cited by 84
Lin, Y., Zhou, X., Kato, M., Liu, D., Ghaemmaghami, S., Tu, B. P., & McKnight, S. L. (2020) · Proceedings of the National Academy of Sciences · doi:10.1073/pnas.2012216117 · Cited by 73
Necci, M., Piovesan, D., & Tosatto, S. C. E. (2016) · Protein Science · doi:10.1002/pro.3041 · Cited by 56
Moesa, H. A., Wakabayashi, S., Nakai, K., & Patil, A. (2012) · Molecular BioSystems · doi:10.1039/c2mb25202c · Cited by 55
White, S. H., & Jacobs, R. E. (1993) · Journal of Molecular Evolution · doi:10.1007/bf02407307 · Cited by 45
A unified view of low complexity regions (LCRs) across species
Lee, B., Jaberi-Lashkari, N., & Calo, E. (2022) · eLife · doi:10.7554/elife.77058 · Cited by 37
Distinct roles of hnRNPH1 low-complexity domains in splicing and transcription
Kim, G. H., & Kwon, I. (2021) · Proceedings of the National Academy of Sciences · doi:10.1073/pnas.2109668118 · Cited by 36
Katuwawala, A., & Kurgan, L. (2020) · Biomolecules · doi:10.3390/biom10121636 · Cited by 32
Cascarina, S. M., King, D. C., Nishimura, E. O., & Ross, E. D. (2021) · NAR Genomics and Bioinformatics · doi:10.1093/nargab/lqab048 · Cited by 28
White, S. H. (1994) · Journal of Molecular Evolution · doi:10.1007/bf00163155 · Cited by 25
Millard, P. S., Bugge, K., Marabini, R., Boomsma, W., Burow, M., & Kragelund, B. B. (2019) · Protein Science · doi:10.1002/pro.3754 · Cited by 22
Protein sequences as random fractals
Mitra, C. K., & Rani, M. (1993) · Journal of Biosciences · doi:10.1007/bf02703118 · Cited by 12
Patil, A., Teraguchi, S., DINH, H., Nakai, K., & Standley, D. M. (2011) · Pacific Symposium on Biocomputing (PSB) · doi:10.1142/9789814366496_0016 · Cited by 5
Research works printed but not linked: 2
- Patil, 2012, Pac Symp Biocomput, 164
- Wetlaufer, 1973, Proc Natl Acad Sci USA, 697
Metadata
- Authors
- McConnell, B. S., & Parker, M. W.
- Affiliations
- The University of Texas Southwestern Medical Center (US)
- Corresponding author
- Parker, Matthew W
- ORCID
- Parker, Matthew W
- Venue
- Bioinformatics
- Publisher
- Oxford University Press (OUP)
- Published
- 2023-12-01
- Volume
- 39
- Issue
- 12
- ISSN
- 1367-4803 (ISSN-L)
- 1367-4811
- PMC
- PMC10719218
- OpenAlex
- W4389279319
- Cited by
- 17
- References
- 45
- Citations by year
- 2026: 5 · 2025: 9 · 2024: 2 · 2023: 1
- FWCI
- 1.51
- Type
- journal article
- Language
- en
- Open access
- gold
- doi.org
- Licence
- Locations
- Bioinformatics (publishedVersion, cc-by)
- bioRxiv (Cold Spring Harbor Laboratory) (acceptedVersion, cc-by-nc)
- PubMed Central (publishedVersion, cc-by)
- PubMed (publishedVersion)
- Funders
- Welch Foundation (I-2074–20210327)
- Topics
- Life Sciences › Biochemistry, Genetics and Molecular Biology › Molecular Biology › Protein Structure and Dynamics
- Life Sciences › Biochemistry, Genetics and Molecular Biology › Molecular Biology › Machine Learning in Bioinformatics
- Life Sciences › Biochemistry, Genetics and Molecular Biology › Molecular Biology › RNA and protein synthesis mechanisms
- Keywords
- intrinsically disordered regions, amino acid composition, compositional bias, sequence organization, protein domain classification, conformational heterogeneity
- MeSH terms
- Protein Domains, Amino Acid Sequence, Amino Acids, Software, Intrinsically Disordered Proteins
About these checks
Registry, retraction, Cites and statistics results are computed, not judged, with one exception: a printed reference that no index lists is read once by a model before it counts as a citation error. Claims are extracted by a model and kept only when their quote appears verbatim in the text; each cited source is then checked, with a model’s help, for whether it says what the claim relies on. Those verdicts can be wrong — read the claim’s quote and the cited source before relying on one.
Statistics and arithmetic are recomputed, not judged.
Confidence bands are shown only for fields calibrated on our annotated test set. None is calibrated yet, so no band is shown.
What counts as a claim ›How we measure confidence ›How we check this ›
Are you an author, or do you see a problem with this page? Request a review
Data sources
Bibliographic data: Semantic Scholar, OpenAlex, Crossref.
Contains information from the Semantic Scholar Academic Graph Datasets, made available under the ODC Attribution License (ODC-BY 1.0).
Semantic Scholar’s data is described in: Kinney, R., et al. (2023). The Semantic Scholar Open Data Platform. arXiv:2301.10140.
