

The DOI matches its Crossref record; 11 of the 11 references it cites were found in a registry or an index.
Structured crowdsourcing enables convolutional segmentation of histology images
Open accessAbstract
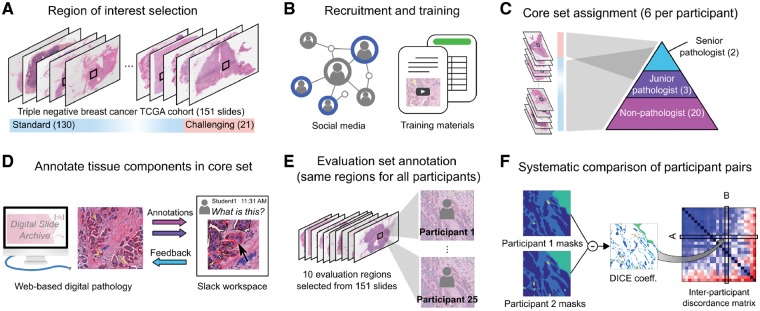
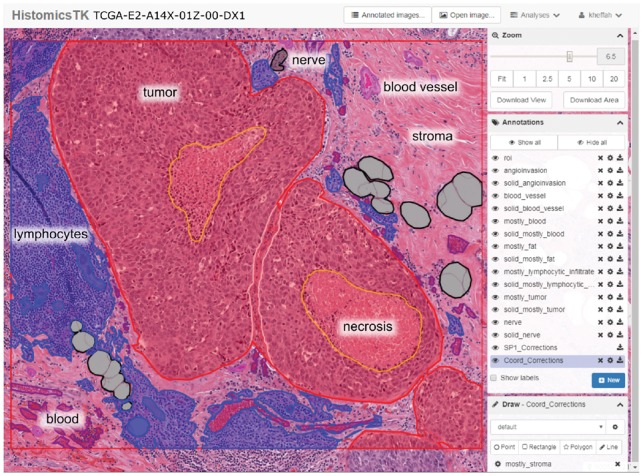
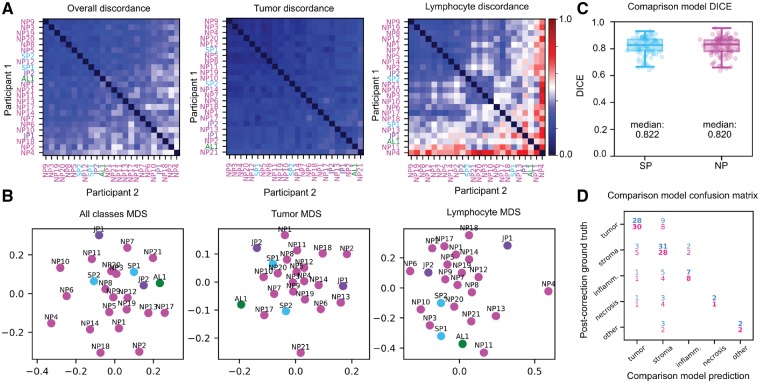
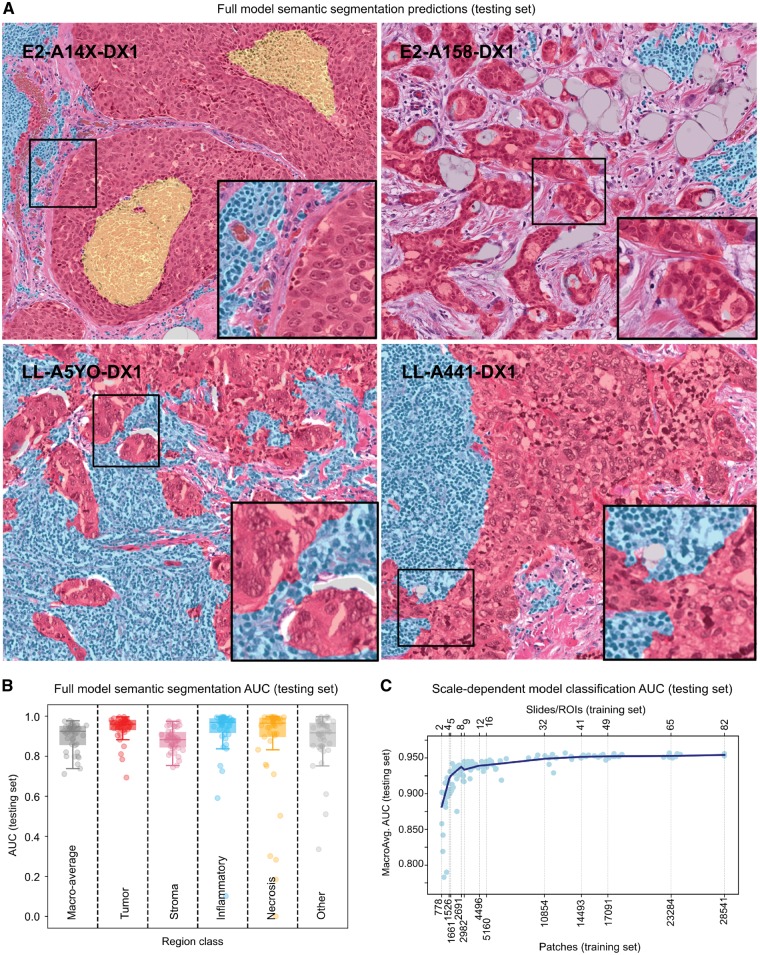
MOTIVATION: While deep-learning algorithms have demonstrated outstanding performance in semantic image segmentation tasks, large annotation datasets are needed to create accurate models. Annotation of histology images is challenging due to the effort and experience required to carefully delineate tissue structures, and difficulties related to sharing and markup of whole-slide images. RESULTS: We recruited 25 participants, ranging in experience from senior pathologists to medical students, to delineate tissue regions in 151 breast cancer slides using the Digital Slide Archive. Inter-participant discordance was systematically evaluated, revealing low discordance for tumor and stroma, and higher discordance for more subjectively defined or rare tissue classes. Feedback provided by senior participants enabled the generation and curation of 20 000+ annotated tissue regions. Fully convolutional networks trained using these annotations were highly accurate (mean AUC=0.945), and the scale of annotation data provided notable improvements in image classification accuracy. AVAILABILITY AND IMPLEMENTATION: Dataset is freely available at: https://goo.gl/cNM4EL. SUPPLEMENTARY INFORMATION: Supplementary data are available at Bioinformatics online.
Overview
The claims and statistics of this paper haven’t been checked yet.
Run the check — free, no account needed. It reads the open-access text and checks the sources it cites.
Integrity signals
Registry
Cites
Statistics
Figures
Verification
Claims the paper makes
The claims and statistics of this paper haven’t been checked yet.
Run the check — free, no account needed. It reads the open-access text and checks the sources it cites.
Claims other papers make about this one
Each is checked against this paper’s own text: does it say what the citing paper says it does?
The source backs part of the claim, not all of it — or backs it for a different population, condition or comparison.
In the citing paper
“Emerging solutions include standardized open-source tools (e.g., QuPath) [44], collaborative multi-institutional annotation efforts, and AI-assisted annotation workflows that reduce manual burden [45].”
From Artificial Intelligence in Dermatopathology: An Update and Review of the Current Literature (2026) · cites this paper as [45]
Experimental — accuracy not yet measuredIn the citing paper
“These studies showed there are correlations between characterizations of TIL patterns, as analyzed by computerized algorithms, and patient survival rates and groupings of patients based on subclasses of immunotypes.”
From AI in Medical Imaging Informatics: Current Challenges and Future Directions (2020) · cites this paper as [181]
Self-check
Percentages, sums and reported differences re-computed from the paper’s own numbers.
The self-check needs the paper’s full text.
Citations
Cites
Reinhard, E., Adhikhmin, M., Gooch, B., & Shirley, P. S. (2001) · IEEE Computer Graphics and Applications · doi:10.1109/38.946629 · Cited by 2,949
Revisiting the hallmarks of cancer.
Fouad, Y. A., & Aanei, C. M. (2017) · Europe PMC (PubMed Central) · Cited by 875
Features of triple-negative breast cancer
Plasilova, M. L., Hayse, B., Killelea, B. K., Horowitz, N. R., Chagpar, A. B., & Lannin, D. R. (2016) · Medicine · doi:10.1097/md.0000000000004614 · Cited by 211
Gutman, D. A., Cobb, J., Somanna, D., Park, Y., Wang, F., Kurç, T., Saltz, J. H., Brat, D. J., Cooper, L., & Kong, J. (2013) · Journal of the American Medical Informatics Association · doi:10.1136/amiajnl-2012-001469 · Cited by 191
Gutman, D. A., Khalilia, M. A., Lee, S., Nalisnik, M., Mullen, Z., Beezley, J., Chittajallu, D. R., Manthey, D., & Cooper, L. (2017) · Cancer Research · doi:10.1158/0008-5472.can-17-0629 · Cited by 180
Irshad, H., Montaser‐Kouhsari, L., WALTZ, G., Bucur, O., Nowak, J. A., Dong, F., Knoblauch, N., & Beck, A. H. (2014) · Pacific Symposium on Biocomputing (PSB) · doi:10.1142/9789814644730_0029 · Cited by 141
Crowdsourcing in Computer Vision
Kovashka, A., Russakovsky, O., Fei-Fei, L., & Grauman, K. L. (2016) · now publishers, Inc. eBooks · doi:10.1561/9781680832136 · Cited by 76
Crowdsourcing in Computer Vision
Kovashka, A., Fei-Fei, L., Russakovsky, O., & Grauman, K. L. (2016) · Foundations and Trends® in Computer Graphics and Vision · doi:10.1561/0600000071 · Cited by 75
Quanti.us: a tool for rapid, flexible, crowd-based annotation of images
Hughes, A. J., Mornin, J. D., Biswas, S. K., Beck, L. E., Bauer, D. P., Raj, A., Bianco, S., & Gartner, Z. J. (2018) · Nature Methods · doi:10.1038/s41592-018-0069-0 · Cited by 65
Irshad, H., Oh, E.-Y., Schmolze, D. B., Quintana, L. M., Collins, L. C., Tamimi, R. M., & Beck, A. H. (2017) · Scientific Reports · doi:10.1038/srep43286 · Cited by 40
Research works printed but not linked: 1
- Su, 2012, Workshops at the Twenty-Sixth AAAI Conference on Artificial Intelligence
Cited by
Sorted by citations
Deep learning in histopathology: the path to the clinic
van der Laak, J., Litjens, G., & Ciompi, F. (2021) · Nature Medicine · doi:10.1038/s41591-021-01343-4 · Cited by 902
Deep neural network models for computational histopathology: A survey
Srinidhi, C. L., Ciga, O., & Martel, A. L. (2021) · Medical Image Analysis · doi:10.1016/j.media.2020.101813 · Cited by 749
AI in Medical Imaging Informatics: Current Challenges and Future Directions
Panayides, A. S., Amini, A., Filipovic, N. D., Sharma, A., Tsaftaris, S. A., Young, A., Foran, D., Do, N., Golemati, S., Kurc, T., et al. (2020) · IEEE Journal of Biomedical and Health Informatics · doi:10.1109/jbhi.2020.2991043 · Cited by 713
A visual–language foundation model for pathology image analysis using medical twitter
Huang, Z., Bianchi, F., Yuksekgonul, M., Montine, T. J., & Zou, J. (2023) · Nature Medicine · doi:10.1038/s41591-023-02504-3 · Cited by 693
Abels, E., Pantanowitz, L., Aeffner, F., Zarella, M. D., van der Laak, J. A. W. M., Bui, M. M., Vemuri, V. N. P., Parwani, A. V., Gibbs, J., Agosto‐Arroyo, E., et al. (2019) · The Journal of Pathology · doi:10.1002/path.5331 · Cited by 469
Metadata
- Authors
- Amgad, M., Elfandy, H., Hussein, H., Atteya, L. A., Elsebaie, M. A. T., Abo Elnasr, L. S., Sakr, R. A., Salem, H. S. E., Ismail, A. F., Saad, A. M., Ahmed, J., Elsebaie, M. A. T., Rahman, M., Ruhban, I. A., Elgazar, N. M., Alagha, Y., Osman, M. H., Alhusseiny, A. M., Khalaf, M. M., Younes, A.-A. F., Abdulkarim, A., Younes, D. M., Gadallah, A. M., Elkashash, A. M., Fala, S. Y., Zaki, B. M., Beezley, J., Chittajallu, D. R., Manthey, D., Gutman, D. A., & Cooper, L. A. D.
- Affiliations
- Emory University (US)
- Department of Pathology, National Cancer Institute , Cairo, Egypt
- Cairo University (EG)
- Ministry of Health and Population (EG)
- Ain Shams University (EG)
- Department of Medicine, Menoufia University , Menoufia, Egypt
- Menoufia University (EG)
- Alexandria University (EG)
- University of Chittagong (BD)
- Damascus University (SY)
- Mansoura University (EG)
- Zagazig University (EG)
- Batterjee Medical College (SA)
- Suez Canal University (EG)
- Kitware (United States) (US)
- Corresponding author
- Cooper, Lee A D
- ORCID
- Venue
- Bioinformatics
- Publisher
- Oxford University Press (OUP)
- Published
- 2019-02-06
- Volume
- 35
- Issue
- 18
- Pages
- 3461-3467
- ISSN
- 1367-4803 (ISSN-L)
- 1367-4811
- PMC
- PMC6748796
- OpenAlex
- W2922239620
- Cited by
- 315
- References
- 11
- Citations by year
- 2026: 41 · 2025: 73 · 2024: 61 · 2023: 60 · 2022: 42 · 2021: 20 · 2020: 17 · 2019: 1
- FWCI
- 9.12
- Type
- journal article
- Language
- en
- Open access
- hybrid
- doi.org
- Licence
- Locations
- Bioinformatics (publishedVersion, cc-by)
- PubMed Central (publishedVersion, cc-by)
- PubMed (publishedVersion)
- Greater South Information System
- Funders
- U.S. National Institutes of Health
- National Cancer Institute grants (U01CA220401, U24CA194362)
- Topics
- Physical Sciences › Computer Science › Artificial Intelligence › AI in cancer detection
- Physical Sciences › Computer Science › Computer Vision and Pattern Recognition › Medical Image Segmentation Techniques
- Life Sciences › Biochemistry, Genetics and Molecular Biology › Biophysics › Cell Image Analysis Techniques
- Keywords
- breast cancer, whole slide images, annotated dataset, fully convolutional network
- MeSH terms
- Algorithms, Breast Neoplasms, Histological Techniques, Humans, Crowdsourcing
About these checks
Registry, retraction, Cites and statistics results are computed, not judged, with one exception: a printed reference that no index lists is read once by a model before it counts as a citation error. Claims are extracted by a model and kept only when their quote appears verbatim in the text; each cited source is then checked, with a model’s help, for whether it says what the claim relies on. Those verdicts can be wrong — read the claim’s quote and the cited source before relying on one.
Statistics and arithmetic are recomputed, not judged.
Confidence bands are shown only for fields calibrated on our annotated test set. None is calibrated yet, so no band is shown.
What counts as a claim ›How we measure confidence ›How we check this ›
Are you an author, or do you see a problem with this page? Request a review
