

Intraoperative microseizure detection using a high-density micro-electrocorticography electrode array
Open accessPublished version of a preprint
The DOI matches its Crossref record; 36 of the 36 references it cites were found in a registry or an index.
Abstract
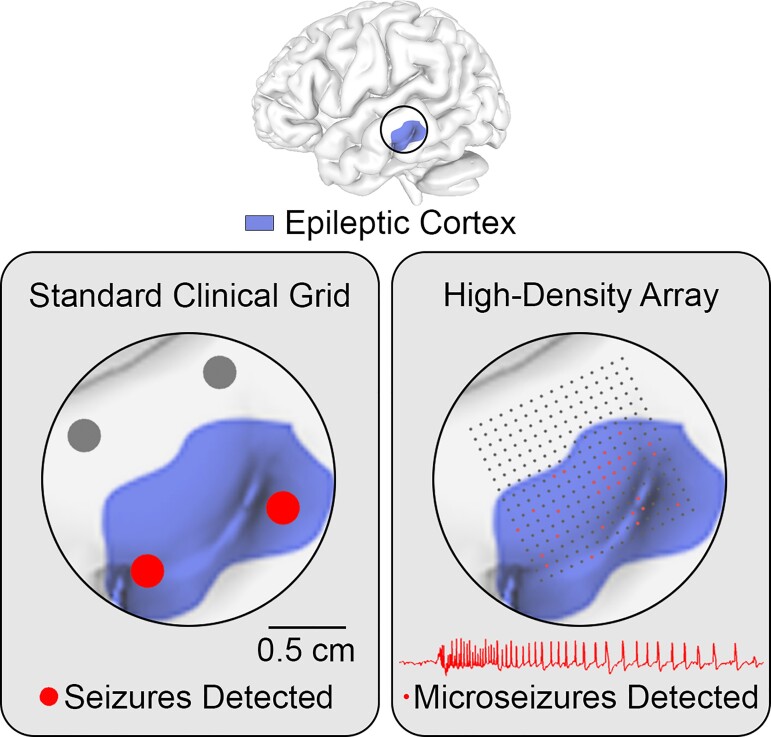
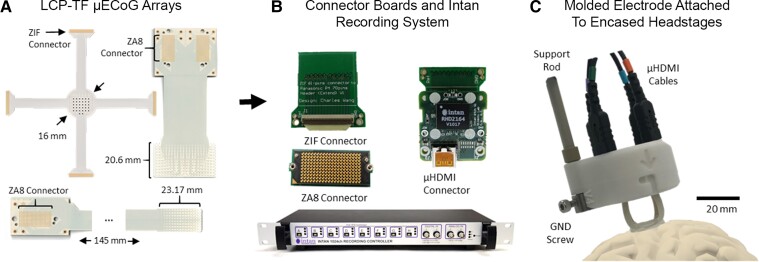
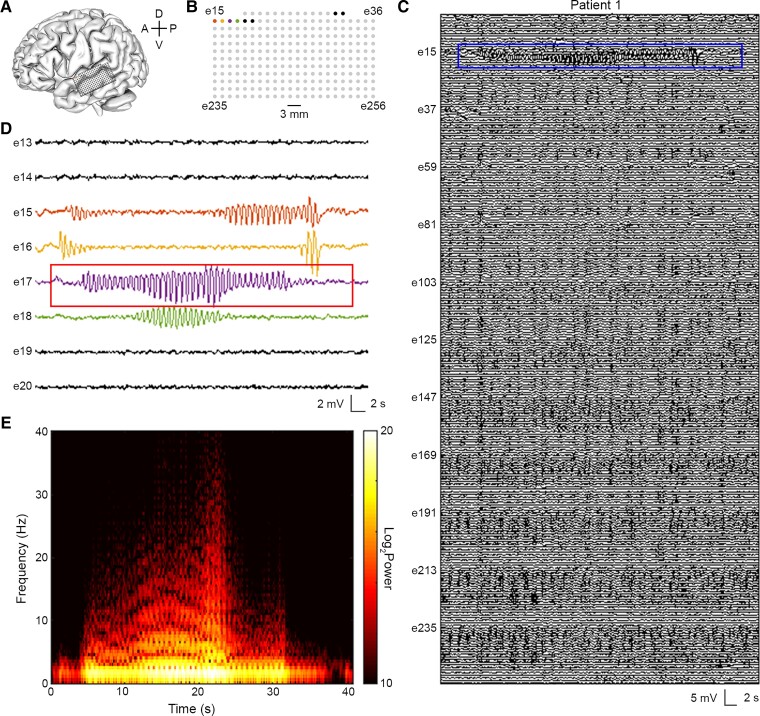
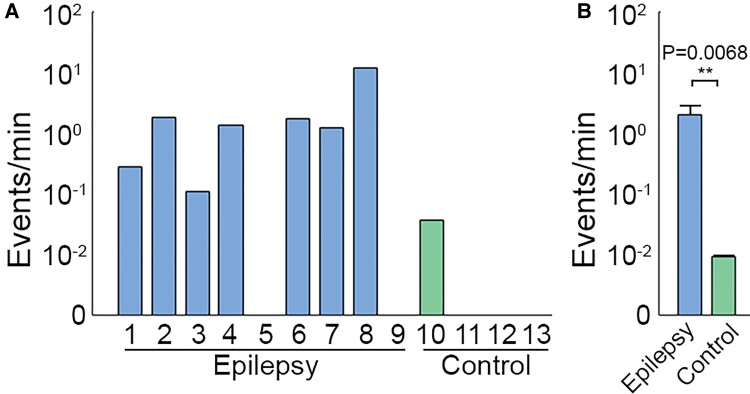
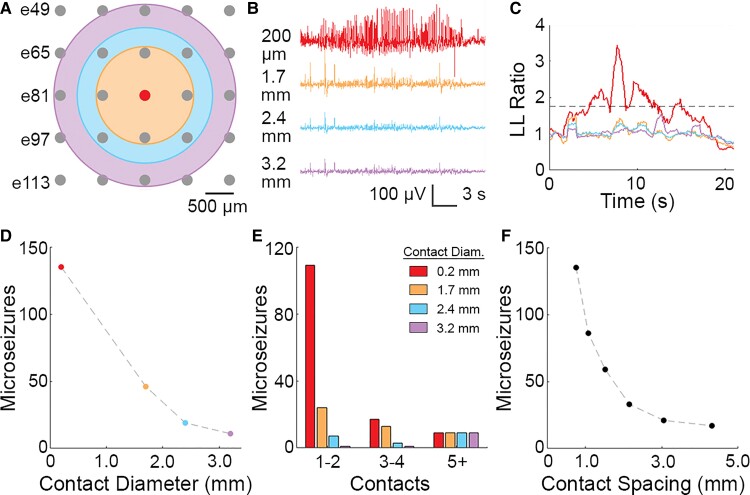
One-third of epilepsy patients suffer from medication-resistant seizures. While surgery to remove epileptogenic tissue helps some patients, 30–70% of patients continue to experience seizures following resection. Surgical outcomes may be improved with more accurate localization of epileptogenic tissue. We have previously developed novel thin-film, subdural electrode arrays with hundreds of microelectrodes over a 100–1000 mm2 area to enable high-resolution mapping of neural activity. Here, we used these high-density arrays to study microscale properties of human epileptiform activity. We performed intraoperative micro-electrocorticographic recordings in nine patients with epilepsy. In addition, we recorded from four patients with movement disorders undergoing deep brain stimulator implantation as non-epileptic controls. A board-certified epileptologist identified microseizures, which resembled electrographic seizures normally observed with clinical macroelectrodes. Recordings in epileptic patients had a significantly higher microseizure rate (2.01 events/min) than recordings in non-epileptic subjects (0.01 events/min; permutation test, P = 0.0068). Using spatial averaging to simulate recordings from larger electrode contacts, we found that the number of detected microseizures decreased rapidly with increasing contact diameter and decreasing contact density. In cases in which microseizures were spatially distributed across multiple channels, the approximate onset region was identified. Our results suggest that micro-electrocorticographic electrode arrays with a high density of contacts and large coverage are essential for capturing microseizures in epilepsy patients and may be beneficial for localizing epileptogenic tissue to plan surgery or target brain stimulation.
Overview
The claims and statistics of this paper haven’t been checked yet.
Free: it reads the open-access text and checks the first 5 claims that cite a source we can check. Create a free account to check every claim.
Integrity signals
Registry
Cites
Statistics
Figures
Verification
Claims the paper makes
The claims and statistics of this paper haven’t been checked yet.
Free: it reads the open-access text and checks the first 5 claims that cite a source we can check. Create a free account to check every claim.
Claims other papers make about this one
Each is checked against this paper’s own text: does it say what the citing paper says it does?
The cited source says what the claim attributes to it.
In the citing paper
“Different approaches to increase the density and lower the invasiveness of ECoG are currently being developed for use in humans and animal models176–182.”
From The speech neuroprosthesis (2024) · cites this paper as [181]
Self-check
Percentages, sums and reported differences re-computed from the paper’s own numbers.
The self-check needs the paper’s full text.
Citations
Cites
The origin of extracellular fields and currents — EEG, ECoG, LFP and spikes
Buzsáki, G., Anastassiou, C. A., & Koch, C. (2012) · Nature Reviews Neuroscience · doi:10.1038/nrn3241 · Cited by 4,225 · cited 2×
“20,21 Spatially localized epileptiform activity on the submillimeter scale is not apparent in standard clinical recordings but has been revealed by experimental recordings from epileptic patients using silicon shank microelectrode arrays and surface and intraparenchymal microwire electrode arrays.”
Presurgical evaluation of epilepsy
Rosenow, F. (2001) · Brain · doi:10.1093/brain/124.9.1683 · Cited by 1,669
Chen, Z., Brodie, M. J., Liew, D., & Kwan, P. (2018) · JAMA Neurology · doi:10.1001/jamaneurol.2017.3949 · Cited by 1,514
Devinsky, O., & Pacia, S. (1993) · Neurologic Clinics · doi:10.1016/s0733-8619(18)30132-4 · Cited by 1,175
Self-citationKwan, P., Schachter, S. C., & Brodie, M. J. (2011) · New England Journal of Medicine · doi:10.1056/nejmra1004418 · Cited by 1,052
Different Origins of Gamma Rhythm and High-Gamma Activity in Macaque Visual Cortex
Ray, S., & Maunsell, J. H. R. (2011) · PLoS Biology · doi:10.1371/journal.pbio.1000610 · Cited by 1,012
Ray, S., Crone, N. E., Niebur, E., Franaszczuk, P. J., & Hsiao, S. S. (2008) · The Journal of Neuroscience · doi:10.1523/jneurosci.2848-08.2008 · Cited by 722
Nine-year prospective efficacy and safety of brain-responsive neurostimulation for focal epilepsy
Nair, D. R., Laxer, K. D., Weber, P. B., Murro, A. M., Park, Y. D., Barkley, G. L., Smith, B. J., Gwinn, R. P., Doherty, M. J., Noe, K. H., et al. (2020) · Neurology · doi:10.1212/wnl.0000000000010154 · Cited by 490 · cited 1×
“4,9,10 Resection, ablation (e.g. 11 – 14 Diagnostic tools currently used to identify the EZ include neuroimaging, seizure semiology, scalp EEG, electrocortico-graphy (ECoG) and stereo-electroencephalography (sEEG).”
Pesaran, B., Vinck, M., Einevoll, G. T., Sirota, A., Fries, P., Siegel, M., Truccolo, W., Schroeder, C. E., & Srinivasan, R. (2018) · Nature Neuroscience · doi:10.1038/s41593-018-0171-8 · Cited by 370
Self-citationMicroseizures and the spatiotemporal scales of human partial epilepsy
Stead, M., Bower, M., Brinkmann, B. H., Lee, K., Marsh, W. R., Meyer, F. B., Litt, B., Van Gompel, J., & Worrell, G. A. (2010) · Brain · doi:10.1093/brain/awq190 · Cited by 311
Research works printed but not linked: 1
- NeuroPace, 2020, RNS system physician manual
Cited by
Silva, A. B., Littlejohn, K. T., Liu, J. R., Moses, D. A., & Chang, E. F. (2024) · Nature Reviews Neuroscience · doi:10.1038/s41583-024-00819-9 · Cited by 103
High-resolution neural recordings improve the accuracy of speech decoding
Duraivel, S., Rahimpour, S., Chiang, C.-H., Trumpis, M., Wang, C., Barth, K., Harward, S. C., Lad, S. P., Friedman, A. H., Southwell, D. G., et al. (2023) · Nature Communications · doi:10.1038/s41467-023-42555-1 · Cited by 75
Self-citation
Metadata
- Authors
- Sun, J., Barth, K., Qiao, S., Chiang, C.-H., Wang, C., Rahimpour, S., Trumpis, M., Duraivel, S., Dubey, A., Wingel, K. E., Rachinskiy, I., Voinas, A. E., Ferrentino, B., Southwell, D. G., Haglund, M. M., Friedman, A. H., Lad, S. P., Doyle, W. K., Solzbacher, F., Cogan, G., Sinha, S. R., Devore, S., Devinsky, O., Friedman, D., Pesaran, B., & Viventi, J.
- Affiliations
- New York University (US)
- Duke University (US)
- University of Utah (US)
- Corresponding author
- Pesaran, Bijan
- Viventi, Jonathan
- ORCID
- Sun, James
- Barth, Katrina
- Qiao, Shaoyu
- Chiang, Chia-Han
- Wang, Charles
- Rahimpour, Shervin
- Trumpis, Michael
- Duraivel, Suseendrakumar
- Dubey, Agrita
- Wingel, Katie E.
- Rachinskiy, Iakov
- Voinas, Alex E.
- Ferrentino, Breonna
- Southwell, Derek G.
- Haglund, Michael M.
- Lad, Shivanand P.
- Doyle, Werner K.
- Solzbacher, Florian
- Cogan, Gregory
- Sinha, Saurabh R.
- Devore, Sasha
- Devinsky, Orrin
- Friedman, Daniel
- Pesaran, Bijan
- Viventi, Jonathan
- Venue
- Brain Communications
- Publisher
- Oxford University Press (OUP)
- Published
- 2022-05-02
- Volume
- 4
- Issue
- 3
- Pages
- fcac122-fcac122
- ISSN
- 2632-1297 (ISSN-L)
- PMC
- PMC9155612
- OpenAlex
- W4282029002
- Cited by
- 31
- References
- 36
- Citations by year
- 2026: 9 · 2025: 6 · 2024: 7 · 2023: 9
- FWCI
- 3.58
- Type
- journal article
- Language
- en
- Open access
- gold
- doi.org
- Licence
- Locations
- Brain Communications (publishedVersion, cc-by)
- medRxiv (acceptedVersion, cc-by-nc-nd)
- PubMed Central (publishedVersion, cc-by)
- PubMed (publishedVersion)
- Funders
- Esther A. & Joseph Klingenstein Fund
- Topics
- Health Sciences › Medicine › Clinical Neurology › Epilepsy research and treatment
- Life Sciences › Neuroscience › Cellular and Molecular Neuroscience › Neuroscience and Neural Engineering
- Life Sciences › Neuroscience › Cognitive Neuroscience › EEG and Brain-Computer Interfaces
- Keywords
- high-density electrode arrays, epilepsy, intraoperative recording, epileptiform activity, subdural electrodes, deep brain stimulation, spatial averaging, seizure onset detection
About these checks
Registry, retraction, Cites and statistics results are computed, not judged, with one exception: a printed reference that no index lists is read once by a model before it counts as a citation error. Claims are extracted by a model and kept only when their quote appears verbatim in the text; each cited source is then checked, with a model’s help, for whether it says what the claim relies on. Those verdicts can be wrong — read the claim’s quote and the cited source before relying on one.
Statistics and arithmetic are recomputed, not judged.
Confidence bands are shown only for fields calibrated on our annotated test set. None is calibrated yet, so no band is shown.
What counts as a claim ›How we measure confidence ›How we check this ›
Are you an author, or do you see a problem with this page? Request a review
Data sources
Bibliographic data: Semantic Scholar, OpenAlex, Crossref.
Contains information from the Semantic Scholar Academic Graph Datasets, made available under the ODC Attribution License (ODC-BY 1.0).
Semantic Scholar’s data is described in: Kinney, R., et al. (2023). The Semantic Scholar Open Data Platform. arXiv:2301.10140.
