

The DOI matches its Crossref record; 89 of the 91 references it cites were found in a registry or an index.
Specialization along the Left Superior Temporal Sulcus for Auditory Categorization
Open accessAbstract
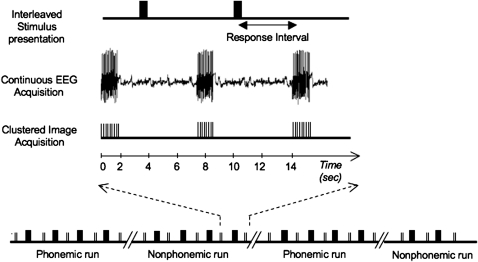
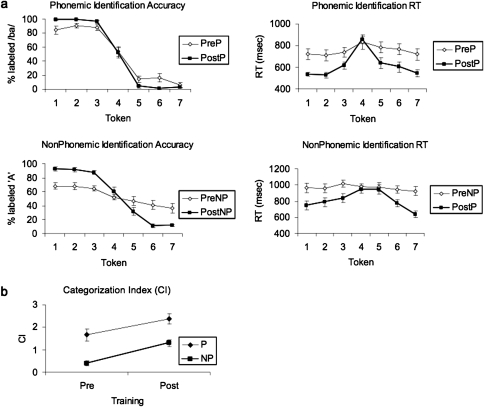
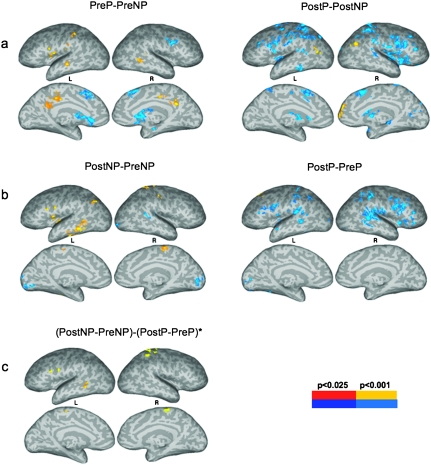
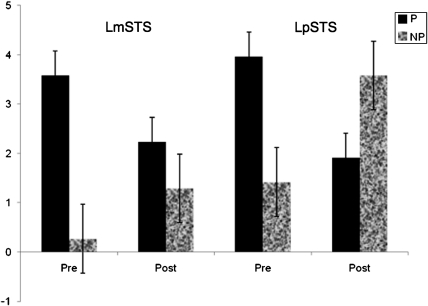
The affinity and temporal course of functional fields in middle and posterior superior temporal cortex for the categorization of complex sounds was examined using functional magnetic resonance imaging (fMRI) and event-related potentials (ERPs) recorded simultaneously. Data were compared before and after subjects were trained to categorize a continuum of unfamiliar nonphonemic auditory patterns with speech-like properties (NP) and a continuum of familiar phonemic patterns (P). fMRI activation for NP increased after training in left posterior superior temporal sulcus (pSTS). The ERP P2 response to NP also increased with training, and its scalp topography was consistent with left posterior superior temporal generators. In contrast, the left middle superior temporal sulcus (mSTS) showed fMRI activation only for P, and this response was not affected by training. The P2 response to P was also independent of training, and its estimated source was more anterior in left superior temporal cortex. Results are consistent with a role for left pSTS in short-term representation of relevant sound features that provide the basis for identifying newly acquired sound categories. Categorization of highly familiar phonemic patterns is mediated by long-term representations in left mSTS. Results provide new insight regarding the function of ventral and dorsal auditory streams.
Overview
The claims and statistics of this paper haven’t been checked yet.
Run the check — free, no account needed. It reads the open-access text and checks the sources it cites.
Integrity signals
Registry
Cites
Statistics
Figures
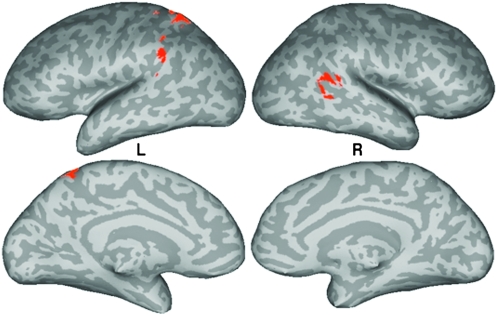
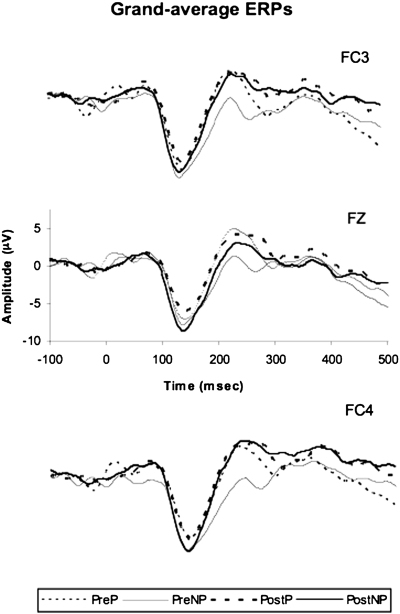
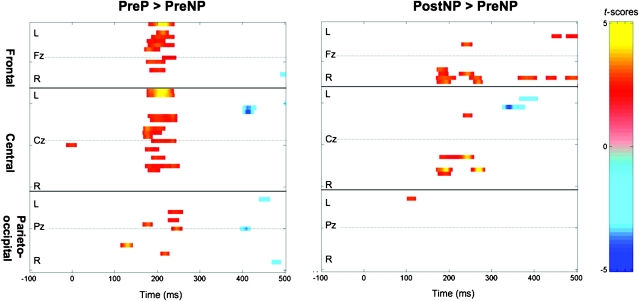
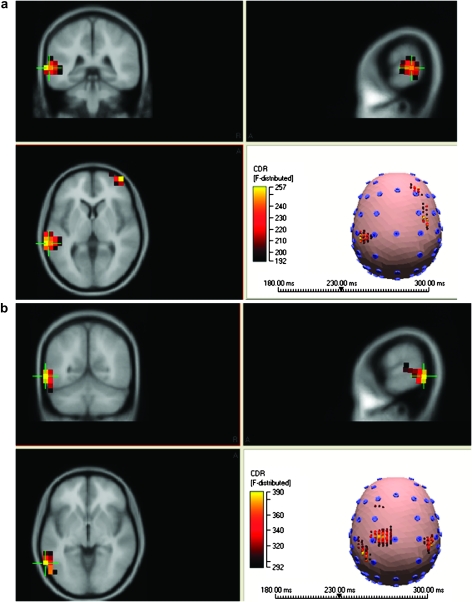
Verification
Claims the paper makes
The claims and statistics of this paper haven’t been checked yet.
Run the check — free, no account needed. It reads the open-access text and checks the sources it cites.
Claims other papers make about this one
Each is checked against this paper’s own text: does it say what the citing paper says it does?
In the citing paper
“the speech selective response in the left posterior superior temporal cortex was related to (a) the familiarity of auditory spectral patterns (Leech et al., 2009; Liebenthal et al., 2010; Margulis et al., 2009; Dick et al., 2011)”
From A review and synthesis of the first 20years of PET and fMRI studies of heard speech, spoken language and reading (2012) · cites this paper as Liebenthal et al., 2010
Self-check
Percentages, sums and reported differences re-computed from the paper’s own numbers.
The self-check needs the paper’s full text.
Citations
Cites
The assessment and analysis of handedness: The Edinburgh inventory
Oldfield, R. C. (1971) · Neuropsychologia · doi:10.1016/0028-3932(71)90067-4 · Cited by 35,900
(1990) · Choice Reviews Online · doi:10.5860/choice.27-3338 · Cited by 35,305
Hosmer, D. W., Lemeshow, S., & Sturdivant, R. X. (2013) · Wiley Series in Probability and Statistics · doi:10.1002/9781118548387 · Cited by 13,861
Co-Planar Stereotaxic Atlas of the Human Brain
Talairach, J., & Tournoux, P. (1988) · Medical Entomology and Zoology · Cited by 11,798
AFNI: Software for analysis and visualization of functional magnetic resonance neuroimages
Cox, R. W. (1996) · Computers and Biomedical Research · doi:10.1006/cbmr.1996.0014 · Cited by 10,913
Co-planar stereotaxic atlas of the human brain
Laitinen, L. (1989) · Clinical Neurology and Neurosurgery · doi:10.1016/0303-8467(89)90128-5 · Cited by 7,565
The cortical organization of speech processing
Hickok, G., & Poeppel, D. (2007) · Nature Reviews Neuroscience · doi:10.1038/nrn2113 · Cited by 5,495
Ungerleider, L. G. (1982) · Medical Entomology and Zoology · Cited by 4,531
Ingle, D., Goodale, M. A., & Mansfield, R. J. W. (1982) · The MIT Press eBooks · Cited by 4,118
Binder, J. R., Desai, R. H., Graves, W. W., & Conant, L. L. (2009) · Cerebral Cortex · doi:10.1093/cercor/bhp055 · Cited by 4,060
Self-citation
Research works printed but not linked: 1
- Ward, 2000, Simultaneous inference for fMRI data
Cited by
Sorted by citations
Price, C. J. (2012) · NeuroImage · doi:10.1016/j.neuroimage.2012.04.062 · Cited by 2,159
Veridical mapping in the development of exceptional autistic abilities
Mottron, L., Bouvet, L., Bonnel, A., Samson, F., Burack, J. A., Dawson, M., & Heaton, P. F. (2012) · Neuroscience & Biobehavioral Reviews · doi:10.1016/j.neubiorev.2012.11.016 · Cited by 233
New human-specific brain landmark: The depth asymmetry of superior temporal sulcus
Leroy, F., Cai, Q., Bogart, S. L., Dubois, J., Coulon, O., Monzalvo, K., Fischer, C., Glasel, H., der Haegen, L. V., Bénézit, A., et al. (2015) · Proceedings of the National Academy of Sciences · doi:10.1073/pnas.1412389112 · Cited by 202
Musical Expertise Boosts Implicit Learning of Both Musical and Linguistic Structures
Clément, F., & Schön, D. (2011) · Cerebral Cortex · doi:10.1093/cercor/bhr022 · Cited by 200
Categorical perception of lexical tones in Chinese revealed by mismatch negativity
Xi, J., Zhang, L., Shu, H., Zhang, Y., & Li, P. (2010) · Neuroscience · doi:10.1016/j.neuroscience.2010.06.077 · Cited by 184
Metadata
- Authors
- Liebenthal, E., Desai, R., Ellingson, M. M., Ramachandran, B., Desai, A., & Binder, J. R.
- Affiliations
- Medical College of Wisconsin (US)
- Corresponding author
- Liebenthal, Einat
- Venue
- Cerebral Cortex
- Publisher
- Oxford University Press (OUP)
- Published
- 2010-04-09
- Volume
- 20
- Issue
- 12
- Pages
- 2958-2970
- ISSN
- 1047-3211 (ISSN-L)
- 1460-2199
- PMC
- PMC2978244
- OpenAlex
- W2117381528
- Cited by
- 134
- References
- 91
- Citations by year
- 2026: 2 · 2025: 2 · 2024: 5 · 2023: 5 · 2022: 6 · 2021: 10 · 2020: 12 · 2019: 8 · 2018: 8 · 2017: 6 · 2016: 6 · 2015: 11 · 2014: 14 · 2013: 16 · 2012: 9
- FWCI
- 7.35
- Type
- journal article
- Language
- en
- Open access
- hybrid
- doi.org
- Licence
- cc-by-nc
- Locations
- Cerebral Cortex (publishedVersion, cc-by-nc)
- Europe PMC (PubMed Central) (publishedVersion, cc-by-nc)
- PubMed Central (publishedVersion, cc-by-nc)
- PubMed (publishedVersion)
- Scholar Commons (University of South Carolina) (submittedVersion, cc-by-nc)
- Funders
- National Institute on Deafness and Other Communication Disorders (R01DC006287)
- National Center for Research Resources (M01-RR00058, M01RR000058)
- Topics
- Life Sciences › Neuroscience › Cognitive Neuroscience › Neuroscience and Music Perception
- Life Sciences › Neuroscience › Cognitive Neuroscience › Neurobiology of Language and Bilingualism
- Social Sciences › Psychology › Experimental and Cognitive Psychology › Phonetics and Phonology Research
- Keywords
- auditory categorization
- MeSH terms
- Acoustic Stimulation, Adult, Auditory Perception, Brain Mapping, Cerebral Cortex, Evoked Potentials, Female, Humans, Magnetic Resonance Imaging, Male, Middle Aged, Young Adult
About these checks
Registry, retraction, Cites and statistics results are computed, not judged, with one exception: a printed reference that no index lists is read once by a model before it counts as a citation error. Claims are extracted by a model and kept only when their quote appears verbatim in the text; each cited source is then checked, with a model’s help, for whether it says what the claim relies on. Those verdicts can be wrong — read the claim’s quote and the cited source before relying on one.
Statistics and arithmetic are recomputed, not judged.
Confidence bands are shown only for fields calibrated on our annotated test set. None is calibrated yet, so no band is shown.
What counts as a claim ›How we measure confidence ›How we check this ›
Are you an author, or do you see a problem with this page? Request a review
