

The DOI matches its Crossref record; 113 of the 113 references it cites were found in a registry or an index.
Whole-Genome Duplication and the Functional Diversification of Teleost Fish Hemoglobins
Abstract
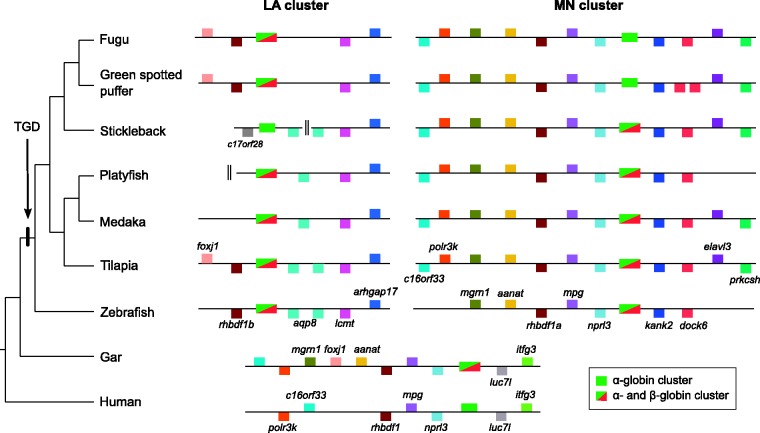
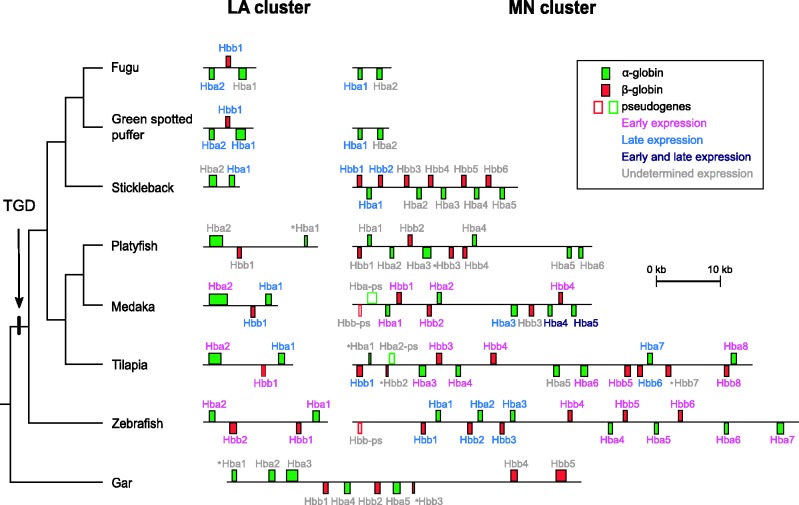
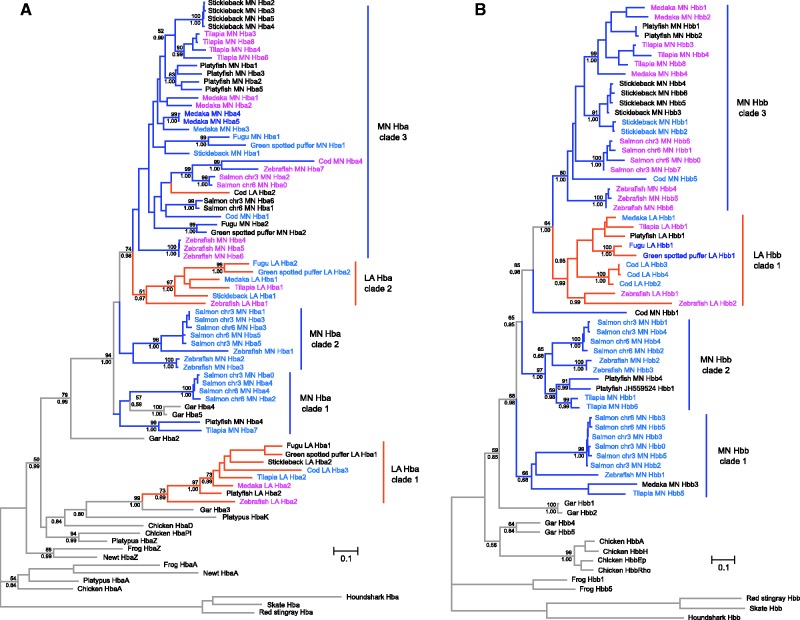
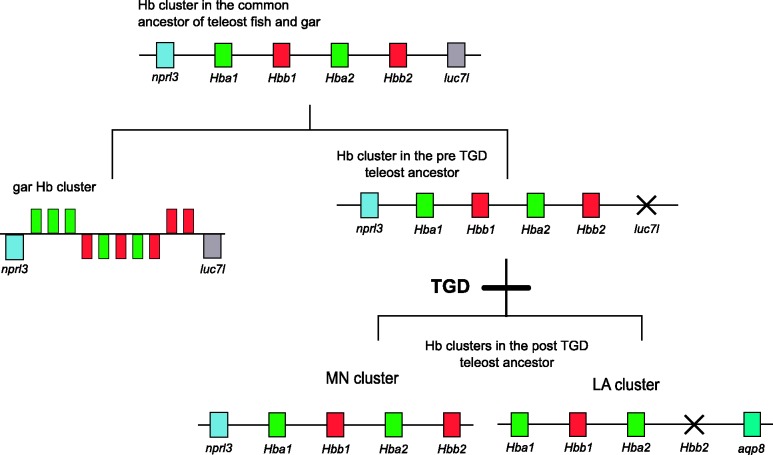
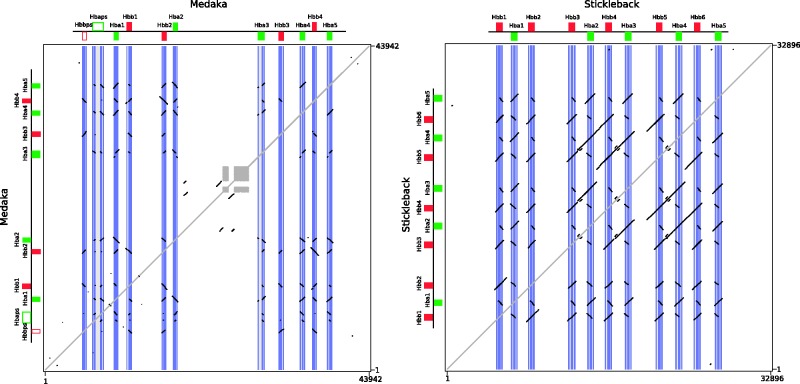
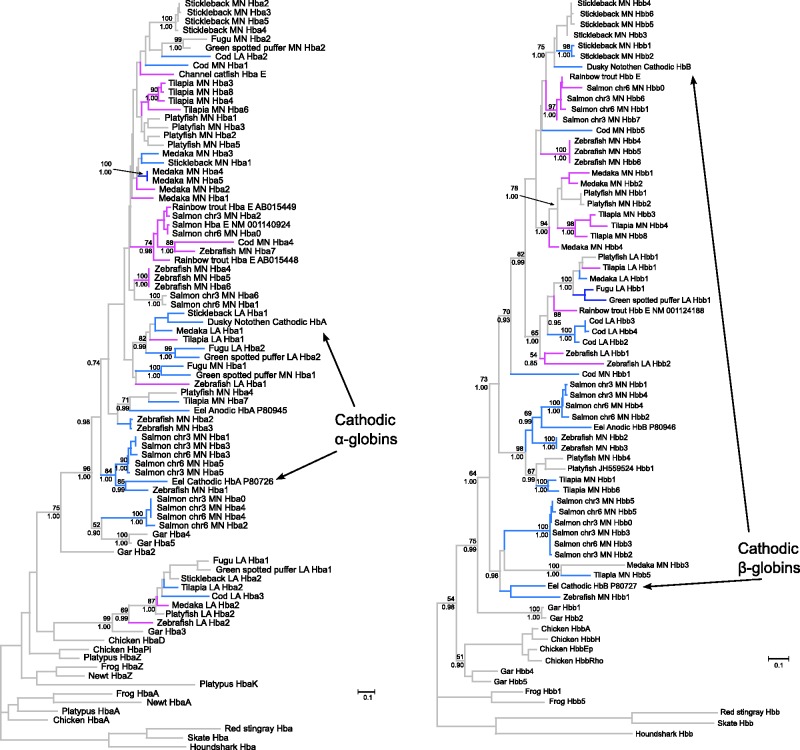
Subsequent to the two rounds of whole-genome duplication that occurred in the common ancestor of vertebrates, a third genome duplication occurred in the stem lineage of teleost fishes. This teleost-specific genome duplication (TGD) is thought to have provided genetic raw materials for the physiological, morphological, and behavioral diversification of this highly speciose group. The extreme physiological versatility of teleost fish is manifest in their diversity of blood-gas transport traits, which reflects the myriad solutions that have evolved to maintain tissue O(2) delivery in the face of changing metabolic demands and environmental O(2) availability during different ontogenetic stages. During the course of development, regulatory changes in blood-O(2) transport are mediated by the expression of multiple, functionally distinct hemoglobin (Hb) isoforms that meet the particular O(2)-transport challenges encountered by the developing embryo or fetus (in viviparous or oviparous species) and in free-swimming larvae and adults. The main objective of the present study was to assess the relative contributions of whole-genome duplication, large-scale segmental duplication, and small-scale gene duplication in producing the extraordinary functional diversity of teleost Hbs. To accomplish this, we integrated phylogenetic reconstructions with analyses of conserved synteny to characterize the genomic organization and evolutionary history of the globin gene clusters of teleosts. These results were then integrated with available experimental data on functional properties and developmental patterns of stage-specific gene expression. Our results indicate that multiple α- and β-globin genes were present in the common ancestor of gars (order Lepisoteiformes) and teleosts. The comparative genomic analysis revealed that teleosts possess a dual set of TGD-derived globin gene clusters, each of which has undergone lineage-specific changes in gene content via repeated duplication and deletion events. Phylogenetic reconstructions revealed that paralogous genes convergently evolved similar functional properties in different teleost lineages. Consistent with other recent studies of globin gene family evolution in vertebrates, our results revealed evidence for repeated evolutionary transitions in the developmental regulation of Hb synthesis.
Overview
The claims and statistics of this paper haven’t been checked yet.
Run the check — free, no account needed. It reads the open-access text and checks the sources it cites.
Integrity signals
Registry
Cites
Statistics
Figures
Verification
Claims the paper makes
The claims and statistics of this paper haven’t been checked yet.
Run the check — free, no account needed. It reads the open-access text and checks the sources it cites.
Claims other papers make about this one
Each is checked against this paper’s own text: does it say what the citing paper says it does?
In the citing paper
“In teleost fishes, the two chromosomal regions are inhabited by different numbers of α− and β-genes, reflecting functional diversity (72).”
From Tandem repeats lead to sequence assembly errors and impose multi-level challenges for genome and protein databases (2019) · cites this paper as [72]
Self-check
Percentages, sums and reported differences re-computed from the paper’s own numbers.
The self-check needs the paper’s full text.
Citations
Cites
1 retracted
RETRACTED ARTICLE: TREEFINDER: a powerful graphical analysis environment for molecular phylogenetics
Jobb, G., von Haeseler, A., & Strimmer, K. (2004) · BMC Evolutionary Biology · doi:10.1186/1471-2148-4-18 · Cited by 1,112
RetractedBasic local alignment search tool
Altschul, S. F., Gish, W., Miller, W., Myers, E. W., & Lipman, D. J. (1990) · Journal of Molecular Biology · doi:10.1006/jmbi.1990.9999 · Cited by 98,669
MUSCLE: multiple sequence alignment with high accuracy and high throughput
Edgar, R. C. (2004) · Nucleic Acids Research · doi:10.1093/nar/gkh340 · Cited by 44,662
MrBayes 3: Bayesian phylogenetic inference under mixed models
Ronquist, F., & Huelsenbeck, J. P. (2003) · Bioinformatics · doi:10.1093/bioinformatics/btg180 · Cited by 29,077
Prediction of complete gene structures in human genomic DNA
Burge, C., & Karlin, S. (1997) · Journal of Molecular Biology · doi:10.1006/jmbi.1997.0951 · Cited by 4,211
Jaillon, O., Aury, J.-M., Brunet, F., Petit, J.-L., Stange-Thomann, N., Mauceli, E., Bouneau, L., Fischer, C., Ozouf-Costaz, C., Bernot, A., et al. (2004) · Nature · doi:10.1038/nature03025 · Cited by 1,966
Zebrafish hox Clusters and Vertebrate Genome Evolution
Amores, A., Force, A. G., Yan, Y., Joly, L., Amemiya, C. T., Fritz, A., Ho, R. K., Langeland, J. A., Prince, V., Wang, Y.-L., et al. (1998) · Science · doi:10.1126/science.282.5394.1711 · Cited by 1,737
Multiple Alignment of DNA Sequences with MAFFT
Katoh, K., Asimenos, G., & Toh, H. (2009) · Methods in Molecular Biology · doi:10.1007/978-1-59745-251-9_3 · Cited by 1,438
EnsemblCompara GeneTrees: Complete, duplication-aware phylogenetic trees in vertebrates
Vilella, A. J., Severin, J., Ureta-Vidal, A., Heng, L., Durbin, R., & Birney, E. (2009) · Genome Research · doi:10.1101/gr.073585.107 · Cited by 1,238
PipMaker—A Web Server for Aligning Two Genomic DNA SequencesPreprint
Schwartz, S., Zhang, Z., Frazer, K. A., Smit, A. F. A., Riemer, C., Bouck, J. B., Gibbs, R. A., Hardison, R. C., & Miller, W. (2000) · Genome Research · doi:10.1101/gr.10.4.577 · Cited by 1,165
Research works printed but not linked: 5
- Goodman, 1987, Pattern and process in vertebrate phylogeny revealed by coevolution of molecules and phylogenies, 140
- Hardison, 2001, Organization, evolution, and regulation of the globin genes, 95
- Ingermann, 1997, Vertebrate hemoglobins., 357
- Weber, 1990, Functional significance and structural basis of multiple hemoglobins with special reference to ectothermic vertebrates, 58
- Wells, 2009, Blood-gas transport and hemoglobin function: adaptations for functional and environmental hypoxia, 255
Cited by
Tørresen, O. K., Star, B., Mier, P., Andrade-Navarro, M. A., Bateman, A., Jarnot, P., Gruca, A., Grynberg, M., Kajava, A. V., Promponas, V. J., et al. (2019) · Nucleic Acids Research · doi:10.1093/nar/gkz841 · Cited by 347
Gene Turnover and Diversification of the α- and β-Globin Gene Families in Sauropsid Vertebrates
Hoffmann, F. G., Vandewege, M. W., Storz, J. F., & Opazo, J. C. (2018) · Genome Biology and Evolution · doi:10.1093/gbe/evy001 · Cited by 30
Self-citationA genomic compendium of hundreds of teleost fishes reveals their evolutionary landscape
Song, Y., Yuan, Z., Fang, C., Zhang, S., Yang, L., Hu, M., Seim, I., Liu, S., Tian, X., Wang, C., et al. (2026) · The Innovation · doi:10.1016/j.xinn.2025.101177 · Cited by 3
Metadata
- Authors
- Opazo, J. C., Butts, G. T., Nery, M. F., Storz, J. F., & Hoffmann, F. G.
- Venue
- Molecular Biology and Evolution
- Publisher
- Oxford University Press (OUP)
- Published
- 2012-10-16
- Volume
- 30
- Issue
- 1
- Pages
- 140-153
- ISSN
- 1537-1719
- 0737-4038
- PMC
- PMC3525417
- Cited by
- 98
- References
- 113
- Language
- en
About these checks
Registry, retraction, Cites and statistics results are computed, not judged, with one exception: a printed reference that no index lists is read once by a model before it counts as a citation error. Claims are extracted by a model and kept only when their quote appears verbatim in the text; each cited source is then checked, with a model’s help, for whether it says what the claim relies on. Those verdicts can be wrong — read the claim’s quote and the cited source before relying on one.
Statistics and arithmetic are recomputed, not judged.
Confidence bands are shown only for fields calibrated on our annotated test set. None is calibrated yet, so no band is shown.
What counts as a claim ›How we measure confidence ›How we check this ›
Are you an author, or do you see a problem with this page? Request a review
How to cite
Cite CoChat for the checks on this page, and the paper for its own findings.
- This page
- CoChat. (2026). Citation check: Whole-Genome Duplication and the Functional Diversification of Teleost Fish Hemoglobins. https://app.cochat.ai/papers/10.1093/molbev/mss212
- The paper
- Opazo, J. C., Butts, G. T., Nery, M. F., Storz, J. F., & Hoffmann, F. G. (2013). Whole-Genome Duplication and the Functional Diversification of Teleost Fish Hemoglobins. Molecular Biology and Evolution. https://doi.org/10.1093/molbev/mss212
Data sources
Bibliographic data: Semantic Scholar, OpenAlex, Crossref.
Contains information from the Semantic Scholar Academic Graph Datasets, made available under the ODC Attribution License (ODC-BY 1.0).
Semantic Scholar’s data is described in: Kinney, R., et al. (2023). The Semantic Scholar Open Data Platform. arXiv:2301.10140.
