

The DOI matches its Crossref record; 77 of the 77 references it cites were found in a registry or an index.
Harmonin homology domain-mediated interaction of RTEL1 helicase with RPA and DNA provides insights into its recruitment to DNA repair sites
Open accessPublished version of a preprint
Abstract
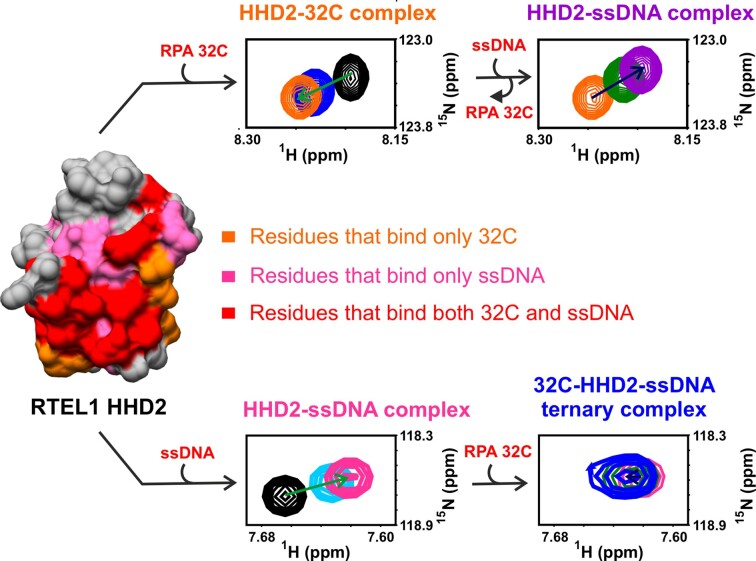
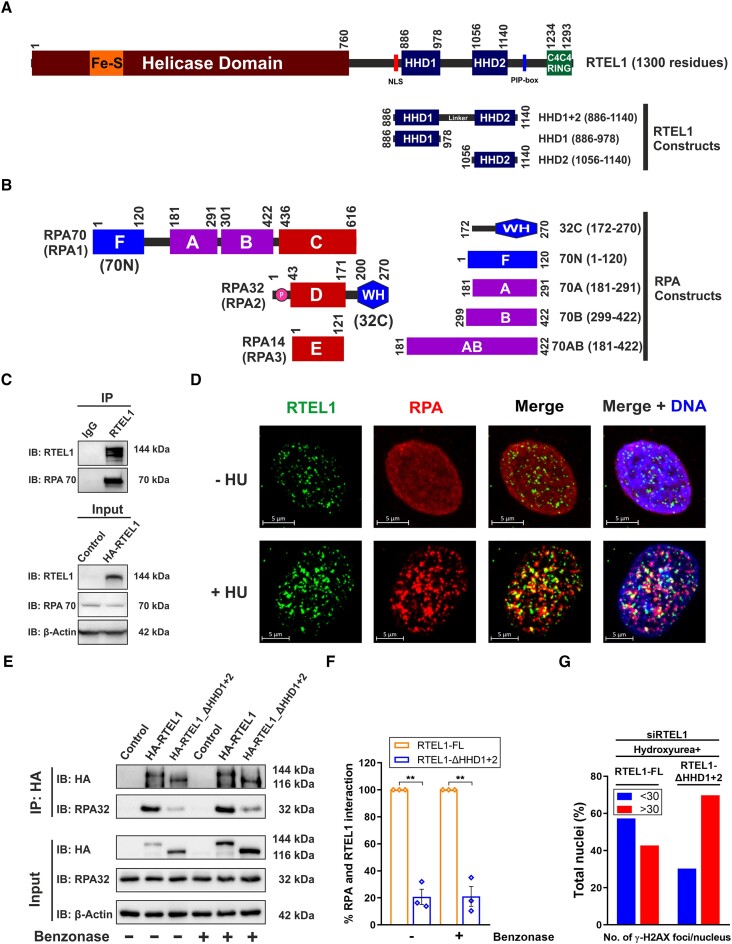
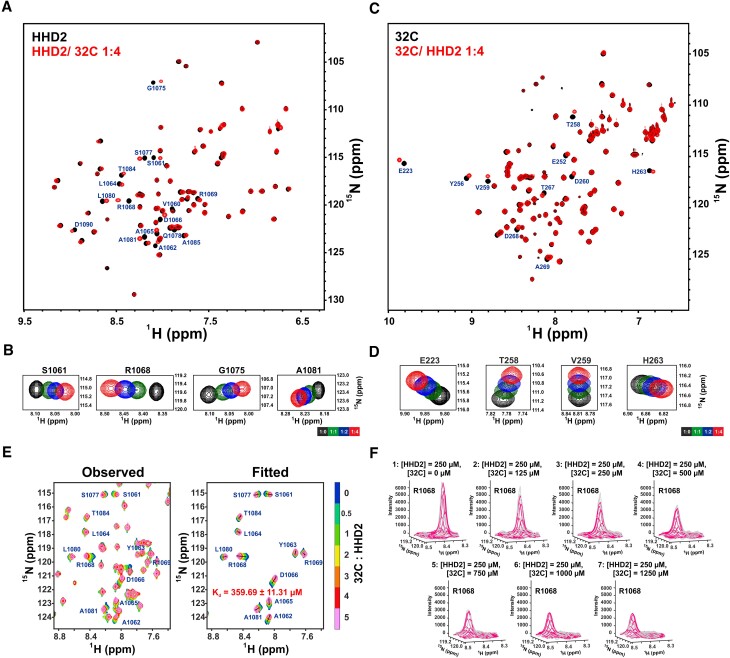
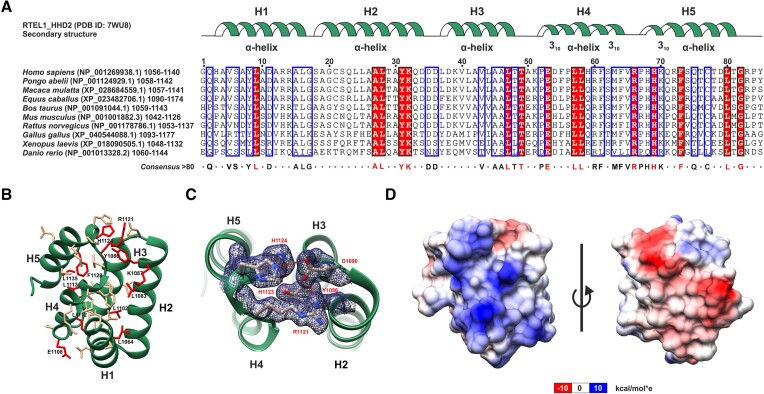
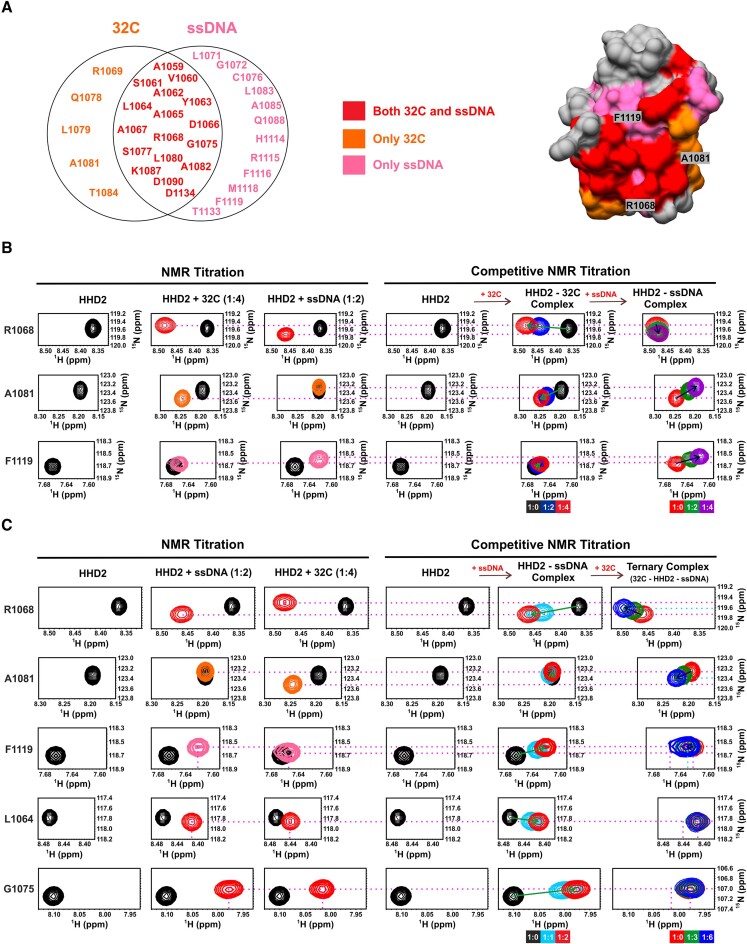
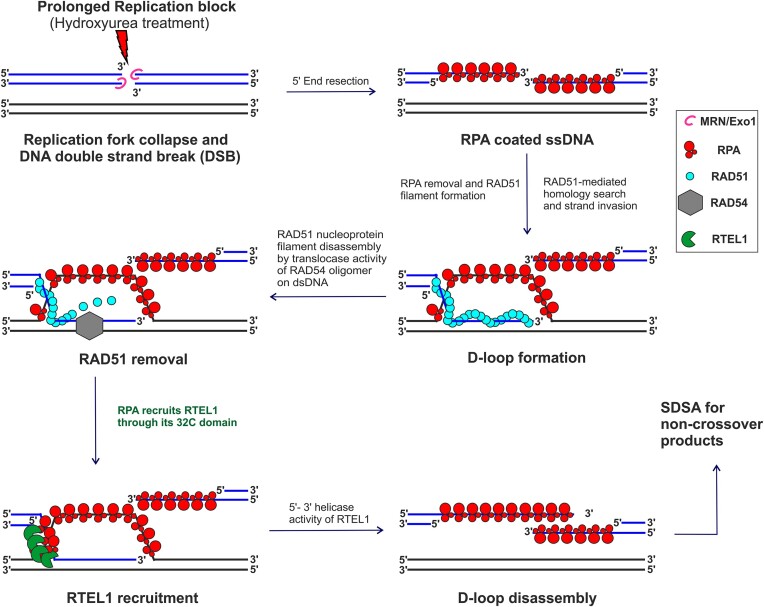
The regulator of telomere elongation helicase 1 (RTEL1) plays roles in telomere DNA maintenance, DNA repair, and genome stability by dismantling D-loops and unwinding G-quadruplex structures. RTEL1 comprises a helicase domain, two tandem harmonin homology domains 1&2 (HHD1 and HHD2), and a Zn2+-binding RING domain. In vitro D-loop disassembly by RTEL1 is enhanced in the presence of replication protein A (RPA). However, the mechanism of RTEL1 recruitment at non-telomeric D-loops remains unknown. In this study, we have unravelled a direct physical interaction between RTEL1 and RPA. Under DNA damage conditions, we showed that RTEL1 and RPA colocalise in the cell. Coimmunoprecipitation showed that RTEL1 and RPA interact, and the deletion of HHDs of RTEL1 significantly reduced this interaction. NMR chemical shift perturbations (CSPs) showed that RPA uses its 32C domain to interact with the HHD2 of RTEL1. Interestingly, HHD2 also interacted with DNA in the in vitro experiments. HHD2 structure was determined using X-ray crystallography, and NMR CSPs mapping revealed that both RPA 32C and DNA competitively bind to HHD2 on an overlapping surface. These results establish novel roles of accessory HHDs in RTEL1’s functions and provide mechanistic insights into the RPA-mediated recruitment of RTEL1 to DNA repair sites.
Overview
The claims and statistics of this paper haven’t been checked yet.
Run the check — free, no account needed. It reads the open-access text and checks the sources it cites.
Integrity signals
Registry
Cites
Statistics
Figures
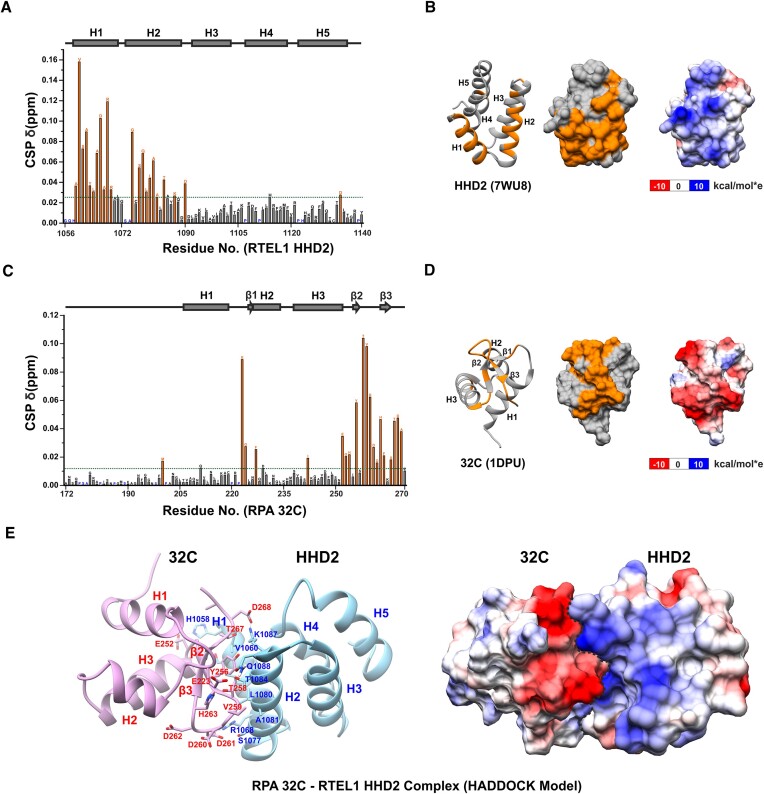
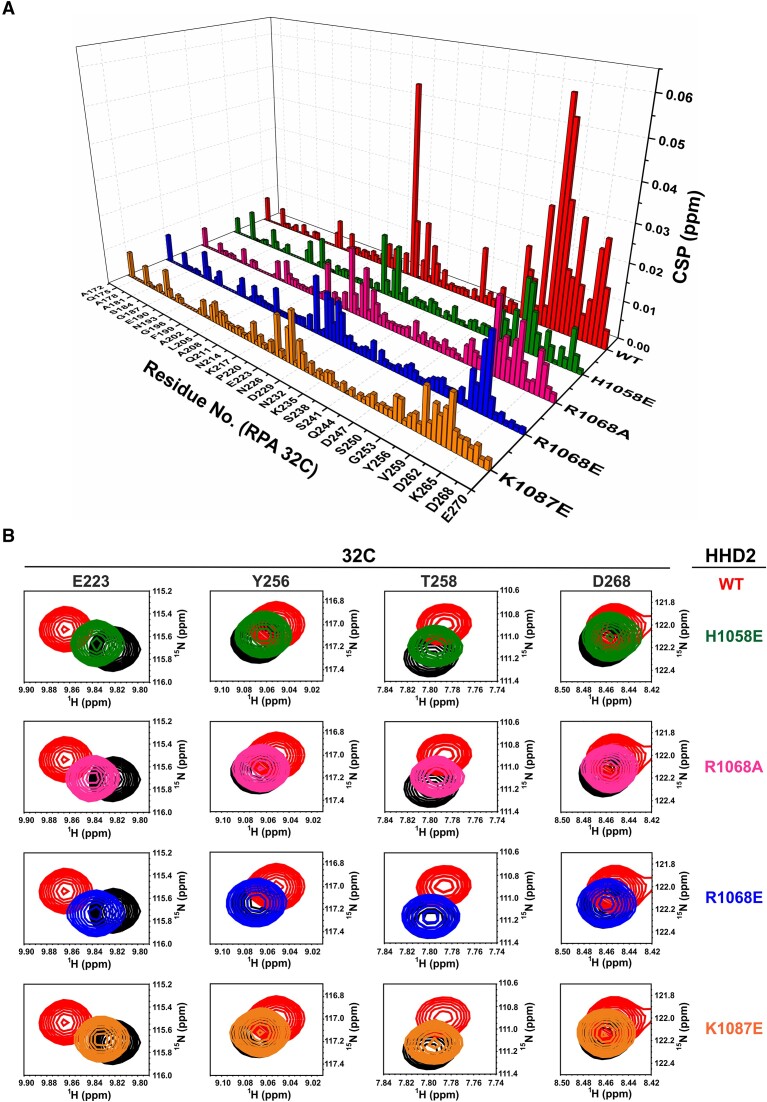
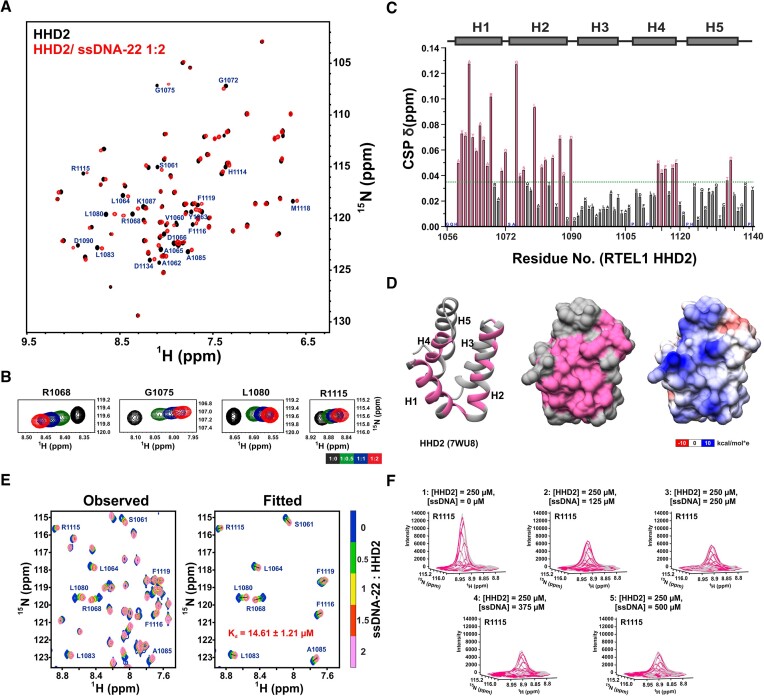
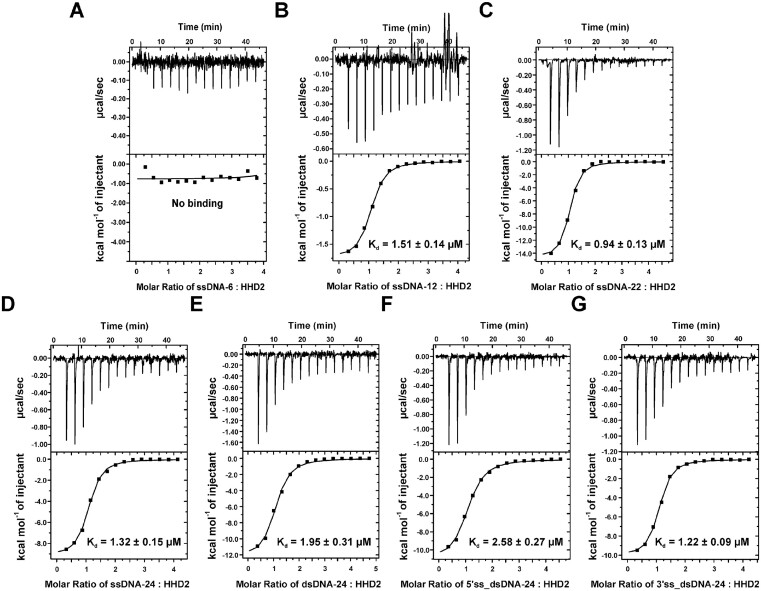
Verification
Claims the paper makes
The claims and statistics of this paper haven’t been checked yet.
Run the check — free, no account needed. It reads the open-access text and checks the sources it cites.
Self-check
Percentages, sums and reported differences re-computed from the paper’s own numbers.
The self-check needs the paper’s full text.
Citations
Cites
NIH Image to ImageJ: 25 years of image analysis
Schneider, C. A., Rasband, W. S., & Eliceiri, K. W. (2012) · Nature Methods · doi:10.1038/nmeth.2089 · Cited by 64,638
UCSF Chimera—A visualization system for exploratory research and analysis
Pettersen, E. F., Goddard, T. D., Huang, C. C., Couch, G. S., Greenblatt, D. M., Meng, E. C., & Ferrin, T. E. (2004) · Journal of Computational Chemistry · doi:10.1002/jcc.20084 · Cited by 45,828
Highly accurate protein structure prediction with AlphaFold
Jumper, J., Evans, R., Pritzel, A., Green, T., Figurnov, M., Ronneberger, O., Tunyasuvunakool, K., Bates, R., Žídek, A., Potapenko, A., et al. (2021) · Nature · doi:10.1038/s41586-021-03819-2 · Cited by 43,764
Coot : model-building tools for molecular graphics
Emsley, P., & Cowtan, K. (2004) · Acta Crystallographica Section D Biological Crystallography · doi:10.1107/s0907444904019158 · Cited by 30,571
PHENIX : a comprehensive Python-based system for macromolecular structure solution
Adams, P. D., Afonine, P. V., Bunkóczi, G., Chen, V. B., Davis, I. W., Echols, N., Headd, J. J., Hung, L.-W., Kapral, G. J., Grosse-Kunstleve, R. W., et al. (2010) · Acta Crystallographica Section D Biological Crystallography · doi:10.1107/s0907444909052925 · Cited by 23,716
Phaser crystallographic software
McCoy, A. J., Grosse-Kunstleve, R. W., Adams, P. D., Winn, M. D., Storoni, L. C., & Read, R. J. (2007) · Journal of Applied Crystallography · doi:10.1107/s0021889807021206 · Cited by 20,612
Fast, scalable generation of high‐quality protein multiple sequence alignments using Clustal Omega
Sievers, F., Wilm, A., Dineen, D. G., Gibson, T. J., Karplus, K. J., Li, W., López, R., McWilliam, H., Remmert, M., Söding, J., et al. (2011) · Molecular Systems Biology · doi:10.1038/msb.2011.75 · Cited by 15,487
MolProbity : all-atom structure validation for macromolecular crystallography
Chen, V. B., Arendall, W. B., Headd, J. J., Keedy, D. A., Immormino, R. M., Kapral, G. J., Murray, L. W., Richardson, J. S., & Richardson, D. C. (2010) · Acta Crystallographica Section D Biological Crystallography · doi:10.1107/s0907444909042073 · Cited by 14,115
REFMAC 5 for the refinement of macromolecular crystal structures
Murshudov, G. N., Skubák, P., Lebedev, A. A., Pannu, N. S., Steiner, R. A., Nicholls, R. A., Winn, M., Long, F., & Vagin, A. A. (2011) · Acta Crystallographica Section D Biological Crystallography · doi:10.1107/s0907444911001314 · Cited by 8,416
Protein Identification and Analysis Tools in the ExPASy Server
Wilkins, M. R., Gasteiger, E., Bairoch, A., Sanchez, J., Williams, K. L., Appel, R. D., & Hochstrasser, D. F. (2003) · Humana Press eBooks · doi:10.1385/1-59259-584-7:531 · Cited by 6,244
Multiple sequence alignment with hierarchical clustering.
Corpet, F. (1988) · Nucleic Acids Research · doi:10.1093/nar/16.22.10881 · Cited by 5,575
The HADDOCK2.2 Web Server: User-Friendly Integrative Modeling of Biomolecular Complexes
van Zundert, G. C. P., Rodrigues, J. P. G. L. M., Trellet, M., Schmitz, C., Kastritis, P. L., Karaca, E., Melquiond, A. S. J., van Dijk, M., de Vries, S. J., & Bonvin, A. M. J. J. (2016) · Journal of Molecular Biology · doi:10.1016/j.jmb.2015.09.014 · Cited by 2,785
NMRFAM-SPARKY: enhanced software for biomolecular NMR spectroscopy
Lee, W., Tonelli, M., & Markley, J. L. (2014) · Bioinformatics · doi:10.1093/bioinformatics/btu830 · Cited by 2,045
Oughtred, R., Rust, J., Chang, C., Breitkreutz, B., Stark, C., Willems, A., Boucher, L., Leung, G., Kolas, N., Zhang, F., et al. (2021) · Protein Science · doi:10.1002/pro.3978 · Cited by 1,858
Wold, M. S. (1997) · Annual Review of Biochemistry · doi:10.1146/annurev.biochem.66.1.61 · Cited by 1,490
Homologous recombination in DNA repair and DNA damage tolerance
Li, X., & Heyer, W. (2008) · Cell Research · doi:10.1038/cr.2008.1 · Cited by 1,264
Homologous recombination and its regulation
Krejčí, L., Altmannová, V., Spirek, M., & Zhao, X. (2012) · Nucleic Acids Research · doi:10.1093/nar/gks270 · Cited by 708
Recombinant replication protein A: expression, complex formation, and functional characterization
Henricksen, L. A., Umbricht, C. B., & Wold, M. S. (1994) · Journal of Biological Chemistry · doi:10.1016/s0021-9258(19)78100-9 · Cited by 597
A dynamic model for replication protein A (RPA) function in DNA processing pathways
Fanning, E., Klimovich, V., & Nager, A. R. (2006) · Nucleic Acids Research · doi:10.1093/nar/gkl550 · Cited by 591
Erdős, G., Pajkos, M., & Dosztányi, Z. (2021) · Nucleic Acids Res. · doi:10.1093/nar/gkab408 · Cited by 560
Human RecQ Helicases in DNA Repair, Recombination, and Replication
Croteau, D. L., Popuri, V., Opresko, P. L., & Bohr, V. A. (2014) · Annual Review of Biochemistry · doi:10.1146/annurev-biochem-060713-035428 · Cited by 558
Exploiting heterogeneous sequence properties improves prediction of protein disorder
Obradovic, Z., Peng, K., Vucetic, S., Radivojac, P., & Dunker, A. K. (2005) · Proteins: Structure, Function, and Bioinformatics · doi:10.1002/prot.20735 · Cited by 555
RTEL1 Dismantles T Loops and Counteracts Telomeric G4-DNA to Maintain Telomere Integrity
Vannier, J., Pavicic-Kaltenbrunner, V., Petalcorin, M. I. R., Ding, H., & Boulton, S. J. (2012) · Cell · doi:10.1016/j.cell.2012.03.030 · Cited by 500
Stuart, B. D., Choi, J., Zaidi, S., Xing, C., Holohan, B., Chen, R., Choi, M., Dharwadkar, P., Torres, F., Girod, C. E., et al. (2015) · Nature Genetics · doi:10.1038/ng.3278 · Cited by 469
T-loops and the origin of telomeres
de Lange, T. (2004) · Nature Reviews Molecular Cell Biology · doi:10.1038/nrm1359 · Cited by 461
RTEL1 Maintains Genomic Stability by Suppressing Homologous Recombination
Barber, L. J., Youds, J. L., Ward, J. D., McIlwraith, M. J., O'Neil, N. J., Petalcorin, M. I. R., Martin, J. S., Collis, S. J., Cantor, S. B., Auclair, M., et al. (2008) · Cell · doi:10.1016/j.cell.2008.08.016 · Cited by 369
Sparta, K. M., Krug, M., Heinemann, U., Müeller, U., & Weiss, M. S. (2016) · Journal of Applied Crystallography · doi:10.1107/s1600576716004416 · Cited by 293
Replication protein A: Single‐stranded DNA's first responder
Chen, R., & Wold, M. S. (2014) · BioEssays · doi:10.1002/bies.201400107 · Cited by 281
Single-stranded DNA mimicry in the p53 transactivation domain interaction with replication protein A
Bochkareva, E. S., Kaustov, L., Ayed, A., Yi, G., Lü, Y., Pineda‐Lucena, A., Liao, J. C. C., Okorokov, A. L., Milner, J., Arrowsmith, C. H., et al. (2005) · Proceedings of the National Academy of Sciences · doi:10.1073/pnas.0504614102 · Cited by 279
Maréchal, A., Li, J.-M., Ji, X. Y., Wu, C.-S. P., Yazinski, S. A., Nguyen, H. D., Liu, S., Jiménez, A. E., Jin, J., & Zou, L. (2013) · Molecular Cell · doi:10.1016/j.molcel.2013.11.002 · Cited by 262
Constitutional Mutations in RTEL1 Cause Severe Dyskeratosis Congenita
Walne, A. J., Vulliamy, T., Kirwan, M., Plagnol, V., & Dokal, I. S. (2013) · The American Journal of Human Genetics · doi:10.1016/j.ajhg.2013.02.001 · Cited by 243
RTEL1 Is a Replisome-Associated Helicase That Promotes Telomere and Genome-Wide Replication
Vannier, J., Sandhu, S., Petalcorin, M. I. R., Wu, X., Nabi, Z., Ding, H., & Boulton, S. J. (2013) · Science · doi:10.1126/science.1241779 · Cited by 235
Two-Dimensional NMR Lineshape Analysis
Waudby, C. A., Ramos, A., Cabrita, L. D., & Christodoulou, J. C. (2016) · Scientific Reports · doi:10.1038/srep24826 · Cited by 216
TRF2 Recruits RTEL1 to Telomeres in S Phase to Promote T-Loop Unwinding
Sarek, G., Vannier, J., Panier, S., Petrini, J. H. J., & Boulton, S. J. (2015) · Molecular Cell · doi:10.1016/j.molcel.2014.12.024 · Cited by 194
RTEL-1 Enforces Meiotic Crossover Interference and Homeostasis
Youds, J. L., Mets, D. G., McIlwraith, M. J., Martin, J. S., Ward, J. D., O’Neil, N. J., Rose, A. M., West, S. C., Meyer, B. J., & Boulton, S. J. (2010) · Science · doi:10.1126/science.1183112 · Cited by 186
The CMG Helicase Bypasses DNA-Protein Cross-Links to Facilitate Their Repair
Sparks, J. L., Chistol, G., Gao, A. O., Räschle, M., Larsen, N. B., Mann, M., Duxin, J. P., & Walter, J. C. (2018) · Cell · doi:10.1016/j.cell.2018.10.053 · Cited by 183
Deng, Z., Glousker, G., Molczan, A., Fox, A. J., Lamm, N., Dheekollu, J., Weizman, O.-E., Schertzer, M. J., Wang, Z., Vladimirova, O. V., et al. (2013) · Proceedings of the National Academy of Sciences · doi:10.1073/pnas.1300600110 · Cited by 176
Young, J. Y., Westbrook, J., Feng, Z., Sala, R., Peisach, E., Oldfield, T. J., Sen, S., Gutmanas, A., Armstrong, D. R., Berrisford, J. M., et al. (2017) · Structure · doi:10.1016/j.str.2017.01.004 · Cited by 164
Weak protein–protein interactions as probed by NMR spectroscopy
Vaynberg, J., & Qin, J. (2005) · Trends in biotechnology · doi:10.1016/j.tibtech.2005.09.006 · Cited by 163
A cell is more than the sum of its (dilute) parts: A brief history of quinary structure
Cohen, R. D., & Pielak, G. J. (2016) · Protein Science · doi:10.1002/pro.3092 · Cited by 141
Replication protein A: a multifunctional protein with roles in DNA replication, repair and beyond
Dueva, R., & Iliakis, G. E. (2020) · NAR Cancer · doi:10.1093/narcan/zcaa022 · Cited by 141
RTEL1: functions of a disease-associated helicase
Vannier, J., Sarek, G., & Boulton, S. J. (2014) · Trends in Cell Biology · doi:10.1016/j.tcb.2014.01.004 · Cited by 140
Weak protein–protein interactions in live cells are quantified by cell-volume modulation
Sukenik, S., Ren, P., & Gruebele, M. (2017) · Proceedings of the National Academy of Sciences · doi:10.1073/pnas.1700818114 · Cited by 135
RTEL1: an essential helicase for telomere maintenance and the regulation of homologous recombination
Uringa, E.-J., Youds, J. L., Lisaingo, K., Lansdorp, P. M., & Boulton, S. J. (2010) · Nucleic Acids Research · doi:10.1093/nar/gkq1045 · Cited by 134
RTEL1 contributes to DNA replication and repair and telomere maintenance
Uringa, E.-J., Lisaingo, K., Pickett, H. A., Brind’Amour, J., Rohde, J.-H., Zelensky, A. N., Essers, J., & Lansdorp, P. M. (2012) · Molecular Biology of the Cell · doi:10.1091/mbc.e12-03-0179 · Cited by 133
Stauffer, M. E., & Chazin, W. (2004) · Journal of Biological Chemistry · doi:10.1074/jbc.m400029200 · Cited by 111
Caldwell, C. C., & Spies, M. (2020) · Critical Reviews in Biochemistry and Molecular Biology · doi:10.1080/10409238.2020.1813070 · Cited by 106
Dynamics and selective remodeling of the DNA-binding domains of RPA
Pokhrel, N., Caldwell, C. C., Corless, E. I., Tillison, E. A., Tibbs, J., Bonde, N. J., Tabei, S. M. A., Wold, M. S., Spies, M., & Antony, E. (2019) · Nature Structural & Molecular Biology · doi:10.1038/s41594-018-0181-y · Cited by 100
Rad54 protein stimulates the postsynaptic phase of Rad51 protein-mediated DNA strand exchange
Solinger, J. A., & Heyer, W. (2001) · Proceedings of the National Academy of Sciences · doi:10.1073/pnas.121009898 · Cited by 98
Ward, J. D., Muzzini, D. M., Petalcorin, M. I. R., Martínez-Pérez, E., Martin, J. S., Plevani, P., Cassata, G., Marini, F., & Boulton, S. J. (2010) · Molecular Cell · doi:10.1016/j.molcel.2009.12.026 · Cited by 97
The Rad51-dependent Pairing of Long DNA Substrates Is Stabilized by Replication Protein A
Eggler, A. L., Inman, R. B., & Cox, M. M. (2002) · Journal of Biological Chemistry · doi:10.1074/jbc.m204328200 · Cited by 97
RTEL1 suppresses G-quadruplex-associated R-loops at difficult-to-replicate loci in the human genome
Wu, W., Bhowmick, R., Vogel, I., Özer, Ö., Ghisays, F., Thakur, R. S., León, E., Richter, P. H., Ren, L., Petrini, J. H. J., et al. (2020) · Nature Structural & Molecular Biology · doi:10.1038/s41594-020-0408-6 · Cited by 97
A new structural framework for integrating replication protein A into DNA processing machinery
Brosey, C. A., Yan, C., Tsutakawa, S. E., Heller, W. T., Rambo, R. P., Tainer, J. A., Ivanov, I. N., & Chazin, W. (2013) · Nucleic Acids Research · doi:10.1093/nar/gks1332 · Cited by 93
Structural Mechanisms of DNA Replication, Repair, and Recombination
Stauffer, M. E., & Chazin, W. (2004) · Journal of Biological Chemistry · doi:10.1074/jbc.r400015200 · Cited by 88
Functional Assays for Replication Protein A (RPA)
Binz, S. K., Dickson, A. M., Haring, S. J., & Wold, M. S. (2006) · Methods in enzymology on CD-ROM/Methods in enzymology · doi:10.1016/s0076-6879(05)09002-6 · Cited by 86
SLX4 interacts with RTEL1 to prevent transcription-mediated DNA replication perturbations
Takedachi, A., Despras, E., Scaglione, S., Guérois, R., Guervilly, J.-H., Blin, M., Audebert, S., Camoin, L., Hašanová, Z., Schertzer, M. J., et al. (2020) · Nature Structural & Molecular Biology · doi:10.1038/s41594-020-0419-3 · Cited by 62
Structure and function of the regulatory HRDC domain from human Bloom syndrome protein
Kim, Y., & Choi, B. (2010) · Nucleic Acids Research · doi:10.1093/nar/gkq586 · Cited by 44
Characteristics and concepts of dynamic hub proteins in DNA processing machinery from studies of RPA
Sugitani, N., & Chazin, W. (2014) · Progress in Biophysics and Molecular Biology · doi:10.1016/j.pbiomolbio.2014.12.001 · Cited by 36
Faure, G., Revy, P., Schertzer, M. J., Londoño‐Vallejo, A., & Callebaut, I. (2013) · Proteins Structure Function and Bioinformatics · doi:10.1002/prot.24438 · Cited by 36
Awate, S., & Brosh, R. M. (2017) · International Journal of Molecular Sciences · doi:10.3390/ijms18061233 · Cited by 35
Kim, M., Kim, H.-S., D’Souza, A., Gallagher, K., Jeong, E., Topolska‐Woś, A. M., Meur, K. V. L., Tsai, C.-L., Tsai, M.-S., Kee, M., et al. (2022) · Proceedings of the National Academy of Sciences · doi:10.1073/pnas.2207408119 · Cited by 34
Estep, K. N., & Brosh, R. M. (2017) · Biochemical Society Transactions · doi:10.1042/bst20170044 · Cited by 30
Coordinated roles of SLX4 and MutSβ in DNA repair and the maintenance of genome stability
Young, S. J., & West, S. C. (2021) · Critical Reviews in Biochemistry and Molecular Biology · doi:10.1080/10409238.2021.1881433 · Cited by 27
Jullien, L., Kannengiesser, C., Kermasson, L., Cormier‐Daire, V., Leblanc, T. M., Soulier, J., Londoño‐Vallejo, A., de Villartay, J., Callebaut, I., & Revy, P. (2016) · Human Mutation · doi:10.1002/humu.22966 · Cited by 23
αα-Hub domains and intrinsically disordered proteins: A decisive combo
Bugge, K., Staby, L., Salladini, E., Falbe-Hansen, R. G., Kragelund, B. B., & Skriver, K. (2020) · Journal of Biological Chemistry · doi:10.1074/jbc.rev120.012928 · Cited by 23
Interaction of replication protein A with two acidic peptides from human Bloom syndrome protein
Kang, D., Lee, S., Ryu, K., Cheong, H., Kim, E., & Park, C. (2018) · FEBS Letters · doi:10.1002/1873-3468.12992 · Cited by 22
Teng, F., Wang, T., Guo, H., Xin, B.-G., Sun, B., Dou, S., Xi, X., & Hou, X. (2020) · Journal of Biological Chemistry · doi:10.1074/jbc.ra120.015492 · Cited by 17
DNA helicases in homologous recombination repair
Branzei, D., & Szakál, B. (2021) · Current Opinion in Genetics & Development · doi:10.1016/j.gde.2021.06.009 · Cited by 15
Connecting the αα-hubs: same fold, disordered ligands, new functions
Staby, L., Bugge, K., Falbe-Hansen, R. G., Salladini, E., Skriver, K., & Kragelund, B. B. (2021) · Cell Communication and Signaling · doi:10.1186/s12964-020-00686-8 · Cited by 10
Bhattacharya, S., Arunkumar, A. I., Sullivan, S. L., Botuyan, M. V., Arrowsmith, C. H., & Chazin, W. (2004) · Journal of Biomolecular NMR · doi:10.1023/b:jnmr.0000013818.02364.3a · Cited by 9
Yeom, G., Kim, J., & Park, C. (2019) · Scientific Reports · doi:10.1038/s41598-019-50502-8 · Cited by 9
Lin, L., Wang, H., Ren, D., Xia, Y., He, G., & Lü, Q. (2021) · Frontiers in Cell and Developmental Biology · doi:10.3389/fcell.2021.642666 · Cited by 9
Bhattacharya, S., Arunkumar, A. I., Sullivan, S. L., Botuyan, M. V., Arrowsmith, C. H., & Chazin, W. (2004) · Biological Magnetic Resonance Bank · doi:10.13018/bmr5823 · Cited by 7
Mer, G., Edwards, A. M., & Chazin, W. (2000) · Journal of Biomolecular NMR · doi:10.1023/a:1008306832408 · Cited by 6
Phylogenetic analysis of Harmonin homology domains
Colcombet-Cazenave, B., Druart, K., Bonnet, C., Petit, C., Spérandio, O., Guglielmini, J., & Wolff, N. (2021) · BMC Bioinformatics · doi:10.1186/s12859-021-04116-5 · Cited by 6
Backbone Assignment of the N-terminal Domain of Human Replication Protein A 70 kDa
Lee, S., & Park, C. (2016) · Journal of the Korean Magnetic Resonance Society · doi:10.6564/jkmrs.2016.20.4.138 · Cited by 3
Resonance assignment and secondary structure of the tandem harmonin homology domains of human RTEL1
Kumar, N. M. A., Ghosh, M., Parthasarathy, M., Basak, S., Akula, D., & Singh, M. (2022) · Biomolecular NMR Assignments · doi:10.1007/s12104-022-10074-7 · Cited by 2
Self-citation
Metadata
- Authors
- Kumar, N., Taneja, A., Ghosh, M., Rothweiler, U., Sundaresan, N. R., & Singh, M.
- Affiliations
- Indian Institute of Science Bangalore (IN)
- UiT The Arctic University of Norway (NO)
- Corresponding author
- Singh, Mahavir
- ORCID
- Venue
- Nucleic Acids Research
- Publisher
- Oxford University Press (OUP)
- Published
- 2023-12-28
- Volume
- 52
- Issue
- 3
- Pages
- 1450-1470
- ISSN
- 0305-1048 (ISSN-L)
- 1362-4962
- PMC
- PMC10853778
- OpenAlex
- W4390311654
- Cited by
- 12
- References
- 77
- Citations by year
- 2026: 2 · 2025: 5 · 2024: 4 · 2023: 1
- FWCI
- 1.07
- Type
- journal article
- Language
- en
- Open access
- gold
- doi.org
- Licence
- Locations
- Nucleic Acids Research (publishedVersion, cc-by)
- bioRxiv (Cold Spring Harbor Laboratory) (acceptedVersion)
- PubMed Central (publishedVersion, cc-by)
- PubMed (publishedVersion)
- NOT FOUND REPOSITORY (Indian Institute of Science Bangalore) (acceptedVersion)
- NORA - Norwegian Open Research Archives (submittedVersion, cc-by)
- Funders
- Department of Biotechnology (BT/PR15829/BRB/10/1469/2015)
- Ramalingaswami Fellowship (BT/RLF/Re-entry/23/2013, STR/2021/000 015)
- Science and Engineering Research Board
- Topics
- Life Sciences › Biochemistry, Genetics and Molecular Biology › Molecular Biology › DNA Repair Mechanisms
- Life Sciences › Biochemistry, Genetics and Molecular Biology › Molecular Biology › DNA and Nucleic Acid Chemistry
- Life Sciences › Biochemistry, Genetics and Molecular Biology › Cell Biology › Telomeres, Telomerase, and Senescence
- Keywords
- RTEL1, RPA, DNA repair, telomere maintenance, protein-DNA interactions, protein-protein interaction, RING domain, DNA damage response, genome stability
- MeSH terms
- DNA, DNA Repair, DNA Replication, DNA Helicases, Humans, Telomere, Replication Protein A
About these checks
Registry, retraction, Cites and statistics results are computed, not judged, with one exception: a printed reference that no index lists is read once by a model before it counts as a citation error. Claims are extracted by a model and kept only when their quote appears verbatim in the text; each cited source is then checked, with a model’s help, for whether it says what the claim relies on. Those verdicts can be wrong — read the claim’s quote and the cited source before relying on one.
Statistics and arithmetic are recomputed, not judged.
Confidence bands are shown only for fields calibrated on our annotated test set. None is calibrated yet, so no band is shown.
What counts as a claim ›How we measure confidence ›How we check this ›
Are you an author, or do you see a problem with this page? Request a review
Data sources
Bibliographic data: Semantic Scholar, OpenAlex, Crossref.
Contains information from the Semantic Scholar Academic Graph Datasets, made available under the ODC Attribution License (ODC-BY 1.0).
Semantic Scholar’s data is described in: Kinney, R., et al. (2023). The Semantic Scholar Open Data Platform. arXiv:2301.10140.
