

The DOI matches its Crossref record; 4 of the 4 references it cites were found in a registry or an index.
Mutation rates and the evolution of germline structure
Published version of a preprint
Abstract
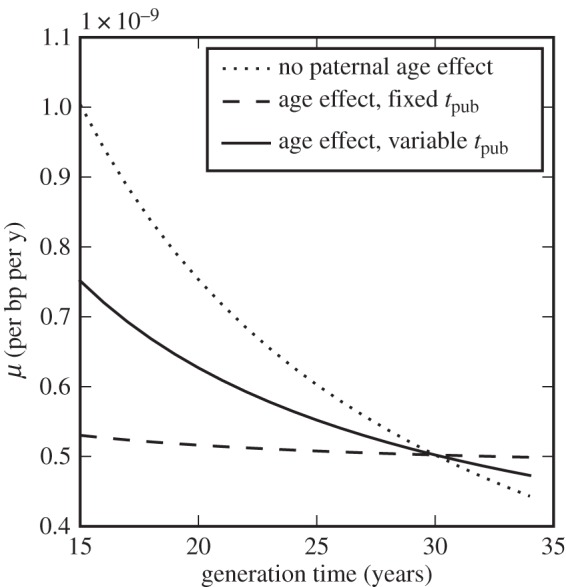
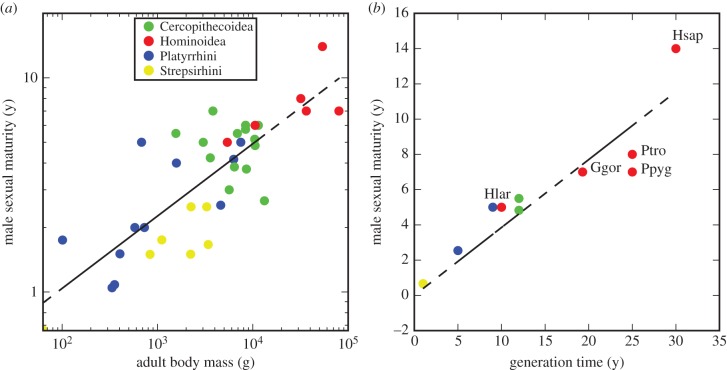
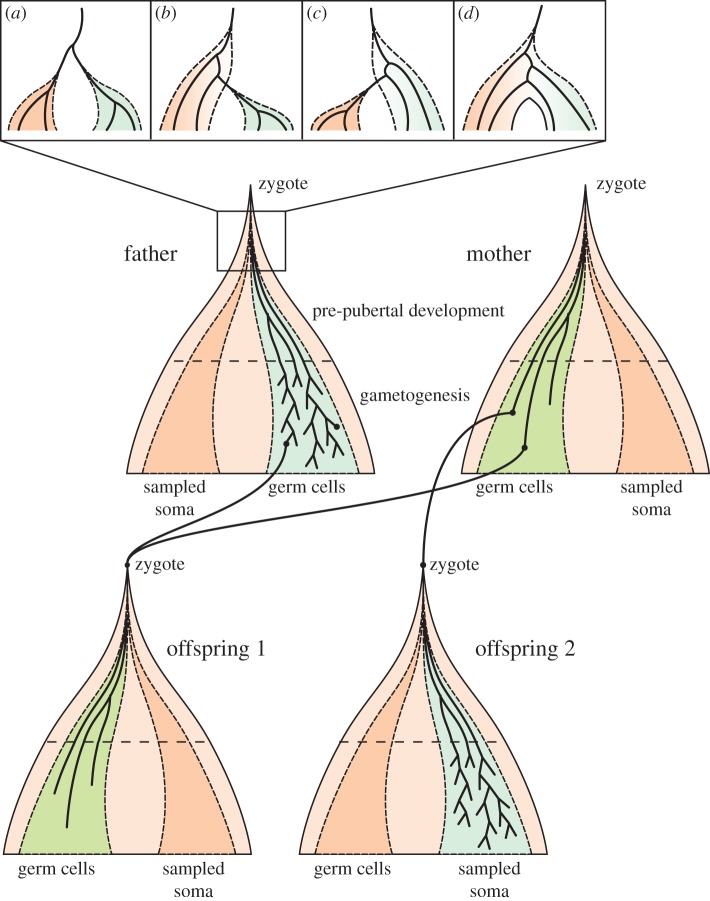
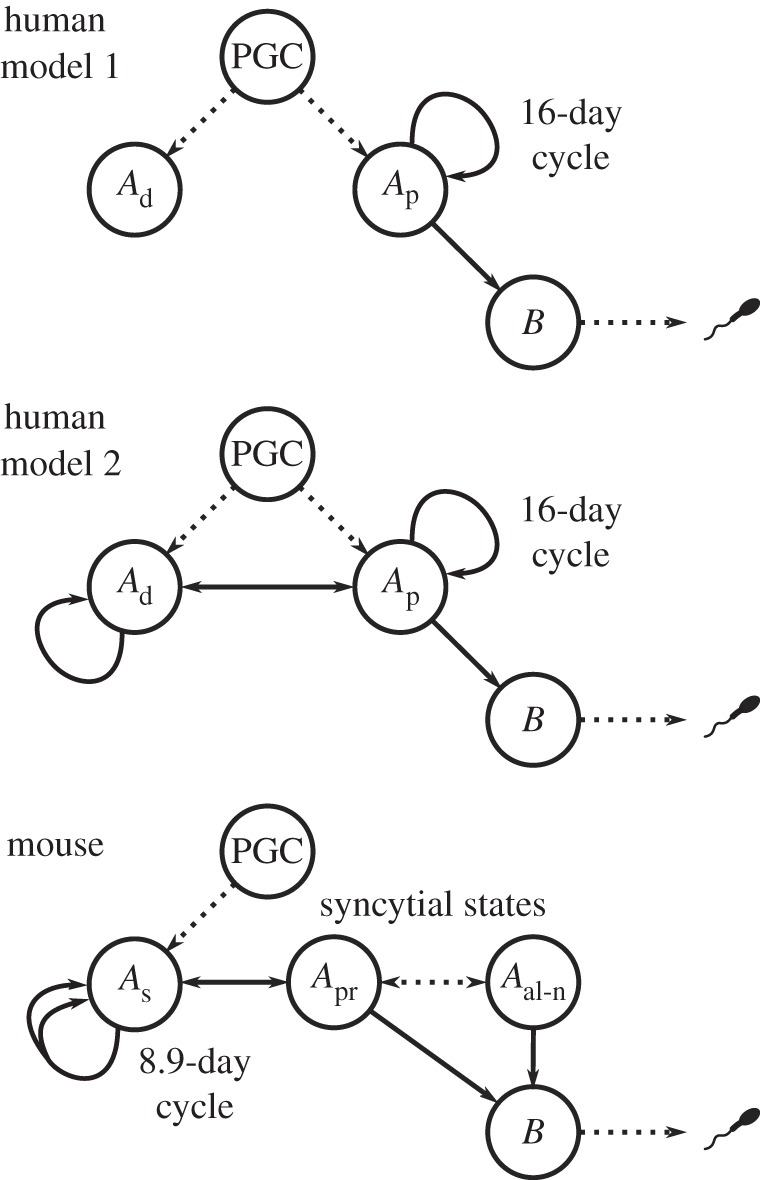
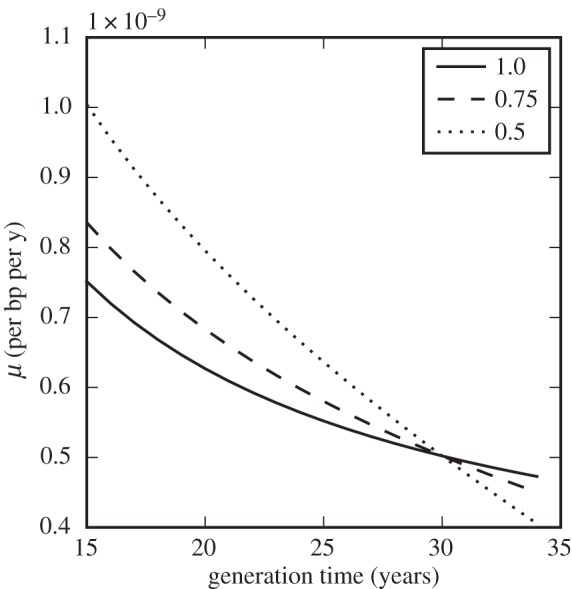
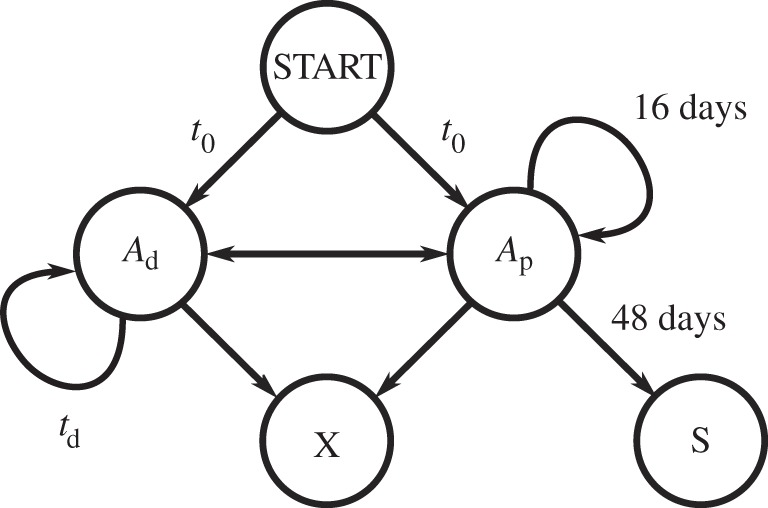
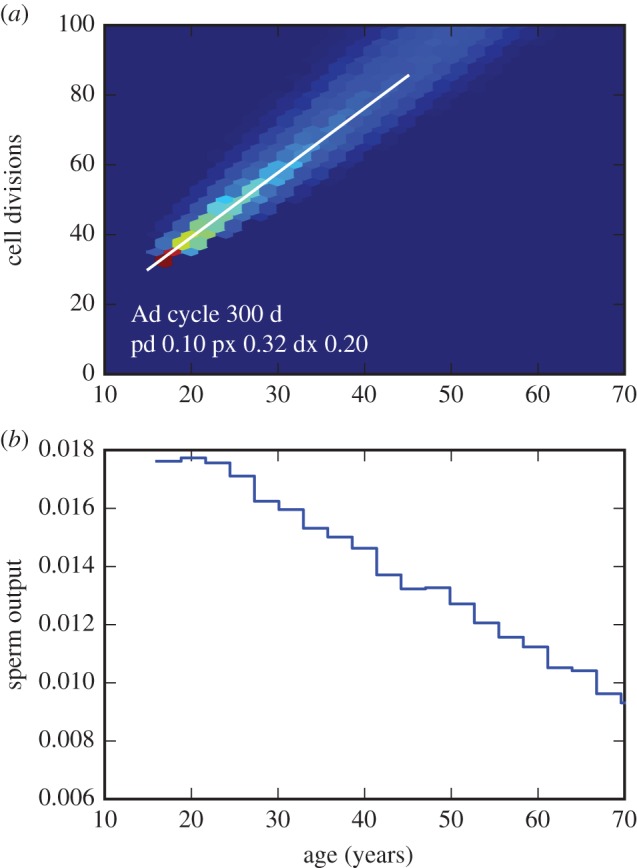
Genome sequencing studies of de novo mutations in humans have revealed surprising incongruities in our understanding of human germline mutation. In particular, the mutation rate observed in modern humans is substantially lower than that estimated from calibration against the fossil record, and the paternal age effect in mutations transmitted to offspring is much weaker than expected from our long-standing model of spermatogenesis. I consider possible explanations for these discrepancies, including evolutionary changes in life-history parameters such as generation time and the age of puberty, a possible contribution from undetected post-zygotic mutations early in embryo development, and changes in cellular mutation processes at different stages of the germline. I suggest a revised model of stem-cell state transitions during spermatogenesis, in which ‘dark’ gonial stem cells play a more active role than hitherto envisaged, with a long cycle time undetected in experimental observations. More generally, I argue that the mutation rate and its evolution depend intimately on the structure of the germline in humans and other primates. This article is part of the themed issue ‘Dating species divergences using rocks and clocks'.
Overview
The claims and statistics of this paper haven’t been checked yet.
Run the check — free, no account needed. It reads the open-access text and checks the sources it cites.
Integrity signals
Registry
Cites
Statistics
Figures
Verification
Claims the paper makes
The claims and statistics of this paper haven’t been checked yet.
Run the check — free, no account needed. It reads the open-access text and checks the sources it cites.
Claims other papers make about this one
Each is checked against this paper’s own text: does it say what the citing paper says it does?
The cited source says what the claim attributes to it.
In the citing paper
“Mutations are occurring constantly, both in somatic and germline cells (Scally 2016).”
From Initial heritable genome editing: mapping a responsible pathway from basic research to the clinic (2023) · cites this paper as Scally 2016
The cited source says what the claim attributes to it.
In the citing paper
“However, a complete absence of mutations is not a situation normally found in living cells, embryonic or somatic.”
From Initial heritable genome editing: mapping a responsible pathway from basic research to the clinic (2023) · cites this paper as Scally 2016
Self-check
Percentages, sums and reported differences re-computed from the paper’s own numbers.
The self-check needs the paper’s full text.
Citations
Cites
Rate of de novo mutations and the importance of father’s age to disease risk
Kong, A., Frigge, M. L., Masson, G., Besenbacher, S., Sulem, P., Magnusson, G., Gudjonsson, S. A., Sigurdsson, A., Jonasdottir, A., Jonasdottir, A., et al. (2012) · Nature · doi:10.1038/nature11396 · Cited by 2,134
Genome sequence of a 45,000-year-old modern human from western Siberia
Fu, Q., Li, H., Moorjani, P., Jay, F., Slepchenko, S. M., Bondarev, A. A., Johnson, P. L. F., Aximu-Petri, A., Prüfer, K., de Filippo, C., et al. (2014) · Nature · doi:10.1038/nature13810 · Cited by 1,023
Revising the human mutation rate: implications for understanding human evolution
Scally, A., & Durbin, R. (2012) · Nature Reviews Genetics · doi:10.1038/nrg3295 · Cited by 610
Self-citationEstimating the human mutation rate using autozygosity in a founder population.
Campbell, C. D., Chong, J. X., Malig, M., Ko, A., Dumont, B. L., Han, L., Vives, L., O'Roak, B. J., Sudmant, P. H., Shendure, J., et al. (2012) · Nature Genetics · doi:10.1038/ng.2418 · Cited by 215
Research works printed but not linked: 66
- 10.1016/j.tig.2010.05.003 · DOI
- 10.1007/BF02717892 · DOI
- 10.1007/BF02717891 · DOI
- 10.1146/annurev-genom-031714-125740 · DOI · Paper page
- 10.1038/nature13679 · DOI
- 10.1038/nature12161 · DOI
- 10.1038/ng.3015 · DOI · Paper page
- 10.1073/pnas.82.6.1741 · DOI
- 10.1111/j.1558-5646.2011.01337.x · DOI
- Fleagle JG, 1998, Primate adaptation and evolution
- 10.1016/j.cub.2011.08.025 · DOI
- 10.1093/gerona/62.2.149 · DOI
- 10.1038/ng.2398 · DOI
- 10.1098/rspb.2014.2898 · DOI
- Saltzman W, 2011, Hormones and reproduction of vertebrates, 291
- Kingsley SR, 1988, Orang-utan biology, 123
- 10.1073/pnas.1211740109 · DOI
- Molur S Brandon-Jones DW. Dittus W Eudey A Kumar A Singh M et al. 2003 Status of South Asian primates: Conservation Assessment and Management Plan (C.A.M.P.) workshop report p. viii+432.
- 10.1002/(SICI)1098-2345(1996)38:2<157::AID-AJP4>3.0.CO;2-Y · DOI
- 10.1007/s10592-008-9584-3 · DOI
- 10.1016/B978-0-12-381365-7.00008-X · DOI
- 10.1186/1471-2148-10-105 · DOI
- 10.1016/j.yrtph.2012.05.003 · DOI
- 10.1002/em.2850250609 · DOI
- 10.1038/35049558 · DOI · Paper page
- 10.1016/j.ajhg.2015.05.008 · DOI
- Harland C, 2015, Biology of genomes
- 10.1038/nm.1924 · DOI · Paper page
- 10.1186/1477-7827-12-105 · DOI
- 10.1093/humupd/8.4.333 · DOI
- 10.1016/j.ajhg.2014.08.010 · DOI
- 10.3390/genes6020216 · DOI
- 10.1371/journal.pgen.1002477 · DOI
- 10.1016/j.ajhg.2015.10.006 · DOI
- Hartl DL, 1971, Recurrence risks for germinal mosaics, Am. J. Hum. Genet, 23, 124
- Wijsman EM, 1991, Recurrence risk of a new dominant mutation in children of unaffected parents, Am. J. Hum. Genet, 48, 654
- 10.1136/jmg.26.9.553 · DOI
- 10.1002/ajmg.a.31826 · DOI
- 10.1002/ajmg.a.30896 · DOI
- 10.1159/000438812 · DOI
- 10.1086/301928 · DOI
- 10.1002/gepi.4 · DOI
- 10.1002/bies.201100091 · DOI
- 10.1038/nrg1914 · DOI
- 10.1038/nature10842 · DOI
- 10.1073/pnas.1515798113 · DOI
- 10.1002/aja.1001260106 · DOI
- 10.1016/j.semcdb.2014.03.007 · DOI
- 10.1002/aja.1001120103 · DOI
- 10.1530/rep.1.01081 · DOI
- 10.1017/S1464793105006755 · DOI
- 10.1073/pnas.0912629107 · DOI · Paper page
- 10.2164/jandrol.107.004655 · DOI
- 10.1095/biolreprod35.1.199 · DOI
- 10.1210/jc.86.4.1814 · DOI
- 10.1530/REP-09-0255 · DOI
- 10.2164/jandrol.112.016832 · DOI
- 10.1016/j.stem.2014.01.019 · DOI
- 10.1242/dev.101063 · DOI
- 10.1002/(SICI)1521-1878(200005)22:5<423::AID-BIES4>3.0.CO;2-0 · DOI
- 10.1111/j.2047-2927.2013.00175.x · DOI
- 10.1371/journal.pbio.1002355 · DOI
- 10.1186/scrt487 · DOI
- 10.1371/journal.pbio.0050224 · DOI
- 10.1073/pnas.1311381110 · DOI
- 10.1095/biolreprod.113.108639 · DOI
Cited by
Sorted by citations
Overlooked roles of DNA damage and maternal age in generating human germline mutations
Gao, Z., Moorjani, P., Sasani, T. A., Pedersen, B. S., Quinlan, A. R., Jorde, L. B., Amster, G., & Przeworski, M. (2019) · Proceedings of the National Academy of Sciences · doi:10.1073/pnas.1901259116 · Cited by 229
Direct estimation of mutations in great apes reconciles phylogenetic dating
Besenbacher, S., Hvilsom, C., Marques-Bonet, T., Mailund, T., & Schierup, M. H. (2019) · Nature Ecology & Evolution · doi:10.1038/s41559-018-0778-x · Cited by 165
Initial heritable genome editing: mapping a responsible pathway from basic research to the clinic
Ranisch, R., Trettenbach, K., & Arnason, G. (2023) · Medicine, Health Care and Philosophy · doi:10.1007/s11019-022-10115-x · Cited by 19
Metadata
- Authors
- Scally, A.
- Venue
- Philosophical Transactions of the Royal Society B: Biological Sciences
- Publisher
- The Royal Society
- Published
- 2016-07-19
- Volume
- 371
- Issue
- 1699
- Pages
- 20150137
- ISSN
- 0962-8436
- 1471-2970
- PMC
- PMC4920338
- Cited by
- 58
- References
- 4
- Language
- en
- Funders
- Isaac Newton Trust/Wellcome Trust ISSF
About these checks
Registry, retraction, Cites and statistics results are computed, not judged, with one exception: a printed reference that no index lists is read once by a model before it counts as a citation error. Claims are extracted by a model and kept only when their quote appears verbatim in the text; each cited source is then checked, with a model’s help, for whether it says what the claim relies on. Those verdicts can be wrong — read the claim’s quote and the cited source before relying on one.
Statistics and arithmetic are recomputed, not judged.
Confidence bands are shown only for fields calibrated on our annotated test set. None is calibrated yet, so no band is shown.
What counts as a claim ›How we measure confidence ›How we check this ›
Are you an author, or do you see a problem with this page? Request a review
