

The DOI matches its Crossref record; 1 of the 1 references it cites were found in a registry or an index.
Microbial Primer: Bacterial growth kinetics: This article is part of the Microbial Primers collection.
Open accessAbstract
Growth of microorganisms and interpretation of growth data are core skills required by microbiologists. While science moves forward, it is of paramount importance that essential skills are not lost. The bacterial growth curve and the information that can gleaned from it is of great value to all of microbiology, whether this be a simple growth experiment, comparison of mutant strains or the establishment of conditions for a large-scale multi-omics experiment. Increasingly, the basics of plotting and interpreting growth curves and growth data are being overlooked. This primer article serves as a refresher for microbiologists on the fundamentals of microbial growth kinetics.
Overview
The claims and statistics of this paper haven’t been checked yet.
Run the check — free, no account needed. It reads the open-access text and checks the sources it cites.
Integrity signals
Registry
Cites
Statistics
Figures
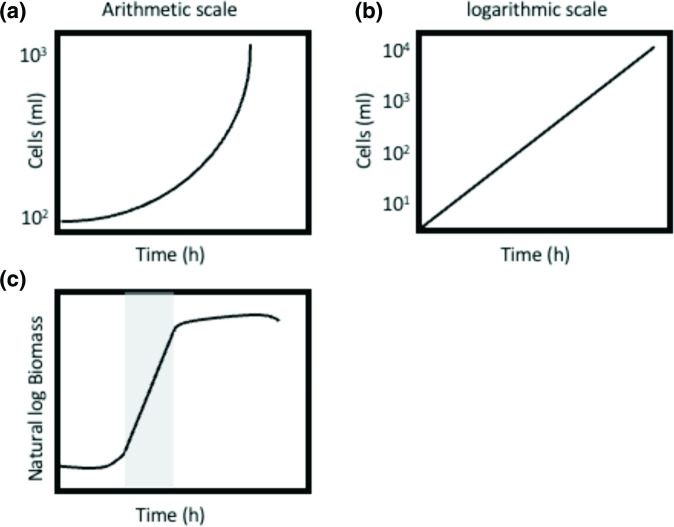
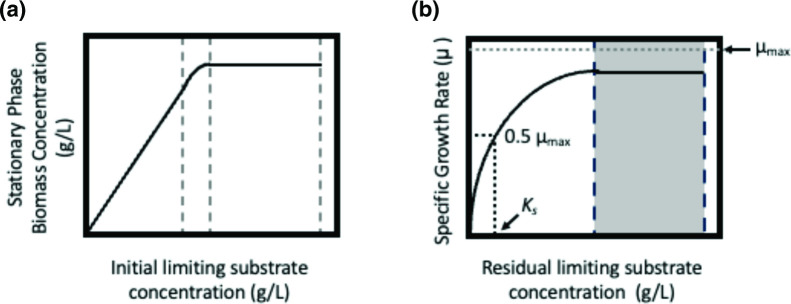
Verification
Claims the paper makes
The claims and statistics of this paper haven’t been checked yet.
Run the check — free, no account needed. It reads the open-access text and checks the sources it cites.
Self-check
Percentages, sums and reported differences re-computed from the paper’s own numbers.
The self-check needs the paper’s full text.
Citations
Cites
Hall, B. G., Acar, H., Nandipati, A., & Barlow, M. (2014) · Molecular Biology and Evolution · doi:10.1093/molbev/mst187 · Cited by 507
Research works printed but not linked: 9
- 10.1111/mmi.15051 · DOI
- 10.1111/1758-2229.12223 · DOI
- Pirt, 1975, Principles of Microbe and Cell Cultivation
- 10.1099/mic.0.27924-0 · DOI
- 10.1128/JB.181.24.7405-7408.1999 · DOI
- 10.1099/00221287-23-3-457 · DOI
- 10.1186/s12859-016-1016-7 · DOI
- Dénéréaz, Bactextract: an R-shiny app to quickly extract, plot and analyse bacterial growth and gene expression data, Access Micro
- 10.1128/mBio.01378-20 · DOI
Metadata
- Authors
- Fernández-Martínez, L. T., Javelle, A., & Hoskisson, P. A.
- Affiliations
- Institute of Infection, Immunity and Inflammation, University of Glasgow, Glasgow, G12 8TA, UK
- University of Strathclyde (GB)
- Corresponding author
- Hoskisson, Paul A.
- Venue
- Microbiology
- Publisher
- Microbiology Society
- Published
- 2024-02-08
- Volume
- 170
- Issue
- 2
- ISSN
- 1350-0872 (ISSN-L)
- 1465-2080
- PMC
- PMC10924458
- OpenAlex
- W4391654097
- Cited by
- 23
- References
- 1
- Citations by year
- 2026: 11 · 2025: 10 · 2024: 2
- FWCI
- 6.10
- Type
- journal article
- Language
- en
- Open access
- diamond
- doi.org
- Locations
- Microbiology (publishedVersion, cc-by)
- PubMed Central (publishedVersion, cc-by)
- PubMed (publishedVersion)
- ENLIGHTEN (Jurnal Bimbingan dan Konseling Islam) (acceptedVersion, cc-by-sa)
- Strathprints: The University of Strathclyde institutional repository (University of Strathclyde) (acceptedVersion)
- Funders
- Biotechnology and Biological Sciences Research Council (BB/T004126/1, BB/T001038/1, BB/S016651/1)
- Topics
- Life Sciences › Biochemistry, Genetics and Molecular Biology › Genetics › Bacterial Genetics and Biotechnology
- Life Sciences › Biochemistry, Genetics and Molecular Biology › Molecular Biology › Microbial Metabolic Engineering and Bioproduction
- Physical Sciences › Environmental Science › Ecology › Microbial Community Ecology and Physiology
- Keywords
- bacterial growth kinetics, bacterial growth curves, microbial growth
- MeSH terms
- Food Microbiology, Kinetics
About these checks
Registry, retraction, Cites and statistics results are computed, not judged, with one exception: a printed reference that no index lists is read once by a model before it counts as a citation error. Claims are extracted by a model and kept only when their quote appears verbatim in the text; each cited source is then checked, with a model’s help, for whether it says what the claim relies on. Those verdicts can be wrong — read the claim’s quote and the cited source before relying on one.
Statistics and arithmetic are recomputed, not judged.
Confidence bands are shown only for fields calibrated on our annotated test set. None is calibrated yet, so no band is shown.
What counts as a claim ›How we measure confidence ›How we check this ›
Are you an author, or do you see a problem with this page? Request a review
