Student or educator? Sign up with your school email and get 6 months of Pro free.
PreprintCited by 3Genetic and Kidney Cyst DiseasesCystic Fibrosis Research AdvancesMicrotubule and mitosis dynamics

The DOI matches its Crossref record; 1 of the 1 references it cites were found in a registry or an index.

Flagellar synchronization is a simple alternative to cell cycle synchronization for ciliary and flagellar studies

Open access

Preprint — published as 10.1128/msphere.00003-17 · Paper page

Abstract

The unicellular green alga, Chlamydomonas reinhardtii , is an ideal model organism for studies of ciliary function and assembly. In assays for biological and biochemical effects of various factors on flagellar structure and function, synchronous culture is advantageous for minimizing variability. Here, we have characterized a method in which 100% synchronization is achieved with respect to flagellar length but not with respect to the cell cycle. The method requires inducing flagellar regeneration by amputation of the entire cell population and limiting regeneration time, which results in a maximally homogeneous distribution of flagellar length at three hours post-amputation. We find that time-limiting new protein synthesis during flagellar synchronization limits variability in the unassembled pool of limiting flagellar protein and variability in flagellar length without scaling the cell volume range. We also find that long and short flagella mutants that regenerate normally require longer and shorter synchronization times, respectively. By minimizing flagellar length variability using a simple method requiring only hours and no changes in media, flagellar synchronization facilitates the detection of small changes in flagellar length resulting from both chemical and genetic perturbations in Chlamydomonas . This method increases our ability to probe the basic biology of ciliary size regulation and related disease etiologies.

Overview

The claims and statistics of this paper haven’t been checked yet.

Run the check — free, no account needed. It reads the open-access text and checks the sources it cites.

A few free checks a day · papers already verified open instantly · results are public

Integrity signals

Registry

Crossref · 10.1101/089185

Cites

1 of 1 references verified0 citation errors · 0 not checkable

Statistics

Figures

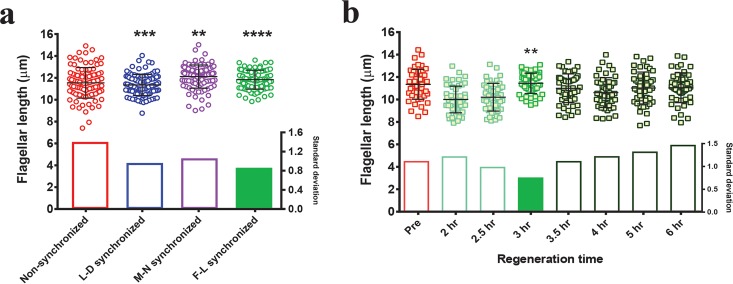
FIG 1 F-L synchronization narrows the flagellar length distribution compared to other synchronization methods. (a) Distribution of steady-state flagellar lengths after the use of different synchronization methods. Nonsynchronous cells were used as a control, and steady-state flagellar lengths were measured after the use of each synchronization method as described in the text (n = 100/each). The F test was performed for comparing variance levels, and two-tailed P values were determined. Asterisks indicate significant differences (****, P ≤ 0.0001; ***, P ≤ 0.001; **, P ≤ 0.01). Standard deviations of each distribution are shown below the individually plotted values. (b) Wild-type flagellar length distribution at various time intervals during the regeneration after amputation. Predeflagellation nonsynchronous cells (pre) are shown in red. Regeneration was carried out for the indicated times after deflagellation by pH shock (green). Lighter green and darker green indicate before and after the time of F-L synchronization, respectively (n = 50/each). The F test was performed for comparing variance levels (control = predeflagellation nonsynchronous cells). Bonferroni corrected αaltered = 0.007. The asterisks indicate significant difference below αaltered (**, P = 0.004). Standard deviations are expressed as bar graphs in the bottom half of the panels. The filled standard deviation bar represents the condition with the smallest variance.
FIG 1 F-L synchronization narrows the flagellar length distribution compared to other synchronization methods. (a) Distribution of steady-state flagellar lengths after the use of different synchronization methods. Nonsynchronous cells were used as a control, and steady-state flagellar lengths were measured after the use of each synchronization method as described in the text (n = 100/each). The F test was performed for comparing variance levels, and two-tailed P values were determined. Asterisks indicate significant differences (****, P ≤ 0.0001; ***, P ≤ 0.001; **, P ≤ 0.01). Standard deviations of each distribution are shown below the individually plotted values. (b) Wild-type flagellar length distribution at various time intervals during the regeneration after amputation. Predeflagellation nonsynchronous cells (pre) are shown in red. Regeneration was carried out for the indicated times after deflagellation by pH shock (green). Lighter green and darker green indicate before and after the time of F-L synchronization, respectively (n = 50/each). The F test was performed for comparing variance levels (control = predeflagellation nonsynchronous cells). Bonferroni corrected αaltered = 0.007. The asterisks indicate significant difference below αaltered (**, P = 0.004). Standard deviations are expressed as bar graphs in the bottom half of the panels. The filled standard deviation bar represents the condition with the smallest variance.CC BY · PubMed Central
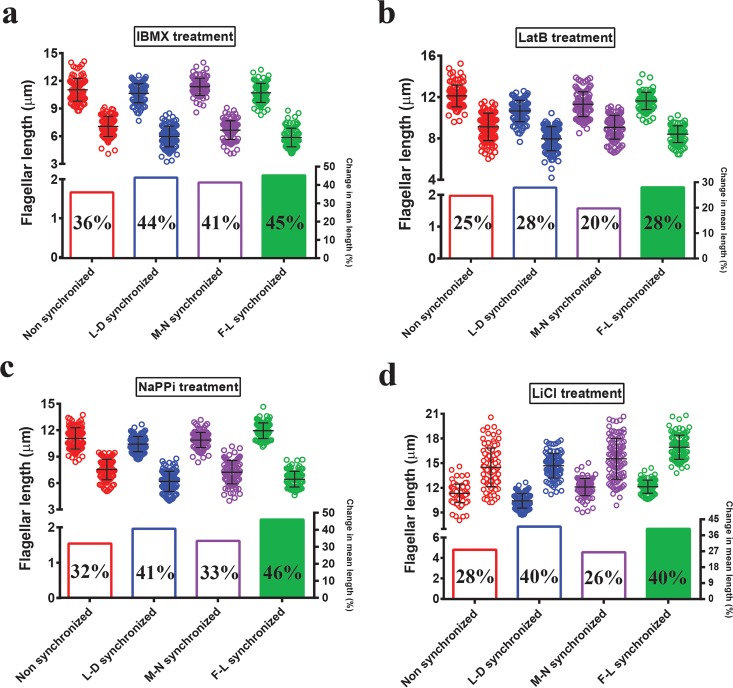
FIG 2 Effects of length-altering chemical treatments are more apparent after F-L synchronization. Flagella were measured from each cell after incubation with the appropriate concentration of different chemicals for 90 min. (a) 0.4 mM IBMX. (b) 10 µM LatB. (c) 10 mM NaPPi. (d) 25 mM LiCl. For each pair: red, nonsynchronized; blue, L-D synchronized; purple, M-N synchronized; green, F-L synchronized. The first and second distributions for each pair represent control and treated conditions, respectively. n = 100 cells (one flagellum per cell). Bars represent means and standard deviations (top half of each panel). In each case, percent change in mean flagellar length is shown below individual plotted values.
FIG 2 Effects of length-altering chemical treatments are more apparent after F-L synchronization. Flagella were measured from each cell after incubation with the appropriate concentration of different chemicals for 90 min. (a) 0.4 mM IBMX. (b) 10 µM LatB. (c) 10 mM NaPPi. (d) 25 mM LiCl. For each pair: red, nonsynchronized; blue, L-D synchronized; purple, M-N synchronized; green, F-L synchronized. The first and second distributions for each pair represent control and treated conditions, respectively. n = 100 cells (one flagellum per cell). Bars represent means and standard deviations (top half of each panel). In each case, percent change in mean flagellar length is shown below individual plotted values.CC BY · PubMed Central
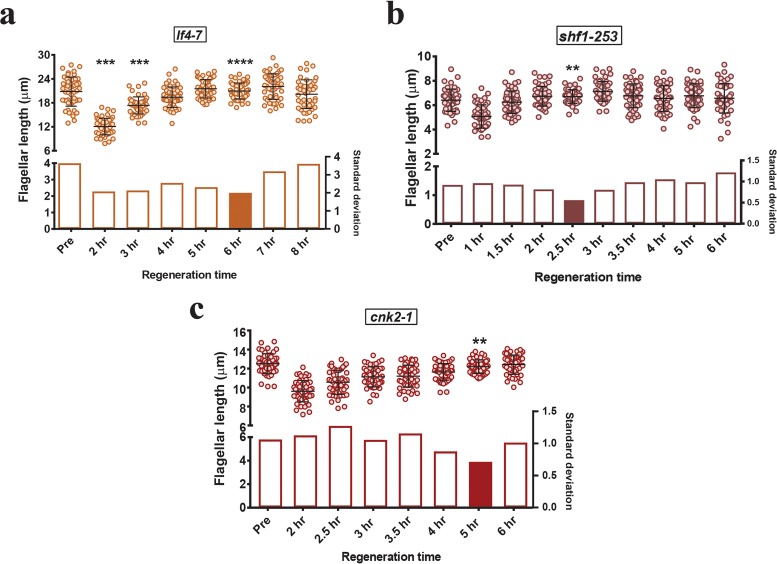
FIG 3 F-L synchronization times differ in mutants of different lengths. For each mutant, distributions of flagellar length during regeneration are shown. (a) Long-flagella mutant lf4-7. (b) Short-flagella mutant shf1-253. (c) Mild phenotype long-flagella mutant cnk2-1. “Pre” represents the steady-state length of the mutant predeflagellation. Bars represent means and standard deviations (top half of each panel). Standard deviations are represented by bar graphs in the lower half of each panel, and the filled bar corresponds to the synchronization time for each mutant on the basis of minimal standard deviation. n = 50/each. The F test was performed for comparing variance levels with predeflagellation nonsynchronous controls. (a and c) Bonferroni corrected αaltered = 0.007; asterisks indicate significant differences below αaltered (****, P = 0.00005; ***, P = 0.0002; **, P = 0.004). (b) Bonferroni corrected αaltered = 0.0055; asterisks indicate significant differences below αaltered (**, P = 0.0008).
FIG 3 F-L synchronization times differ in mutants of different lengths. For each mutant, distributions of flagellar length during regeneration are shown. (a) Long-flagella mutant lf4-7. (b) Short-flagella mutant shf1-253. (c) Mild phenotype long-flagella mutant cnk2-1. “Pre” represents the steady-state length of the mutant predeflagellation. Bars represent means and standard deviations (top half of each panel). Standard deviations are represented by bar graphs in the lower half of each panel, and the filled bar corresponds to the synchronization time for each mutant on the basis of minimal standard deviation. n = 50/each. The F test was performed for comparing variance levels with predeflagellation nonsynchronous controls. (a and c) Bonferroni corrected αaltered = 0.007; asterisks indicate significant differences below αaltered (****, P = 0.00005; ***, P = 0.0002; **, P = 0.004). (b) Bonferroni corrected αaltered = 0.0055; asterisks indicate significant differences below αaltered (**, P = 0.0008).CC BY · PubMed Central
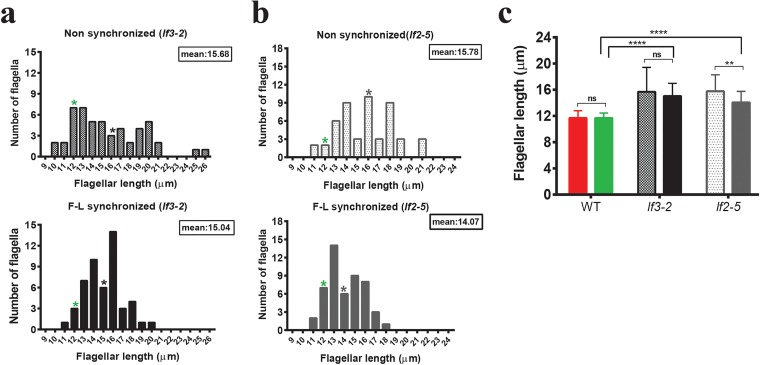
FIG 4 Distributions of flagellar length in long-flagella mutants before and after F-L synchronization. (a) lf3-2 mutant. (b) lf2-5 mutant. The upper parts of panels a and b represent the distributions of flagellar lengths in nonsynchronous cells. Cells were then deflagellated by acidic shock and regenerated for 4 h for F-L synchronization. The lower parts of panels a and b correspond to the distributions of flagellar lengths after F-L synchronization. n = 50/each (zeros excluded). The mean flagellar length of each mutant is marked by an asterisk. The green asterisks indicate the mean flagellar length observed in wild-type controls. (c) The mean flagellar lengths of wild-type and mutant cells were compared using Bonferroni’s post hoc test, and the results are represented. The first and second bars within each pair in panel c represent the mean flagellar lengths of nonsynchronized and synchronized cells, respectively. The Mann-Whitney U test was performed for comparing two means in a pair, and Bonferroni’s post hoc test was performed for multiple comparisons. Asterisks indicate significant differences (****, P ≤ 0.0001; **, P ≤ 0.01; ns, P > 0.05).
FIG 4 Distributions of flagellar length in long-flagella mutants before and after F-L synchronization. (a) lf3-2 mutant. (b) lf2-5 mutant. The upper parts of panels a and b represent the distributions of flagellar lengths in nonsynchronous cells. Cells were then deflagellated by acidic shock and regenerated for 4 h for F-L synchronization. The lower parts of panels a and b correspond to the distributions of flagellar lengths after F-L synchronization. n = 50/each (zeros excluded). The mean flagellar length of each mutant is marked by an asterisk. The green asterisks indicate the mean flagellar length observed in wild-type controls. (c) The mean flagellar lengths of wild-type and mutant cells were compared using Bonferroni’s post hoc test, and the results are represented. The first and second bars within each pair in panel c represent the mean flagellar lengths of nonsynchronized and synchronized cells, respectively. The Mann-Whitney U test was performed for comparing two means in a pair, and Bonferroni’s post hoc test was performed for multiple comparisons. Asterisks indicate significant differences (****, P ≤ 0.0001; **, P ≤ 0.01; ns, P > 0.05).CC BY · PubMed Central
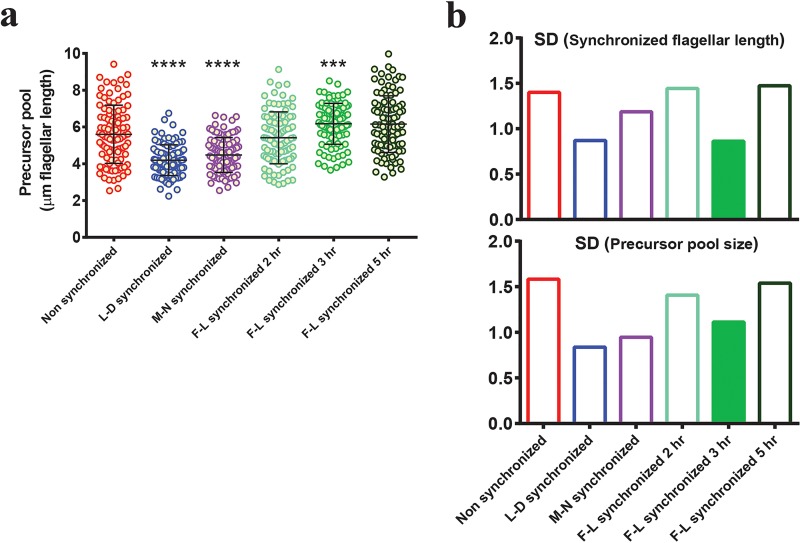
FIG 5 Relationship between flagellar length and precursor pool distribution. (a) Flagellar precursor pool distributions (as determined by regeneration in cycloheximide after the use of different synchronization methods). Red, nonsynchronous; blue, L-D synchronized; purple, M-N synchronized; light green, F-L synchronized for 2 h; medium green, F-L synchronized for 3 h; dark green, F-L synchronized for 5 h. Results of F-L synchronization performed for 3 h show minimal variability among F-L synchronized cells. n = 100/each. The F test was performed for comparing variance levels (control = nonsynchronous cells). Asterisks indicate significant differences (****, P ≤ 0.0001; ***, P ≤ 0.001). Bars represent means and standard deviations. (b) Postsynchronization standard deviations (top panel) and corresponding precursor pool standard deviations (bottom panel) of each distribution are represented by bars with matching colors. Cell cycle synchronized cells (L-D synchronized) show the smallest variability in precursor pool distribution (blue, bottom panel). Of the F-L synchronized cells (green), 3 h of synchronization showed the smallest variability in precursor pool distribution (filled bar, bottom panel).
FIG 5 Relationship between flagellar length and precursor pool distribution. (a) Flagellar precursor pool distributions (as determined by regeneration in cycloheximide after the use of different synchronization methods). Red, nonsynchronous; blue, L-D synchronized; purple, M-N synchronized; light green, F-L synchronized for 2 h; medium green, F-L synchronized for 3 h; dark green, F-L synchronized for 5 h. Results of F-L synchronization performed for 3 h show minimal variability among F-L synchronized cells. n = 100/each. The F test was performed for comparing variance levels (control = nonsynchronous cells). Asterisks indicate significant differences (****, P ≤ 0.0001; ***, P ≤ 0.001). Bars represent means and standard deviations. (b) Postsynchronization standard deviations (top panel) and corresponding precursor pool standard deviations (bottom panel) of each distribution are represented by bars with matching colors. Cell cycle synchronized cells (L-D synchronized) show the smallest variability in precursor pool distribution (blue, bottom panel). Of the F-L synchronized cells (green), 3 h of synchronization showed the smallest variability in precursor pool distribution (filled bar, bottom panel).CC BY · PubMed Central
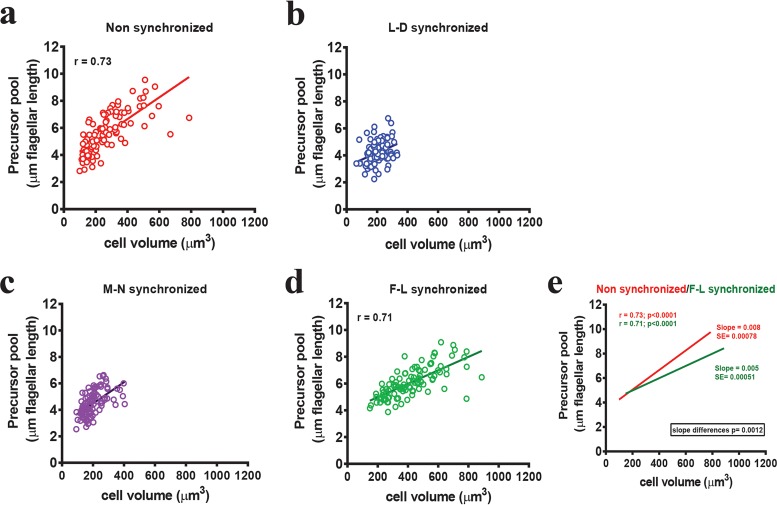
FIG 6 F-L synchronization changes the relationship between the precursor pool size and cell size. Flagellar length in cycloheximide, which corresponds to the precursor pool, is plotted along the y axis. Matching cell volume is plotted along the x axis. Values are plotted for (a) nonsynchronized (red), (b) L-D synchronized (blue), (c) M-N synchronized (purple), and (d) F-L synchronized (green) populations. n = 100. Nonsynchronized cells showed a significant correlation between cell size and precursor pool size (r = 0.73). L-D and M-N synchronized cells had narrow cell volume and precursor pool ranges. F-L synchronized cells showed a narrow precursor pool range without limiting cell volume. (e) Relation between nonsynchronous and F-L synchronized cells. The straight lines represent the best-fitted lines through the data point and were drawn after linear regression (red, nonsynchronous cells; green, F-L synchronized cells). SE = standard error of the slopes. The slope became smaller in the case of F-L synchronized cells, a result which is significantly different from that seen with nonsynchronous cells (P = 0.0012).
FIG 6 F-L synchronization changes the relationship between the precursor pool size and cell size. Flagellar length in cycloheximide, which corresponds to the precursor pool, is plotted along the y axis. Matching cell volume is plotted along the x axis. Values are plotted for (a) nonsynchronized (red), (b) L-D synchronized (blue), (c) M-N synchronized (purple), and (d) F-L synchronized (green) populations. n = 100. Nonsynchronized cells showed a significant correlation between cell size and precursor pool size (r = 0.73). L-D and M-N synchronized cells had narrow cell volume and precursor pool ranges. F-L synchronized cells showed a narrow precursor pool range without limiting cell volume. (e) Relation between nonsynchronous and F-L synchronized cells. The straight lines represent the best-fitted lines through the data point and were drawn after linear regression (red, nonsynchronous cells; green, F-L synchronized cells). SE = standard error of the slopes. The slope became smaller in the case of F-L synchronized cells, a result which is significantly different from that seen with nonsynchronous cells (P = 0.0012).CC BY · PubMed Central
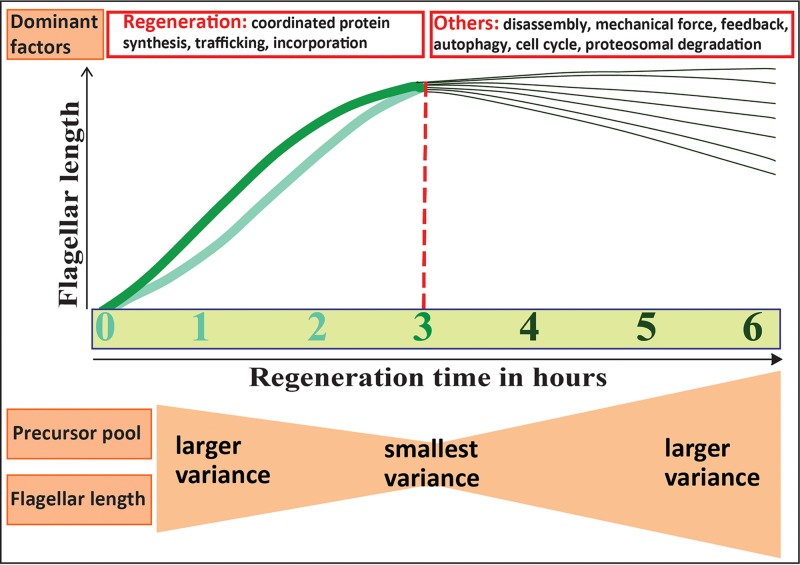
FIG 7 Proposed model of flagellar length synchronization. Thick light green and medium green lines represent slow-growing and fast-growing flagella, respectively. The red dotted line denotes the 3 h postdeflagellation time at which flagellar length variability was minimized. Regeneration is initially the dominant factor. With time, other listed factors may contribute, resulting in higher levels of flagellar length variability.
FIG 7 Proposed model of flagellar length synchronization. Thick light green and medium green lines represent slow-growing and fast-growing flagella, respectively. The red dotted line denotes the 3 h postdeflagellation time at which flagellar length variability was minimized. Regeneration is initially the dominant factor. With time, other listed factors may contribute, resulting in higher levels of flagellar length variability.CC BY · PubMed Central

Verification

Claims the paper makes

The claims and statistics of this paper haven’t been checked yet.

Run the check — free, no account needed. It reads the open-access text and checks the sources it cites.

A few free checks a day · papers already verified open instantly · results are public

Self-check

Percentages, sums and reported differences re-computed from the paper’s own numbers.

The self-check needs the paper’s full text.

Citations

Cites

Research works printed but not linked: 66

  1. 10.1146/annurev.arplant.52.1.363 · DOI
  2. 10.1104/pp.127.4.1500 · DOI
  3. 10.1016/j.semcdb.2008.07.005 · DOI
  4. 10.1038/ncb3370 · DOI
  5. 10.1016/S0091-679X(08)94007-3 · DOI · Paper page
  6. 10.1002/(SICI)1097-0169(1998)40:2<133::AID-CM3>3.0.CO;2-G · DOI
  7. 2016, Mechanism of ciliary disassembly, Cellular and molecular life sciences: CMLS, 73, 1787, 10.1007/s00018-016-2148-7 · DOI
  8. 1974, Basal body and flagellar development during the vegetative cell cycle and the sexual cycle of Chlamydomonas reinhardii, Journal of cell science, 16, 529, 10.1242/jcs.16.3.529 · DOI · Paper page
  9. 10.1073/pnas.50.4.767 · DOI
  10. 1980, Synchronization of cell division in microorganisms by percoll gradients, Journal of bacteriology, 144, 17, 10.1128/jb.144.1.17-21.1980 · DOI
  11. 2015, A ten-year search for synchronous cells: obstacles, solutions, and practical applications, Frontiers in microbiology, 6, 238
  12. 10.1016/S0580-9517(08)70140-5 · DOI
  13. Tormos-Pérez M , Pérez-Hidalgo L , Moreno S . 2016. Fission Yeast Cell Cycle Synchronization Methods. Yeast Cytokinesis: Methods and Protocols:293–308. · DOI
  14. 10.1002/yea.1347 · DOI · Paper page
  15. Darzynkiewicz Z , Halicka HD , Zhao H , Podhorecka M . 2011. Cell synchronization by inhibitors of DNA replication induces replication stress and DNA damage response: analysis by flow cytometry. Cell Cycle Synchronization: Methods and Protocols: 85–96. · DOI
  16. 10.1083/jcb.25.1.145 · DOI · Paper page
  17. 2001, Biological methods for cell-cycle synchronization of mammalian cells, Biotechniques, 30, 1322, 10.2144/01306rv01 · DOI
  18. 2013, Merging high-quality biochemical fractionation with a refined flow cytometry approach to monitor nucleocytoplasmic protein expression throughout the unperturbed mammalian cell cycle, Nature protocols, 8, 602, 10.1038/nprot.2013.011 · DOI
  19. 2011, Synchronization of mammalian cell cultures by serum deprivation, Methods in molecular biology, 761, 75, 10.1007/978-1-61779-182-6_5 · DOI
  20. 10.1083/jcb.41.1.145 · DOI
  21. 1963, Synchronous Cultures of Algae 1, Phycologia, 2, 135, 10.2216/i0031-8884-2-4-135.1 · DOI
  22. 10.1146/annurev.pp.17.060166.000245 · DOI
  23. 10.1016/S0076-6879(71)23080-9 · DOI
  24. Harris E . 1989. Culture and storage methods. The Chlamydomonas Sourcebook: A Comprehensive Guide to Biology and Laboratory Use. Academic Press, San Diego:25–63. · DOI
  25. 10.1016/S0014-4827(71)80053-8 · DOI
  26. 10.1016/0014-4827(73)90106-7 · DOI
  27. 10.1104/pp.95.1.197 · DOI
  28. 10.1534/genetics.115.184663 · DOI
  29. 1964, The Control of Gametic Differentiation in Liquid Cultures of Chlamydomonas, Journal of cellular physiology, 63, 157, 10.1002/jcp.1030630204 · DOI
  30. 10.1083/jcb.67.3.587 · DOI
  31. 10.1007/s00294-004-0526-4 · DOI
  32. 1999, Analysis of light/dark synchronization of cell-wall-less Chlamydomonas reinhardtii (Chlorophyta) cells by flow cytometry, European Journal of Phycology, 34, 279, 10.1080/09670269910001736332 · DOI
  33. 2015, The Chlamydomonas cell cycle, The Plant journal: for cell and molecular biology, 82, 370, 10.1111/tpj.12795 · DOI
  34. 10.1126/science.131.3412.1528 · DOI
  35. 10.1038/304630a0 · DOI
  36. 10.1099/00221287-131-11-2919 · DOI
  37. 10.1083/jcb.117.6.1289 · DOI
  38. 10.1016/0092-8674(80)90633-9 · DOI
  39. 2014, Actin is required for IFT regulation in Chlamydomonas reinhardtii, Current biology: CB, 24, 2025, 10.1016/j.cub.2014.07.038 · DOI
  40. 10.1083/jcb.78.1.8 · DOI · Paper page
  41. 1987, Short-Flagella Mutants of Chlamydomonas reinhardtii, Genetics, 115, 685, 10.1093/genetics/115.4.685 · DOI
  42. 1988, Genetic analysis of long-flagella mutants of Chlamydomonas reinhardtii, Genetics, 118, 637, 10.1093/genetics/118.4.637 · DOI
  43. 1998, Genetic analysis of flagellar length control in Chlamydomonas reinhardtii: a new long-flagella locus and extragenic suppressor mutations, Genetics, 148, 693, 10.1093/genetics/148.2.693 · DOI
  44. 2013, The kinases LF4 and CNK2 control ciliary length by feedback regulation of assembly and disassembly rates, Current biology: CB, 23, 2208, 10.1016/j.cub.2013.09.038 · DOI
  45. 10.1083/jcb.41.2.600 · DOI · Paper page
  46. 10.1083/jcb.92.1.170 · DOI
  47. 2012, Coordinating genome expression with cell size, Trends in genetics: TIG, 28, 560, 10.1016/j.tig.2012.07.003 · DOI
  48. 1979, Altered patterns of ribonucleic acid synthesis during the cell cycle: a mechanism compensating for variation in gene concentration, Journal of cell science, 35, 25, 10.1242/jcs.35.1.25 · DOI
  49. 10.1016/S0074-7696(03)01004-0 · DOI
  50. 2010, Gene regulation: global transcription rates scale with size, Current biology: CB, 20, R979, 10.1016/j.cub.2010.09.064 · DOI
  51. Cohen J , Cohen P , West SG , Aiken LS . 2013. Applied multiple regression/correlation analysis for the behavioral sciences. Routledge. · DOI · Paper page
  52. 10.1016/j.mri.2014.12.008 · DOI
  53. 10.1091/mbc.E04-07-0586 · DOI
  54. 1976, Flagellar regeneration in Chlamydomonas reinhardtii: evidence that cycloheximide pulses induce a delay in morphogenesis, Journal of cell science, 20, 639, 10.1242/jcs.20.3.639 · DOI
  55. 10.1146/annurev.cellbio.2.1.517 · DOI
  56. 10.1039/c2lc40638a · DOI
  57. 10.1016/j.jtbi.2008.01.001 · DOI
  58. 2009, The ubiquitin conjugation system is involved in the disassembly of cilia and flagella, The Journal of cell biology, 186, 601613
  59. 10.1126/science.1223539 · DOI
  60. 2011, Limiting amounts of centrosome material set centrosome size in C, elegans embryos. Current biology: CB, 21, 1259
  61. 10.1038/nature12639 · DOI · Paper page
  62. 10.1007/BF02073899 · DOI
  63. 10.1083/jcb.151.3.709 · DOI · Paper page
  64. 2009, Renal primary cilia lengthen after acute tubular necrosis, Journal of the American Society of Nephrology: JASN, 20, 2147, 10.1681/ASN.2008101105 · DOI
  65. 2009, Ciliary and centrosomal defects associated with mutation and depletion of the Meckel syndrome genes MKS1 and MKS3, Human molecular genetics, 18, 33113323
  66. 10.1101/gad.892101 · DOI

Metadata

Authors
Dutta, S., & Avasthi, P.
Affiliations
University of Kansas Medical Center (US)
Corresponding author
Avasthi, Prachee
Venue
mSphere
Publisher
openRxiv
Published
2016-11-22
Volume
2
Issue
2
ISSN
2379-5042 (ISSN-L)
OpenAlex
W2951402366
Cited by
3
References
1
Citations by year
2022: 1 · 2019: 1 · 2018: 1
FWCI
0.36
Type
journal article
Language
en
Open access
Locations
  • mSphere (publishedVersion, cc-by)
  • bioRxiv (Cold Spring Harbor Laboratory) (acceptedVersion, cc-by-nc)
  • Europe PMC (PubMed Central) (publishedVersion, cc-by)
  • PubMed Central (publishedVersion, cc-by)
  • PubMed (publishedVersion)
  • DOAJ (DOAJ: Directory of Open Access Journals) (submittedVersion)
  • DOAJ (DOAJ: Directory of Open Access Journals) (submittedVersion, cc-by-sa)
  • KU ScholarWorks (University of Kansas) (submittedVersion, cc-by)
  • KU ScholarWorks (The University of Kansas) (submittedVersion, cc-by)
Funders
  • National Institutes of Health (NIH P20 GM103418, GM103418)
  • National Institute of General Medical Sciences (P20GM104936, P20GM103418)
Topics
  • Life Sciences › Biochemistry, Genetics and Molecular Biology › Genetics › Genetic and Kidney Cyst Diseases
  • Health Sciences › Medicine › Pulmonary and Respiratory Medicine › Cystic Fibrosis Research Advances
  • Life Sciences › Biochemistry, Genetics and Molecular Biology › Cell Biology › Microtubule and mitosis dynamics
Keywords
flagellar synchronization, cell cycle synchronization, cilia, flagella, Chlamydomonas reinhardtii, ciliary length, cell size, ciliary assembly, ciliary motility

About these checks

Registry, retraction, Cites and statistics results are computed, not judged, with one exception: a printed reference that no index lists is read once by a model before it counts as a citation error. Claims are extracted by a model and kept only when their quote appears verbatim in the text; each cited source is then checked, with a model’s help, for whether it says what the claim relies on. Those verdicts can be wrong — read the claim’s quote and the cited source before relying on one.

Statistics and arithmetic are recomputed, not judged.

Confidence bands are shown only for fields calibrated on our annotated test set. None is calibrated yet, so no band is shown.

What counts as a claim ›How we measure confidence ›How we check this ›

Are you an author, or do you see a problem with this page? Request a review

Data sources

Bibliographic data: Semantic Scholar, OpenAlex, Crossref.

Contains information from the Semantic Scholar Academic Graph Datasets, made available under the ODC Attribution License (ODC-BY 1.0).

Semantic Scholar’s data is described in: Kinney, R., et al. (2023). The Semantic Scholar Open Data Platform. arXiv:2301.10140.