

The DOI matches its Crossref record; 1 of the 1 references it cites were found in a registry or an index.
Substrate-Specific Effects of Natural Genetic Variation on Proteasome Activity
Open accessPreprint — published as 10.1371/journal.pgen.1010734 · Paper page
Abstract
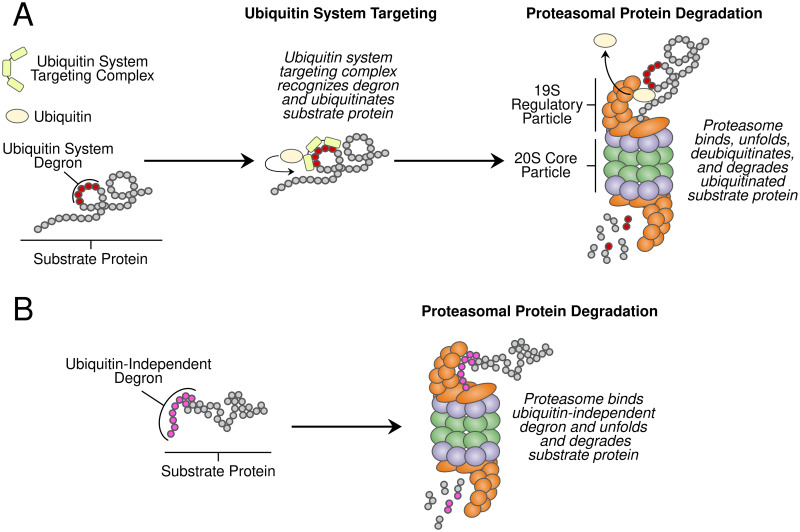
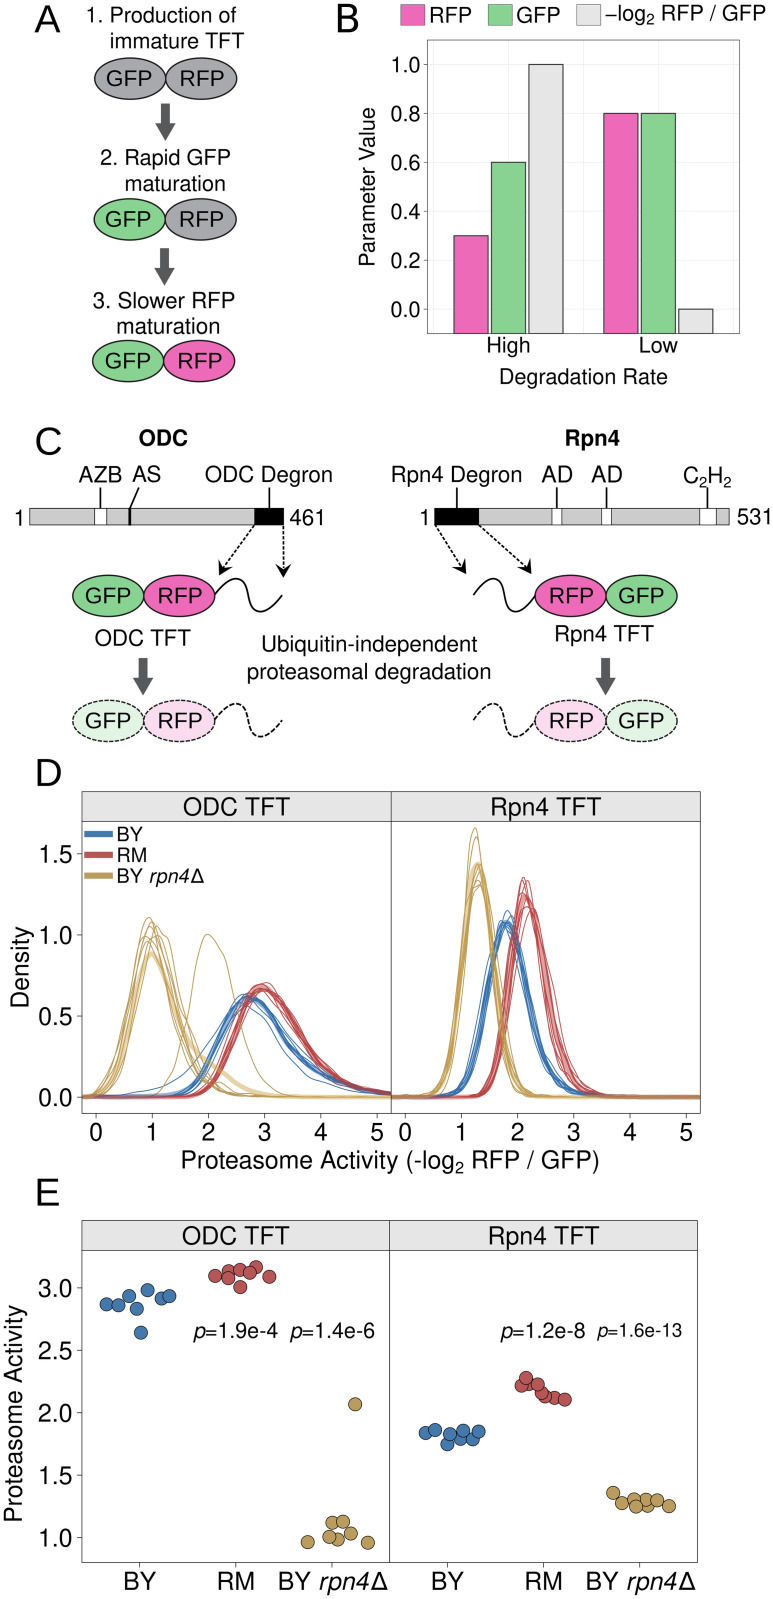
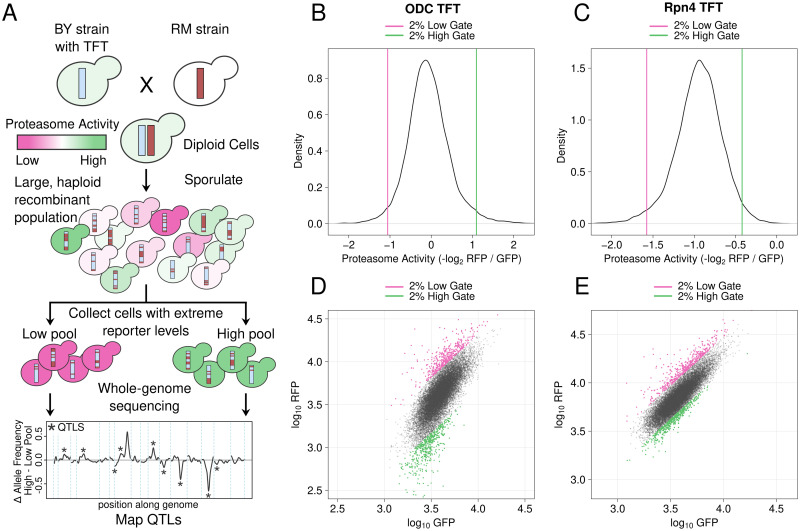
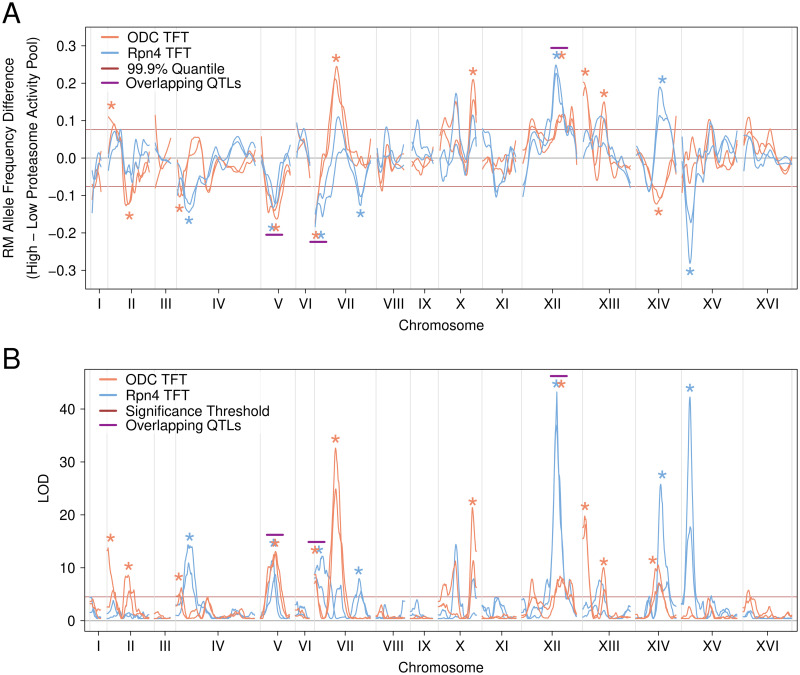
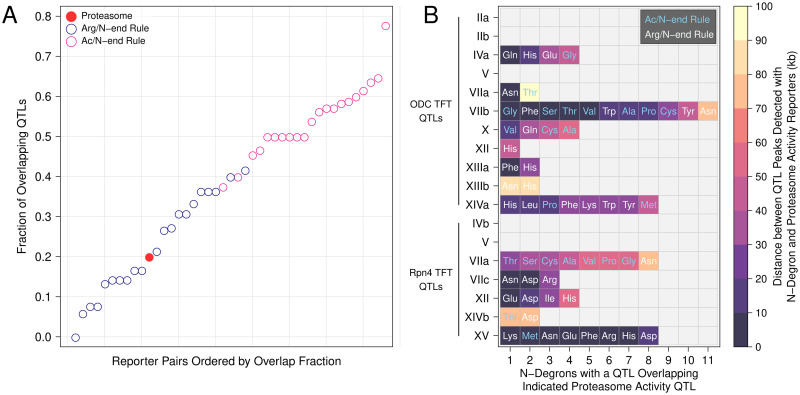
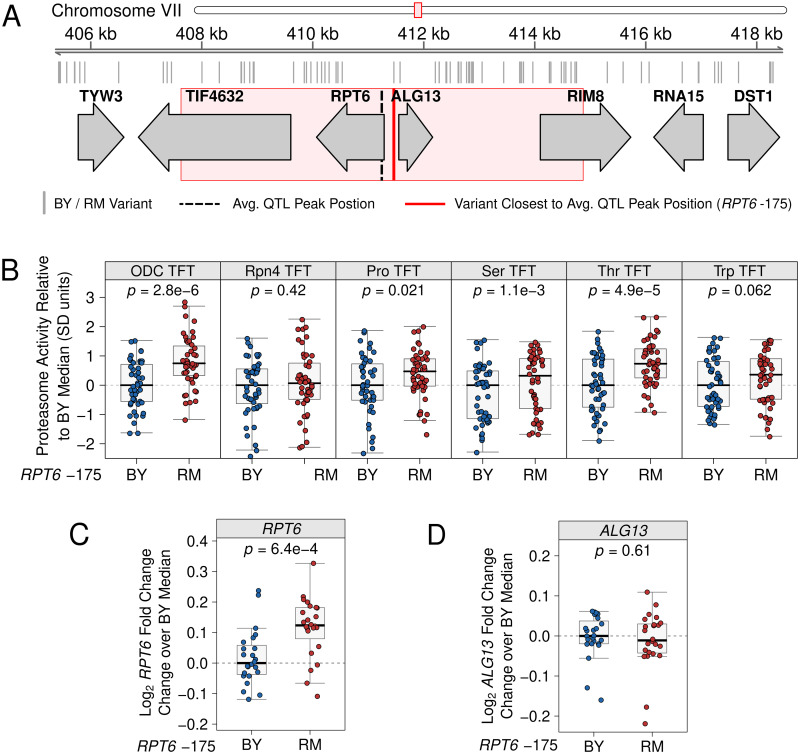
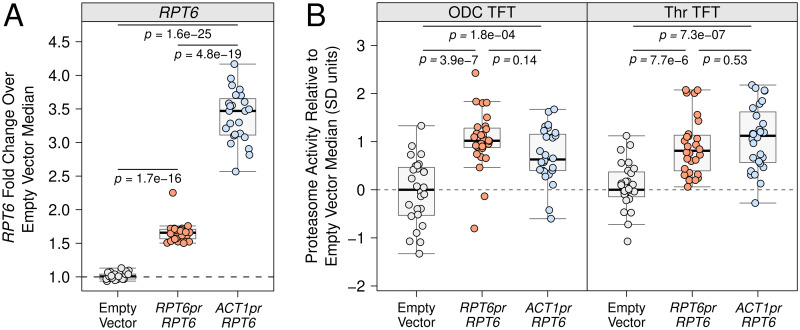
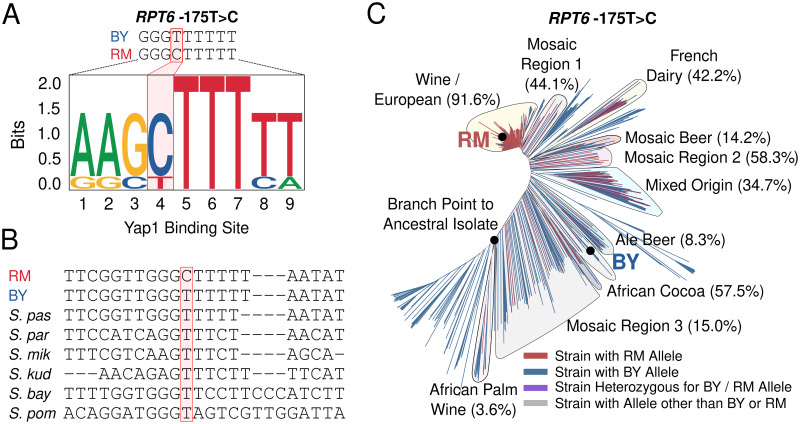
Protein degradation is an essential biological process that regulates protein abundance and removes misfolded and damaged proteins from cells. In eukaryotes, most protein degradation occurs through the stepwise actions of two functionally distinct entities, the ubiquitin system and the proteasome. Ubiquitin system enzymes attach ubiquitin to cellular proteins, targeting them for degradation. The proteasome then selectively binds and degrades ubiquitinated substrate proteins. Genetic variation in ubiquitin system genes creates heritable differences in the degradation of their substrates. However, the challenges of measuring the degradative activity of the proteasome independently of the ubiquitin system in large samples have limited our understanding of genetic influences on the proteasome. Here, using the yeast Saccharomyces cerevisiae , we built and characterized reporters that provide high-throughput, ubiquitin system-independent measurements of proteasome activity. Using single-cell measurements of proteasome activity from millions of genetically diverse yeast cells, we mapped 15 loci across the genome that influence proteasomal protein degradation. Twelve of these 15 loci exerted specific effects on the degradation of two distinct proteasome substrates, revealing a high degree of substrate-specificity in the genetics of proteasome activity. Using CRISPR-Cas9-based allelic engineering, we resolved a locus to a causal variant in the promoter of RPT6 , a gene that encodes a subunit of the proteasome’s 19S regulatory particle. Our results reveal the complex genetic architecture of proteasome activity and suggest that genetic influences on the proteasome may be an important source of variation in the many cellular and organismal traits shaped by protein degradation. Author Summary: Protein degradation controls the abundance of cellular proteins and serves an essential role in protein quality control by eliminating misfolded and damaged proteins. In eukaryotes, most protein degradation occurs in two steps. The ubiquitin system first targets proteins for degradation by attaching ubiquitin to them. The proteasome then selectively binds and degrades ubiquitinated proteins. Understanding how individual genetic differences affect the activity of the proteasome could improve our understanding of the many traits influenced by protein degradation. However, most assays that measure proteasomal protein degradation are not suitable for use in large samples or are affected by changes in the activity of the ubiquitin system. Using yeast, we built reporters that provide high-throughput measurements of proteasome activity independently of the ubiquitin system. We used measurements of proteasome activity from millions of live, single cells to identify regions of the genome with DNA variants that affect proteasomal protein degradation. We identified 15 such regions, showing that proteasome activity is a genetically complex trait. Using genome engineering, we found that one locus contained a variant in the promoter of a proteasome subunit gene that affected the activity of the proteasome towards multiple substrates. Our results demonstrate that individual genetic differences shape proteasome activity and suggest that these differences may contribute to variation in the many traits regulated by protein degradation.
Overview
The claims and statistics of this paper haven’t been checked yet.
Run the check — free, no account needed. It reads the open-access text and checks the sources it cites.
Integrity signals
Registry
Cites
Statistics
Figures
Verification
Claims the paper makes
The claims and statistics of this paper haven’t been checked yet.
Run the check — free, no account needed. It reads the open-access text and checks the sources it cites.
Self-check
Percentages, sums and reported differences re-computed from the paper’s own numbers.
The self-check needs the paper’s full text.
Citations
Cites
Global quantification of mammalian gene expression control
Schwanhäusser, B., Busse, D., Li, N., Dittmar, G., Schuchhardt, J., Wolf, J., Chen, W., & Selbach, M. (2011) · Nature · doi:10.1038/nature10098 · Cited by 6,566
Research works printed but not linked: 134
- 10.1534/genetics.112.140467 · DOI
- 10.1146/annurev.biochem.67.1.425 · DOI · Paper page
- 10.1146/annurev.med.50.1.57 · DOI
- 10.1016/j.cell.2017.04.023 · DOI · Paper page
- 10.1016/0092-8674(91)90202-A · DOI
- 10.1002/(SICI)1521-1878(200005)22:5<442::AID-BIES6>3.0.CO;2-Q · DOI
- 2022, Multiple causal variants underlie genetic associations in humans, Science, 375, 1247, 10.1126/science.abj5117 · DOI
- 10.1016/j.febslet.2007.03.053 · DOI
- 10.1016/j.sbi.2014.02.002 · DOI
- 10.1146/annurev.bi.65.070196.004101 · DOI
- 10.1074/jbc.274.6.3363 · DOI
- 10.1073/pnas.1521919112 · DOI
- 2020, A Systematic Protein Turnover Map for Decoding Protein Degradation, Cell Rep, 33, 11
- 2021, Timer-based proteomic profiling of the ubiquitin-proteasome system reveals a substrate receptor of the GID ubiquitin ligase, Mol Cell, 81, 2460, 10.1016/j.molcel.2021.04.018 · DOI
- 10.1074/jbc.273.39.25216 · DOI
- 1996, Role of the ubiquitin/proteasome system in regulated protein degradation in Saccharomyces cerevisiae, Biol Chem, 377, 437
- 10.1002/(SICI)1097-4652(200001)182:1<1::AID-JCP1>3.0.CO;2-V · DOI
- 10.1042/EBC20160001 · DOI
- R. S. Marshall and R. D. Vierstra . Dynamic Regulation of the 26S Proteasome: From Synthesis to Degradation. Front Mol Biosci, 6:40, 2019. · DOI
- 10.1016/j.bbamcr.2013.08.012 · DOI
- 10.1016/S0891-5849(02)00824-9 · DOI
- 10.1159/000367694 · DOI
- 10.3389/fnmol.2014.00070 · DOI
- 10.1073/pnas.1816596116 · DOI · Paper page
- Mahlon A. Collins , Gemechu Mekonnen , and Frank W. Albert . Variation in ubiquitin system genes creates substrate-specific effects on proteasomal protein degradation. bioRxiv, 2021. · DOI · Paper page
- 10.1056/NEJMoa1206524 · DOI · Paper page
- 10.1016/j.ajhg.2010.10.031 · DOI
- 10.1002/art.33368 · DOI
- 2020, Proteasome subunit PSMC3 variants cause neurosensory syndrome combining deafness and cataract due to proteotoxic stress, EMBO Mol Med, 12, e11861, 10.15252/emmm.201911861 · DOI · Paper page
- 10.1172/JCI81260 · DOI
- 10.1016/j.ajpath.2011.11.012 · DOI · Paper page
- 10.1038/ng1846 · DOI
- 10.1111/j.1468-1331.2012.03846.x · DOI
- 2007, Association of microsatellite polymorphisms of the human 14q13.2 region with type 2 diabetes mellitus in Latvian and Finnish populations, Ann Hum Genet, 71, 772, 10.1111/j.1469-1809.2007.00372.x · DOI
- 10.1186/1471-2091-9-S1-S6 · DOI
- 10.1093/hmg/ddl401 · DOI
- 10.1053/j.gastro.2016.02.076 · DOI
- 10.1007/s00439-013-1355-7 · DOI
- 10.1038/ng.693 · DOI
- 2015, Genome-wide association study identifies a PSMD3 variant associated with neutropenia in interferon-based therapy for chronic hepatitis C, Hum Genet, 134, 279, 10.1007/s00439-014-1520-7 · DOI
- 2021, Front Plant Sci, 12, 695503, 10.3389/fpls.2021.695503 · DOI
- 10.1073/pnas.0605420103 · DOI · Paper page
- 10.1016/j.celrep.2014.10.065 · DOI · Paper page
- 10.1021/cb2002285 · DOI
- 10.1038/nsmb814 · DOI · Paper page
- 10.1038/s41467-019-13906-8 · DOI
- 10.1021/cb3001155 · DOI
- 10.1074/jbc.M116.727578 · DOI
- 10.1038/sj.emboj.7601058 · DOI
- 10.1074/jbc.M900783200 · DOI
- 2020, Efficiency of the four proteasome subtypes to degrade ubiquitinated or oxidized proteins, Sci Rep, 10, 15765, 10.1038/s41598-020-71550-5 · DOI
- J. Abi Habib , J. Lesenfants , N. Vigneron , and B. J. Van den Eynde . Functional Differences between Proteasome Subtypes. Cells, 11(3), 01 2022. · DOI
- 10.1016/S0960-9822(03)00417-2 · DOI
- 10.1152/ajpcell.00198.2016 · DOI
- 10.1074/jbc.M206279200 · DOI
- 10.1038/nature11867 · DOI
- 10.1126/science.1160489 · DOI · Paper page
- 2016, Mapping the Landscape of a Eukaryotic Degronome, Mol Cell, 63, 1055, 10.1016/j.molcel.2016.08.005 · DOI
- H. Ella , Y. Reiss , and T. Ravid . The Hunt for Degrons of the 26S Proteasome. Biomolecules, 9(6), 06 2019. · DOI
- 10.1093/emboj/cdg158 · DOI
- 10.1042/BJ20071239 · DOI
- 10.1073/pnas.071022298 · DOI · Paper page
- 10.1016/j.bbrc.2012.01.152 · DOI
- 10.1074/jbc.C400111200 · DOI
- 10.1016/j.bbamcr.2013.05.008 · DOI
- 10.1074/jbc.M211802200 · DOI
- 10.1016/S0014-5793(99)00467-6 · DOI
- 2014, The central domain of yeast transcription factor Rpn4 facilitates degradation of reporter protein in human cells, FEBS Lett, 588, 3713, 10.1016/j.febslet.2014.08.017 · DOI
- 10.1016/S0076-6879(05)98033-6 · DOI
- 2012, In vivo imaging of proteasome inhibition using a proteasome-sensitive fluorescent reporter, Cancer Sci, 103, 1730, 10.1111/j.1349-7006.2012.02352.x · DOI
- 10.1007/978-1-4939-0944-5_13 · DOI
- 10.1091/mbc.E15-07-0525 · DOI
- 10.1038/nbt1172 · DOI
- 10.1038/nbt1037 · DOI · Paper page
- 10.1038/nbt.2281 · DOI
- F. W. Albert , J. S. Bloom , J. Siegel , L. Day , and L. Kruglyak . Genetics of trans-regulatory variation in gene expression. Elife, 7, 07 2018. · DOI
- 10.1038/nature12904 · DOI · Paper page
- C. Brion , S. M. Lutz , and F. W. Albert . Simultaneous quantification of mRNA and protein in single cells reveals post-transcriptional effects of genetic variation. Elife, 9, Nov 2020. · DOI
- 10.1002/yea.1579 · DOI
- 10.1038/sj.emboj.7601476 · DOI
- 2010, The transcription activation domain of Rpn4 is separate from its degrons, Int J Biochem Cell Biol, 42, 282, 10.1016/j.biocel.2009.11.003 · DOI
- 10.1101/sqb.2009.74.013 · DOI
- 10.1038/nature08923 · DOI
- 10.1073/pnas.88.21.9828 · DOI
- 10.1002/pro.666 · DOI
- 10.1126/science.1183147 · DOI · Paper page
- 10.1126/science.3018930 · DOI
- 10.1074/jbc.270.20.12065 · DOI
- 10.1128/jb.169.11.4941-4945.1987 · DOI
- 10.1128/MCB.24.9.3670-3681.2004 · DOI
- 10.1371/journal.pgen.0020013 · DOI
- 10.1038/ng1674 · DOI
- 10.1128/MCB.10.8.4303 · DOI
- E. N. Smith and L. Kruglyak . Gene-environment interaction in yeast gene expression. PLoS Biol, 6(4):e83, Apr 2008. · DOI
- S. Lutz , K. Van Dyke , M. A. Feraru , and F. W. Albert . Multiple epistatic DNA variants in a single gene affect gene expression in trans. Genetics, 220(1), 01 2022. · DOI
- 2019, Proteasome subunit a1 overexpression preferentially drives canonical proteasome biogenesis and enhances stress tolerance in yeast, Sci Rep, 9, 08
- 10.1038/nature11468 · DOI · Paper page
- 10.1093/nar/gkr993 · DOI
- 10.1046/j.1365-2958.2002.02823.x · DOI
- 10.1126/scisignal.2001232 · DOI
- H. Salin , V. Fardeau , E. Piccini , G. Lelandais , V. Tanty , S. Lemoine , C. Jacq , and F. Devaux . Structure and properties of transcriptional networks driving selenite stress response in yeasts. BMC Genomics, 9:333, Jul 2008. · DOI
- 10.1038/s41586-018-0030-5 · DOI · Paper page
- A. N. Zyrina , E. A. Smirnova , O. V. Markova , F. F. Severin , and D. A. Knorre . Mitochondrial Superoxide Dismutase and Yap1p Act as a Signaling Module Contributing to Ethanol Tolerance of the Yeast Saccharomyces cerevisiae. Appl Environ Microbiol, 83(3), 02 2017. · DOI
- 10.1016/j.semcdb.2012.01.019 · DOI
- 10.1016/j.cell.2007.03.042 · DOI
- 2013, Genetics of proteasome diseases, Scientifica (Cairo), 2013, 637629
- 10.1073/pnas.1106015108 · DOI
- 10.1146/annurev-biochem-060310-170328 · DOI · Paper page
- 10.1016/j.molcel.2016.09.014 · DOI
- 2021, Emerging functions of branched ubiquitin chains, Cell Discov, 7, 6, 10.1038/s41421-020-00237-y · DOI
- 10.1038/360597a0 · DOI
- S. Kors , K. Geijtenbeek , E. Reits , and S. Schipper-Krom . Regulation of Proteasome Activity by (Post-)transcriptional Mechanisms. Front Mol Biosci, 6:48, 2019. · DOI
- C. Pla-Prats and N. H. Thoma . Quality control of protein complex assembly by the ubiquitin-proteasome system. Trends Cell Biol, Mar 2022. · DOI
- 2022, Quality control of protein complex composition, Mol Cell, 82, 1439, 10.1016/j.molcel.2022.02.029 · DOI
- 10.1016/j.cell.2009.05.005 · DOI
- 10.1038/nature14096 · DOI
- 10.1074/jbc.M314043200 · DOI
- 10.1002/(SICI)1097-0061(199910)15:14<1541::AID-YEA476>3.0.CO;2-K · DOI
- 10.1099/00221287-122-2-281 · DOI
- 10.1016/S0076-6879(10)70007-0 · DOI
- 10.1101/pdb.prot088807 · DOI
- 10.1038/nprot.2007.13 · DOI
- A. C. Ward . Rapid analysis of yeast transformants using colony-PCR. Biotechniques, 13(3):350, Sep 1992.
- F. Hahne , N. LeMeur , R. R. Brinkman , B. Ellis , P. Haaland , D. Sarkar , J. Spidlen , E. Strain , and R. Gentleman . flowCore: a Bioconductor package for high throughput flow cytometry. BMC Bioinformatics, 10:106, Apr 2009. · DOI
- 2015, Fitting linear mixed-effects models using lme4, Journal of Statistical Software, 67, 1
- 2017, lmerTest package: Tests in linear mixed effects models, Journal of Statistical Software, 82, 1
- 10.1093/bioinformatics/btp324 · DOI · Paper page
- 10.1093/bioinformatics/btp352 · DOI · Paper page
- 10.1186/1471-2105-13-S14-S8 · DOI
- 10.1101/gr.229102. Article published online before print in May 2002 · DOI · Paper page
- 2016, Evaluation of off-target and on-target scoring algorithms and integration into the guide RNA selection tool CRISPOR, Genome Biol, 17, 07
- 10.1038/nbt.3437 · DOI · Paper page
- 10.1016/0378-1119(87)90131-4 · DOI
- 10.1016/0378-1119(89)90359-4 · DOI
Metadata
- Authors
- Collins, M. A., Avery, R. R., & Albert, F. W.
- Affiliations
- University of Minnesota (US)
- Corresponding author
- Collins, Mahlon A.
- Albert, Frank W.
- Venue
- PLoS Genetics
- Publisher
- openRxiv
- Published
- 2021-11-24
- Volume
- 19
- Issue
- 5
- Pages
- e1010734-e1010734
- ISSN
- 1553-7390 (ISSN-L)
- PMC
- PMC10174532
- OpenAlex
- W4367597147
- Cited by
- 11
- References
- 1
- Citations by year
- 2026: 4 · 2025: 6 · 2022: 1
- FWCI
- 0.89
- Type
- journal article
- Language
- en
- Open access
- gold
- doi.org
- Licence
- cc-by
- Locations
- PLoS Genetics (publishedVersion, cc-by)
- bioRxiv (Cold Spring Harbor Laboratory) (acceptedVersion, cc-by)
- PubMed Central (publishedVersion, cc-by)
- PubMed (publishedVersion)
- DOAJ (DOAJ: Directory of Open Access Journals) (submittedVersion, cc-by-sa)
- Funders
- University of Minnesota
- National Institutes of Health (1f32gm128302-01a1)
- National Institute of General Medical Sciences (F32 GM128302, R35GM124676)
- Topics
- Life Sciences › Biochemistry, Genetics and Molecular Biology › Molecular Biology › Ubiquitin and proteasome pathways
- Life Sciences › Biochemistry, Genetics and Molecular Biology › Cell Biology › Autophagy in Disease and Therapy
- Life Sciences › Biochemistry, Genetics and Molecular Biology › Molecular Biology › Fungal and yeast genetics research
- Keywords
- proteasome activity, natural genetic variation, protein degradation, ubiquitin system, substrate specificity, Saccharomyces cerevisiae, Rpt6, 19S regulatory particle, genetic architecture, promoter polymorphism, gene mapping
- MeSH terms
- Saccharomyces cerevisiae, Genetic Variation, Ubiquitin, Saccharomyces cerevisiae Proteins, Proteasome Endopeptidase Complex, Proteolysis
About these checks
Registry, retraction, Cites and statistics results are computed, not judged, with one exception: a printed reference that no index lists is read once by a model before it counts as a citation error. Claims are extracted by a model and kept only when their quote appears verbatim in the text; each cited source is then checked, with a model’s help, for whether it says what the claim relies on. Those verdicts can be wrong — read the claim’s quote and the cited source before relying on one.
Statistics and arithmetic are recomputed, not judged.
Confidence bands are shown only for fields calibrated on our annotated test set. None is calibrated yet, so no band is shown.
What counts as a claim ›How we measure confidence ›How we check this ›
Are you an author, or do you see a problem with this page? Request a review
