PreprintCited by 4Protein Structure and DynamicsUbiquitin and proteasome pathwaysGenomics and Chromatin Dynamics

The DOI matches its Crossref record; 1 of the 1 references it cites were found in a registry or an index.

The PCI domains are “winged” HEAT domains

Open access

Preprint — published as 10.1371/journal.pone.0268664 · Paper page

Abstract

The HEAT domains are a family of helical hairpin repeat domains, composed of four or more hairpins. HEAT is derived from the names of four family members: h untingtin, eukaryotic translation e longation factor 3 (eEF3), protein phosphatase 2 regulatory A subunit (PP2A), and mechanistic t arget of rapamycin (mTOR). HEAT domain-containing proteins play roles in a wide range of cellular processes, such as protein synthesis, nuclear transport and metabolism, and cell signaling. The PCI domains are a related group of helical hairpin domains, with a “winged-helix” (WH) subdomain at their C-terminus, which is responsible for multi-subunit complex formation with other PCI domains. The name is derived from the complexes, where these domains are found: the P roteasome “lid” regulatory subcomplex, the C OP9 signalosome (CSN), and eukaryotic translation i nitiation factor 3 (eIF3). We noted that in structure homology searches using HEAT domains, sometimes PCI domains appeared in the search results ahead of other HEAT domains, which indicated that the PCI domains could be members of the HEAT domain family, and not a related but separate group. Here, we report extensive structure homology analysis of HEAT and PCI domains, both within and between the two groups of proteins. We present evidence that the PCI domains as a group have greater structural homology with individual groups of HEAT domains than some of the HEAT domain groups have among each other. Therefore, our results indicate that the PCI domains have evolved from a HEAT domain that acquired a WH subdomain. The WH subdomain in turn mediated selfassociation into a multi-subunit complex, which eventually evolved into the common ancestor of the Proteasome lid/CSN/eIF3.

Overview

The claims and statistics of this paper haven’t been checked yet.

Run the check — free, no account needed. It reads the open-access text and checks the sources it cites.

A few free checks a day · papers already verified open instantly · results are public

Integrity signals

Registry

Crossref · 10.1101/2022.05.05.490838

Cites

1 of 1 references verified0 citation errors · 0 not checkable

Statistics

Figures

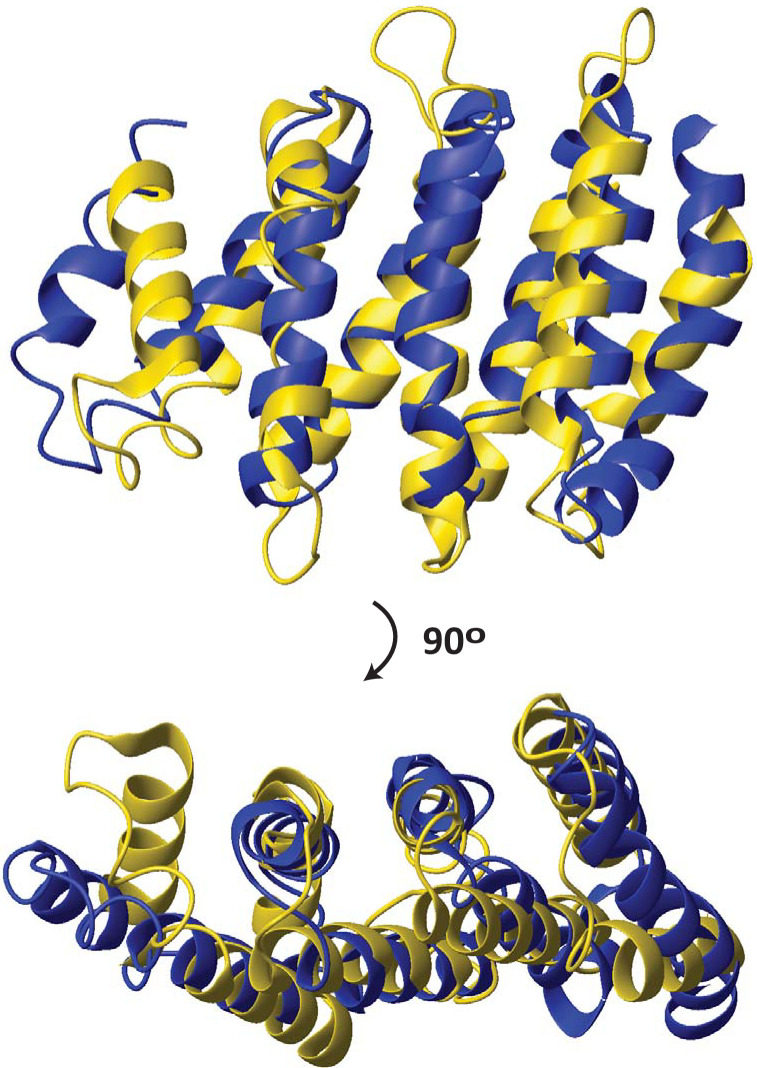
Fig 1 Structure alignment between the HEAT domain of CTF3 and the PCI domain of RPN12. DALI [27]-based structure alignment between the HEAT domain of S. cerevisiae CTF3 (6wuc.pdb, chain B) and the PCI domain of human RPN12 (5l4k.pdb, chain P). The structures are shown in ribbon. CTF3 is colored gold; RPN12 is colored blue. Only the aligned portions of the two structures are shown.
Fig 1 Structure alignment between the HEAT domain of CTF3 and the PCI domain of RPN12. DALI [27]-based structure alignment between the HEAT domain of S. cerevisiae CTF3 (6wuc.pdb, chain B) and the PCI domain of human RPN12 (5l4k.pdb, chain P). The structures are shown in ribbon. CTF3 is colored gold; RPN12 is colored blue. Only the aligned portions of the two structures are shown.CC BY · PubMed Central
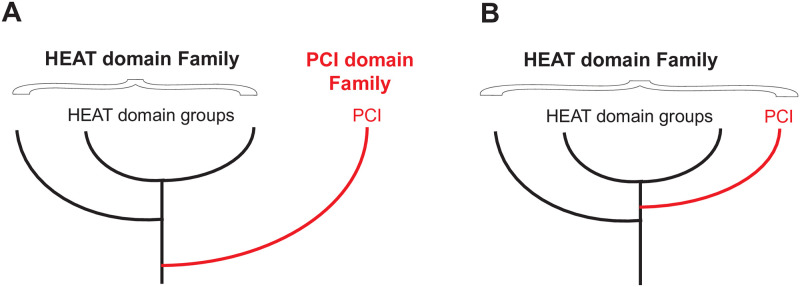
Fig 2 Possible alternatives for the evolution of PCI domains. A. PCI domains (red) diverged from HEAT domains before the last common ancestor of all HEAT domains and constitute a separate family of domains, as currently thought. B. The PCI domains are members of the HEAT domain family that acquired a WH subdomain after the last common HEAT domain ancestor.
Fig 2 Possible alternatives for the evolution of PCI domains. A. PCI domains (red) diverged from HEAT domains before the last common ancestor of all HEAT domains and constitute a separate family of domains, as currently thought. B. The PCI domains are members of the HEAT domain family that acquired a WH subdomain after the last common HEAT domain ancestor.CC BY · PubMed Central
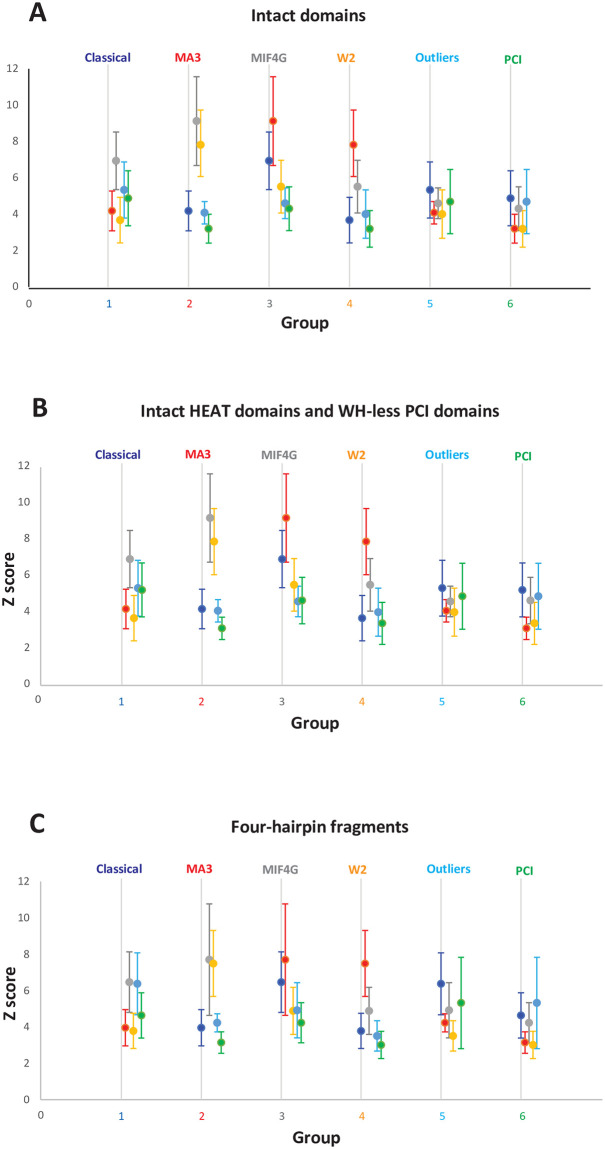
Fig 3 Structure similarity scores among groups of HEAT and PCI domains. Average pairwise DALI [27] Z-scores +/- standard deviation (SD) between members of individual HEAT and PCI domain groups. Groups are labeled and color-coded. The Z-scores of each group with the other five groups are shown on the Y-axis, with slight offset along the X-axis, and color-coded. Classic HEAT domains (Group 1) are navy. MA3 domains (Group 2) are red. MIF4G domains (Group 3) are grey. W2 domains (Group 4) are orange. Outlier HEAT domains (Group 5) are light blue. PCI domains are green. Intragroup Z-scores are not shown.
Fig 3 Structure similarity scores among groups of HEAT and PCI domains. Average pairwise DALI [27] Z-scores +/- standard deviation (SD) between members of individual HEAT and PCI domain groups. Groups are labeled and color-coded. The Z-scores of each group with the other five groups are shown on the Y-axis, with slight offset along the X-axis, and color-coded. Classic HEAT domains (Group 1) are navy. MA3 domains (Group 2) are red. MIF4G domains (Group 3) are grey. W2 domains (Group 4) are orange. Outlier HEAT domains (Group 5) are light blue. PCI domains are green. Intragroup Z-scores are not shown.CC BY · PubMed Central
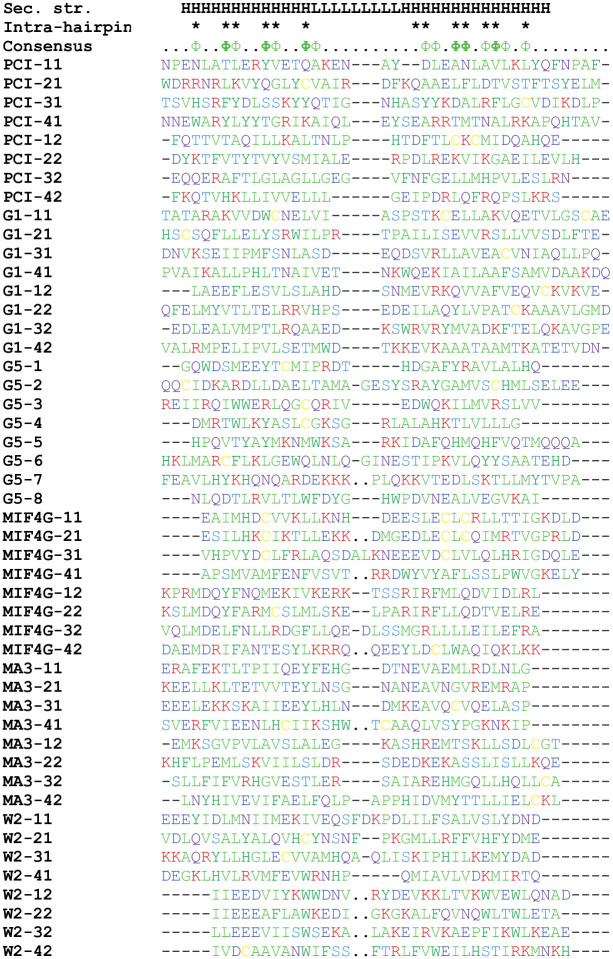
Fig 4 Structure-based sequence alignment of hairpins from HEAT and PCI domains. Eight hairpins per group were used for the alignment. Alignment viewer (https://alignmentviewer.org/) with Clustal residue coloring scheme was used, instead of conservation, because there were no detectable sequence conservation patterns, besides hydrophobic side chains at buried positions. Secondary structure is shown above the alignment: H, helix; L, loop. Positions of intra-hairpin contacts are marked with a “*” above the alignment. Note that side chains at the same position in the alignment may contact both the other helix in the hairpin and an adjacent hairpin, or contact one or the other in different hairpins, due to variations in inter-helix angles and orientations. Positions with hydrophobic side chains in >50% of sequences are labeled with “Φ”; positions with hydrophobic side chains in >75% of the sequences are labeled with “Φ” in bold. Gaps are marked with “-“. Positions of deleted amino-acid sequences in the interhelix loop are marked with “‥”.
Fig 4 Structure-based sequence alignment of hairpins from HEAT and PCI domains. Eight hairpins per group were used for the alignment. Alignment viewer (https://alignmentviewer.org/) with Clustal residue coloring scheme was used, instead of conservation, because there were no detectable sequence conservation patterns, besides hydrophobic side chains at buried positions. Secondary structure is shown above the alignment: H, helix; L, loop. Positions of intra-hairpin contacts are marked with a “*” above the alignment. Note that side chains at the same position in the alignment may contact both the other helix in the hairpin and an adjacent hairpin, or contact one or the other in different hairpins, due to variations in inter-helix angles and orientations. Positions with hydrophobic side chains in >50% of sequences are labeled with “Φ”; positions with hydrophobic side chains in >75% of the sequences are labeled with “Φ” in bold. Gaps are marked with “-“. Positions of deleted amino-acid sequences in the interhelix loop are marked with “‥”.CC BY · PubMed Central
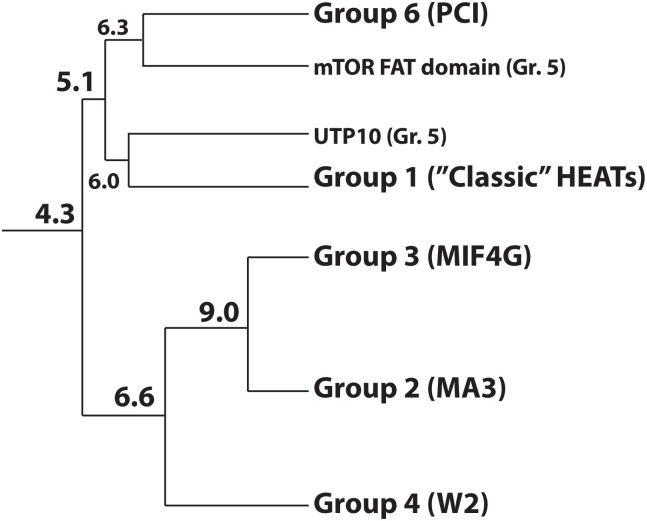
Fig 5 Possible evolutionary tree of HEAT and PCI domains. The dendrogram is based on average structure similarity Z scores from the DALI server [27] between individual groups of domains and branches, using intact HEAT domains and WH-less PCI domains. The outliers, UTP10 and the FAT domain of mTOR, which had been operationally grouped together as Group 5 in Fig 3, Table 1, and Table in S1 Table, had slightly lower structure similarity between each other (Z score 5.7) than their highest average Z scores with other groups (UTP10, Z score 6.0 with Group 1; and the mTOR FAT domain, Z score 5.9 with Group 6). Therefore, these two structures were not considered as a group in building the dendrogram and were added separately, instead, and are shown in smaller font.
Fig 5 Possible evolutionary tree of HEAT and PCI domains. The dendrogram is based on average structure similarity Z scores from the DALI server [27] between individual groups of domains and branches, using intact HEAT domains and WH-less PCI domains. The outliers, UTP10 and the FAT domain of mTOR, which had been operationally grouped together as Group 5 in Fig 3, Table 1, and Table in S1 Table, had slightly lower structure similarity between each other (Z score 5.7) than their highest average Z scores with other groups (UTP10, Z score 6.0 with Group 1; and the mTOR FAT domain, Z score 5.9 with Group 6). Therefore, these two structures were not considered as a group in building the dendrogram and were added separately, instead, and are shown in smaller font.CC BY · PubMed Central

Verification

Claims the paper makes

The claims and statistics of this paper haven’t been checked yet.

Run the check — free, no account needed. It reads the open-access text and checks the sources it cites.

A few free checks a day · papers already verified open instantly · results are public

Self-check

Percentages, sums and reported differences re-computed from the paper’s own numbers.

The self-check needs the paper’s full text.

Citations

Cites

Research works printed but not linked: 34

  1. 10.1006/jsbi.2001.4392 · DOI
  2. 10.1006/jmbi.2001.4624 · DOI
  3. 10.1016/S0959-440X(99)80052-9 · DOI
  4. 10.1242/jcs.185710 · DOI
  5. 10.1038/ng1095-115 · DOI
  6. 10.1002/pro.5560070521 · DOI
  7. 10.1016/S0968-0004(98)01217-1 · DOI
  8. 10.1186/1471-2105-6-71 · DOI
  9. 10.1074/jbc.M405158200 · DOI
  10. 10.1016/j.str.2006.03.012 · DOI
  11. 10.1074/jbc.M311055200 · DOI
  12. 10.1016/S1097-2765(01)00167-8 · DOI
  13. 10.1038/nature14891 · DOI
  14. 10.1016/j.str.2010.02.008 · DOI
  15. 10.1016/j.str.2013.04.002 · DOI
  16. 10.1074/jbc.M010188200 · DOI
  17. 10.1074/jbc.273.29.18573 · DOI
  18. 10.1074/jbc.272.43.27042 · DOI
  19. 10.1074/jbc.M107790200 · DOI
  20. 10.1074/jbc.M007236200 · DOI
  21. 10.1091/mbc.11.11.3993 · DOI
  22. 10.1128/MCB.18.8.4935 · DOI
  23. 10.1007/978-1-0716-0270-6_3 · DOI
  24. 10.1016/j.jmb.2006.05.021 · DOI
  25. 10.1002/pro.5560040819 · DOI
  26. 10.1016/S0065-3233(00)54007-8 · DOI
  27. 10.1016/j.jmb.2006.03.037 · DOI
  28. 10.1017/S0033583505004026 · DOI
  29. 10.1021/bi051271v · DOI
  30. 10.1016/S0968-0004(00)01628-5 · DOI
  31. 10.1093/nar/gkab1061 · DOI · Paper page
  32. 10.1093/nar/28.1.235 · DOI · Paper page
  33. 10.1007/s13238-010-0070-6 · DOI
  34. 10.1016/0263-7855(96)00009-4 · DOI

Metadata

Authors
Paul, E. E., & Marintchev, A.
Affiliations
Boston University (US)
Corresponding author
Marintchev, Assen
Venue
PLoS ONE
Publisher
openRxiv
Published
2022-05-05
Volume
17
Issue
9
Pages
e0268664-e0268664
ISSN
1932-6203 (ISSN-L)
OpenAlex
W4295439732
Cited by
4
References
1
Citations by year
2025: 2 · 2024: 2
FWCI
0.33
Type
journal article
Language
en
Open access
Licence
cc-by
Locations
  • PLoS ONE (publishedVersion, cc-by)
  • bioRxiv (Cold Spring Harbor Laboratory) (acceptedVersion, cc-by-nc)
  • PubMed Central (publishedVersion, cc-by)
  • PubMed (publishedVersion)
  • DOAJ (DOAJ: Directory of Open Access Journals) (submittedVersion)
Funders
National Institute of General Medical Sciences (GM134113, R01GM134113)
Topics
  • Life Sciences › Biochemistry, Genetics and Molecular Biology › Molecular Biology › Protein Structure and Dynamics
  • Life Sciences › Biochemistry, Genetics and Molecular Biology › Molecular Biology › Ubiquitin and proteasome pathways
  • Life Sciences › Biochemistry, Genetics and Molecular Biology › Molecular Biology › Genomics and Chromatin Dynamics
Keywords
protein domain evolution, COP9 signalosome, eIF3, structural similarity
MeSH terms
COP9 Signalosome Complex, Hot Temperature, Proteins, Eukaryotic Initiation Factor-3, Percutaneous Coronary Intervention

About these checks

Registry, retraction, Cites and statistics results are computed, not judged, with one exception: a printed reference that no index lists is read once by a model before it counts as a citation error. Claims are extracted by a model and kept only when their quote appears verbatim in the text; each cited source is then checked, with a model’s help, for whether it says what the claim relies on. Those verdicts can be wrong — read the claim’s quote and the cited source before relying on one.

Statistics and arithmetic are recomputed, not judged.

Confidence bands are shown only for fields calibrated on our annotated test set. None is calibrated yet, so no band is shown.

What counts as a claim ›How we measure confidence ›How we check this ›

Are you an author, or do you see a problem with this page? Request a review