CoChat

Graph-based pangenomics maximizes genotyping density and reveals structural impacts on fungal resistance

Open access
Vaughn, Justin N., Branham, Sandra E., Abernathy, Brian L., Hulse-Kemp, Amanda M., Rivers, Adam, Levi, Amnon, Wechter, William P. · 2022 · Nature Communications

Preprint — published as 10.1038/s41467-022-35621-7

The DOI matches its Crossref record; 39 of the 39 references it cites were found in a registry or an index.

Abstract

The genomic sequences segregating in experimental populations are often highly divergent from the community reference and from one another. Such divergence is problematic under various short-read-based genotyping strategies. In addition, large structural differences are often invisible despite being strong candidates for causal variation. These issues are exacerbated in specialty crop breeding programs with fewer, lower-quality sequence resources. We examined the benefits of complete genomic information, based on long-read assemblies, in a biparental mapping experiment segregating at numerous disease resistance loci in the non-model crop, melon ( Cucumis melo ). We find that a graph-based approach, which uses both parental genomes, results in 19% more variants callable across the population and raw allele calls with a 2 to 3-fold error-rate reduction, even relative to single reference approaches using a parent genome. We show that structural variation has played a substantial role in shaping two Fusarium wilt resistance loci with known causal genes. We also report on the genetics of powdery mildew resistance, where copy number variation and local recombination suppression are directly interpretable via parental genome alignments. Benefits observed, even in this low-resolution biparental experiment, will inevitably be amplified in more complex populations.

Overview

The claims and statistics of this paper haven’t been checked yet.

Free: it reads the open-access text and checks the first 5 claims that cite a source we can check. Create a free account to check every claim.

A few free checks a day · papers already verified open instantly · results are public

Integrity signals

Registry

Crossref · 10.1101/2022.06.10.495676

Cites

39 of 39 references verified0 citation errors · 0 not checkable

Statistics

Figures

Fig. 1 Pangenome of three melon sequences and sources of genomic sequence. a Relative presence/absence of genome sequence is depicted for pairwise comparison (based on multi-sequence alignments). Only variants >50 bp are shown but their percentage of the total is indicated parenthetically. b Chromosome-scale MSA of Chr01. Sequences do not contain gaps and so are spatially offset. See mauve viewer for details (https://darlinglab.org/mauve/user-guide/viewer.html). Colors reflect locally collinear blocks. Rare, relative inversions appear below the forward strand sequence. The orthologous region shown in c is highlighted in orange. c A 60 kb sample from Chr01 MSA highlighted in b is shown with light gray indicating identical columns and black representing variable columns. Dark gray regions in DHL92 are “N”s. The lower panel is a dotplot representation of this region with AY along the Y-axis of each. Red indicates an identical region and blue, a highly similar match. The last plot is AY by self. Blue boxes highlight the tandemly repetitive nature of the AY insertion. Note this repeat region falls over the long Ns tract in DHL92.
Fig. 1 Pangenome of three melon sequences and sources of genomic sequence. a Relative presence/absence of genome sequence is depicted for pairwise comparison (based on multi-sequence alignments). Only variants >50 bp are shown but their percentage of the total is indicated parenthetically. b Chromosome-scale MSA of Chr01. Sequences do not contain gaps and so are spatially offset. See mauve viewer for details (https://darlinglab.org/mauve/user-guide/viewer.html). Colors reflect locally collinear blocks. Rare, relative inversions appear below the forward strand sequence. The orthologous region shown in c is highlighted in orange. c A 60 kb sample from Chr01 MSA highlighted in b is shown with light gray indicating identical columns and black representing variable columns. Dark gray regions in DHL92 are “N”s. The lower panel is a dotplot representation of this region with AY along the Y-axis of each. Red indicates an identical region and blue, a highly similar match. The last plot is AY by self. Blue boxes highlight the tandemly repetitive nature of the AY insertion. Note this repeat region falls over the long Ns tract in DHL92.CC BY · PubMed Central
Fig. 2 PanPipes flow diagram. PanPipes incorporates pangenome alignment information during short-read mapping. Files are shown as blocks and each step is annotated on the right. Gray indicates that files originate from outside the pipeline. “Surject” means to transform graph coordinates into coordinates of one of its constituent paths.
Fig. 2 PanPipes flow diagram. PanPipes incorporates pangenome alignment information during short-read mapping. Files are shown as blocks and each step is annotated on the right. Gray indicates that files originate from outside the pipeline. “Surject” means to transform graph coordinates into coordinates of one of its constituent paths.CC BY · PubMed Central
Fig. 3 Genotyping efficacy of biparental population across methods. Three methods used were (1) a graph-based approach using the pangenome—PanPipes, (2) single-reference approach using newly developed MR1 assembly—SR-MR1, and (3) a single-reference approach using currently available DHL92 assembly—SR-DHL92. a For skim-seq chemistry, the three methods are compared in terms of starting variants and variants remaining after various filtering criteria described in text. b Comparable to a but for GBS chemistry. c Error rate assessment is illustrated in a toy example. Green Xs indicate missing calls. Purple boxes indicate post-imputation assessment of miscalled alleles. Yellow highlighting indicates a likely contaminant haplotype not found in either parent. d Box plots depict relative error rates. Adjacent table shows grand totals for effective allele calls across chemistries and methods, where G GBS, S Skim-seq. n values are total explicit allele calls (see c). Source data are provided as a Source Data file.
Fig. 3 Genotyping efficacy of biparental population across methods. Three methods used were (1) a graph-based approach using the pangenome—PanPipes, (2) single-reference approach using newly developed MR1 assembly—SR-MR1, and (3) a single-reference approach using currently available DHL92 assembly—SR-DHL92. a For skim-seq chemistry, the three methods are compared in terms of starting variants and variants remaining after various filtering criteria described in text. b Comparable to a but for GBS chemistry. c Error rate assessment is illustrated in a toy example. Green Xs indicate missing calls. Purple boxes indicate post-imputation assessment of miscalled alleles. Yellow highlighting indicates a likely contaminant haplotype not found in either parent. d Box plots depict relative error rates. Adjacent table shows grand totals for effective allele calls across chemistries and methods, where G GBS, S Skim-seq. n values are total explicit allele calls (see c). Source data are provided as a Source Data file.CC BY · PubMed Central
Fig. 4 Genetic resolution of the fom2 locus using assorted methods. Both panels show association statistic for all variants across the fom2 interval (see “Methods”). The chemical and analytical genotyping factor combinations are indicated at the far right. Because PanPipes uses both references simultaneously, this factor is shown as a dotted line. “Raw” indicates initial set of filtered variants and FSFHap is the result of imputing the Raw variants. The left panel presents an expanded view of the interval, while the right shows the 700 kb bounding the previously fine-mapped NBS-LRR protein, shown as a vertical black bar in all plots. The combination skim-seq/SR-DHL92 could not be properly imputed and so only “Raw” is shown.
Fig. 4 Genetic resolution of the fom2 locus using assorted methods. Both panels show association statistic for all variants across the fom2 interval (see “Methods”). The chemical and analytical genotyping factor combinations are indicated at the far right. Because PanPipes uses both references simultaneously, this factor is shown as a dotted line. “Raw” indicates initial set of filtered variants and FSFHap is the result of imputing the Raw variants. The left panel presents an expanded view of the interval, while the right shows the 700 kb bounding the previously fine-mapped NBS-LRR protein, shown as a vertical black bar in all plots. The combination skim-seq/SR-DHL92 could not be properly imputed and so only “Raw” is shown.CC BY · PubMed Central
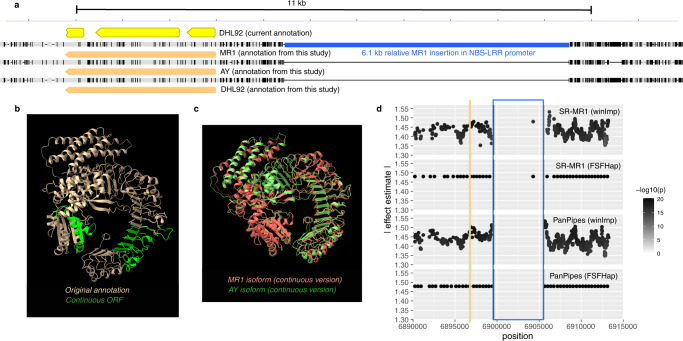
Fig. 5 Causal variant analysis of fom2 locus. a Nucleotide-level depiction of parent and DHL92 alignments across the fom2 locus. The pre-existing 3 exon model of the NBS-LRR protein is shown in yellow; our single-exon annotations are shown in orange. The ~6.5 kb insertion in MR1’s promoter region of the NBS-LRR is shown in blue. Gray indicates identical bases across all three lines. Black lines reflect variant columns. b AlphaFold2 predictions of continuous open reading frame (ORF) models with green reflecting the included introns. c MR1 and AY isoforms of the continuous model transposed as closely as possible. d Allelic effect estimate for variants in the fom2 region with FSFHap imputation (also depicted in Fig. 4) as well as explicit window-based imputation (winImp) for both PanPipes and SR-MR1 (see “Methods”). Orange bar indicates the center of the NBS-LRR ORF and blue box shows the MR1 insertion span. Variation in winImp calls, relative to FSFHap, results from less aggressive calling algorithm. Source data are provided as a Source Data file.
Fig. 5 Causal variant analysis of fom2 locus. a Nucleotide-level depiction of parent and DHL92 alignments across the fom2 locus. The pre-existing 3 exon model of the NBS-LRR protein is shown in yellow; our single-exon annotations are shown in orange. The ~6.5 kb insertion in MR1’s promoter region of the NBS-LRR is shown in blue. Gray indicates identical bases across all three lines. Black lines reflect variant columns. b AlphaFold2 predictions of continuous open reading frame (ORF) models with green reflecting the included introns. c MR1 and AY isoforms of the continuous model transposed as closely as possible. d Allelic effect estimate for variants in the fom2 region with FSFHap imputation (also depicted in Fig. 4) as well as explicit window-based imputation (winImp) for both PanPipes and SR-MR1 (see “Methods”). Orange bar indicates the center of the NBS-LRR ORF and blue box shows the MR1 insertion span. Variation in winImp calls, relative to FSFHap, results from less aggressive calling algorithm. Source data are provided as a Source Data file.CC BY · PubMed Central
Fig. 6 Substantial tandem duplication of the fom1 locus on Chr 09. a Association profiles across various genotyping/imputation methods described in main text. Estimated effects are depicted on y-axis and darkness of dot indicates p value (see “Methods”). Blue box highlights the known fom1 NBS-LRR while green box defines paralog position identified from this study. b Dotplot between AY and MR1 (origin at top left) shows substantial duplication of large NBS-LRR contatining region. Colored boxes are consistent across a and b. c Amino-acid alignment of DHL92 annotated NBS-LRR, AY Fom1 translation, and both paralogs of Fom1 translation from MR1. The LRR region is highlighted in yellow and the NBS domain is unshaded. The N-terminal TIR domain is not shown due to space constraints. Variation in winImp calls, relative to FSFHap, results from less aggressive calling algorithm. Source data are provided as a Source Data file.
Fig. 6 Substantial tandem duplication of the fom1 locus on Chr 09. a Association profiles across various genotyping/imputation methods described in main text. Estimated effects are depicted on y-axis and darkness of dot indicates p value (see “Methods”). Blue box highlights the known fom1 NBS-LRR while green box defines paralog position identified from this study. b Dotplot between AY and MR1 (origin at top left) shows substantial duplication of large NBS-LRR contatining region. Colored boxes are consistent across a and b. c Amino-acid alignment of DHL92 annotated NBS-LRR, AY Fom1 translation, and both paralogs of Fom1 translation from MR1. The LRR region is highlighted in yellow and the NBS domain is unshaded. The N-terminal TIR domain is not shown due to space constraints. Variation in winImp calls, relative to FSFHap, results from less aggressive calling algorithm. Source data are provided as a Source Data file.CC BY · PubMed Central
Fig. 7 Rampant NBS-LRR turnover underlying powdery mildew resistance. a Genome-wide association profile for powdery mildew resistance. The dashed and solid line indicated the false discovery rate and Bonferroni thresholds, as calculated by GAPIT3 (see “Methods”). The green solid line indicated the Bonferroni < cutoff. Inset table describes salient features of lead variants based on winImp genotypes. b Detailed view of estimated effect size around the Chr05, large-effect QTL under both winImp and FSFHap imputation. c Dotplot of association plateau region between AY and MR1. Gray bars indicate positions of NBS-LRR homology. Source data are provided as a Source Data file.
Fig. 7 Rampant NBS-LRR turnover underlying powdery mildew resistance. a Genome-wide association profile for powdery mildew resistance. The dashed and solid line indicated the false discovery rate and Bonferroni thresholds, as calculated by GAPIT3 (see “Methods”). The green solid line indicated the Bonferroni < cutoff. Inset table describes salient features of lead variants based on winImp genotypes. b Detailed view of estimated effect size around the Chr05, large-effect QTL under both winImp and FSFHap imputation. c Dotplot of association plateau region between AY and MR1. Gray bars indicate positions of NBS-LRR homology. Source data are provided as a Source Data file.CC BY · PubMed Central

Verification

Claims the paper makes

The claims and statistics of this paper haven’t been checked yet.

Free: it reads the open-access text and checks the first 5 claims that cite a source we can check. Create a free account to check every claim.

A few free checks a day · papers already verified open instantly · results are public

Self-check

Percentages, sums and reported differences re-computed from the paper’s own numbers.

The self-check needs the paper’s full text.

Citations

Cites

Show all 39 references

Research works printed but not linked: 3

  1. 10.1186/gb-2006-7-4-212 · DOI
  2. 1985, Resistant reaction of muskmelon line MR-1 against downy mildew, in Phytopathology, 75, 504
  3. 2014, Novel Methods to Optimize Genotypic Imputation for Low-Coverage, Next-Generation Sequence Data in Crop Plants, The Plant Genome, 7, plantgenome2014.

Metadata

Authors
Vaughn, J. N., Branham, S. E., Abernathy, B. L., Hulse-Kemp, A. M., Rivers, A., Levi, A., & Wechter, W. P.
Affiliations
  • Agricultural Research Service (US)
  • Clemson University (US)
  • University of Georgia (US)
Corresponding author
  • Vaughn, Justin N.
  • Wechter, William P.
Venue
Nature Communications
Publisher
openRxiv
Published
2022-06-11
Volume
13
Issue
1
Pages
7897-7897
ISSN
2041-1723 (ISSN-L)
OpenAlex
W4312192998
Cited by
34
References
39
Citations by year
2026: 5 · 2025: 12 · 2024: 10 · 2023: 6 · 2022: 1
FWCI
4.37
Type
journal article
Language
en
Open access
Licence
cc-by
Locations
  • Nature Communications (publishedVersion, cc-by)
  • bioRxiv (Cold Spring Harbor Laboratory) (acceptedVersion)
  • PubMed Central (publishedVersion, cc-by)
  • PubMed (publishedVersion)
  • RePEc: Research Papers in Economics (submittedVersion)
  • DOAJ (DOAJ: Directory of Open Access Journals) (submittedVersion, cc-by-sa)
Funders
  • U.S. Department of Agriculture (6066-21310-005-00-D, USDA-SCRI 6066-21310-005-00-D, 6080-22000-028-00, 6080-22000-028)
  • Agricultural Research Service (6080-22000-028-00, USDA-SCRI 6066-21310-005-00-D, 6080-22000-028-00D, 6080-22000-028, 6066-21310-005-00-D)
Topics
  • Life Sciences › Biochemistry, Genetics and Molecular Biology › Genetics › Advances in Cucurbitaceae Research
  • Life Sciences › Biochemistry, Genetics and Molecular Biology › Molecular Biology › Genomics and Phylogenetic Studies
  • Life Sciences › Biochemistry, Genetics and Molecular Biology › Genetics › Genetic Mapping and Diversity in Plants and Animals
Keywords
Cucumis melo, Fusarium wilt resistance, powdery mildew resistance, structural variants, copy number variation, long-read genome assembly, allele calling, recombination suppression, disease resistance loci
MeSH terms
Plant Breeding, Genotype, Cucurbitaceae, Cucumis melo, Quantitative Trait Loci, DNA Copy Number Variations

About these checks

Registry, retraction, Cites and statistics results are computed, not judged, with one exception: a printed reference that no index lists is read once by a model before it counts as a citation error. Claims are extracted by a model and kept only when their quote appears verbatim in the text; each cited source is then checked, with a model’s help, for whether it says what the claim relies on. Those verdicts can be wrong — read the claim’s quote and the cited source before relying on one.

Statistics and arithmetic are recomputed, not judged.

Confidence bands are shown only for fields calibrated on our annotated test set. None is calibrated yet, so no band is shown.

What counts as a claim ›How we measure confidence ›How we check this ›

Are you an author, or do you see a problem with this page? Request a review

How to cite

Cite CoChat for the checks on this page, and the paper for its own findings.

This page
CoChat. (2026). Citation check: Graph-based pangenomics maximizes genotyping density and reveals structural impacts on fungal resistance. https://app.cochat.ai/papers/10.1101/2022.06.10.495676
The paper
Vaughn, J. N., Branham, S. E., Abernathy, B. L., Hulse-Kemp, A. M., Rivers, A., Levi, A., & Wechter, W. P. (2022). Graph-based pangenomics maximizes genotyping density and reveals structural impacts on fungal resistance. Nature Communications. https://doi.org/10.1101/2022.06.10.495676

Data sources

Bibliographic data: Semantic Scholar, OpenAlex, Crossref.

Contains information from the Semantic Scholar Academic Graph Datasets, made available under the ODC Attribution License (ODC-BY 1.0).

Semantic Scholar’s data is described in: Kinney, R., et al. (2023). The Semantic Scholar Open Data Platform. arXiv:2301.10140.