Student or educator? Sign up with your school email and get 6 months of Pro free.
PreprintCited by 7Bacterial Genetics and BiotechnologyVector-borne infectious diseasesBiochemical and Structural Characterization

The DOI matches its Crossref record; 1 of the 1 references it cites were found in a registry or an index.

Borrelia burgdorferi PlzA is a cyclic-di-GMP dependent DNA and RNA binding protein

Open access

Preprint — published as 10.1111/mmi.15254 · Paper page

Abstract

The PilZ domain-containing protein, PlzA, is the only known cyclic di-GMP binding protein encoded by all Lyme disease spirochetes. PlzA has been implicated in the regulation of many borrelial processes, but the effector mechanism of PlzA was not previously known. Here we report that PlzA can bind DNA and RNA and that nucleic acid binding requires c-di-GMP, with the affinity of PlzA for nucleic acids increasing as concentrations of c-di-GMP were increased. A mutant PlzA that is incapable of binding c-di-GMP did not bind to any tested nucleic acids. We also determined that PlzA interacts predominantly with the major groove of DNA and that sequence length plays a role in DNA binding affinity. PlzA is a dual-domain protein with a PilZ-like N-terminal domain linked to a canonical C-terminal PilZ domain. Dissection of the domains demonstrated that the separated N-terminal domain bound nucleic acids independently of c-di-GMP. The C-terminal domain, which includes the c-di-GMP binding motifs, did not bind nucleic acids under any tested conditions. Our data are supported by computational docking, which predicts that c-di-GMP binding at the C-terminal domain stabilizes the overall protein structure and facilitates PlzA-DNA interactions via residues in the N-terminal domain. Based on our data, we propose that levels of c-di-GMP during the various stages of the enzootic life cycle direct PlzA binding to regulatory targets.

Overview

The claims and statistics of this paper haven’t been checked yet.

Run the check — free, no account needed. It reads the open-access text and checks the sources it cites.

A few free checks a day · papers already verified open instantly · results are public

Integrity signals

Registry

Crossref · 10.1101/2023.01.30.526351

Cites

1 of 1 references verified0 citation errors · 0 not checkable

Statistics

Figures

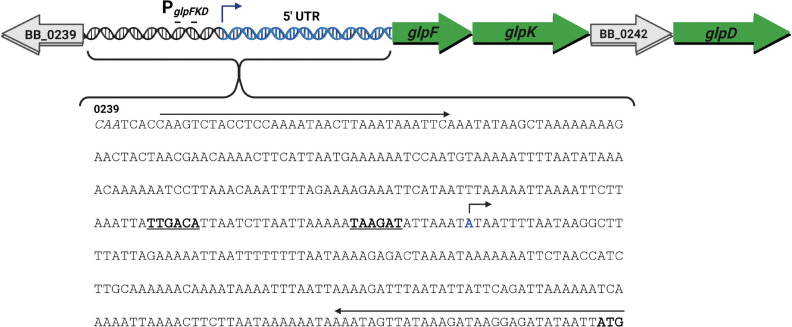
FIGURE 1 The glpFKD operon, 5’ UTR, and designed probe schematic. The glycerol catabolism gene operon (glpFKD) contains four genes: glpF (BB_0240, glycerol uptake facilitator protein), glpK (BB_0241, glycerol kinase), BB_0242 (hypothetical protein), and glpD (BB_0243, glycerol-3-phosphate dehydrogenase). The promoter and transcriptional boundaries were previously mapped (Grove et al., 2017). The −35 and −10 sites are bolded and underlined. The transcriptional start site nucleotide is highlighted in blue and topped with an arrow indicating the direction of transcription. The start of the glpF ORF is marked by the bolded ATG, while the start of the upstream BB_0239 ORF is labeled, and its nucleotides are italicized. The long arrows indicate the location of primers used to generate a large probe incorporating the entire intergenic region which is denoted as glpFKD(−219) for initial DNA binding studies.
FIGURE 1 The glpFKD operon, 5’ UTR, and designed probe schematic. The glycerol catabolism gene operon (glpFKD) contains four genes: glpF (BB_0240, glycerol uptake facilitator protein), glpK (BB_0241, glycerol kinase), BB_0242 (hypothetical protein), and glpD (BB_0243, glycerol-3-phosphate dehydrogenase). The promoter and transcriptional boundaries were previously mapped (Grove et al., 2017). The −35 and −10 sites are bolded and underlined. The transcriptional start site nucleotide is highlighted in blue and topped with an arrow indicating the direction of transcription. The start of the glpF ORF is marked by the bolded ATG, while the start of the upstream BB_0239 ORF is labeled, and its nucleotides are italicized. The long arrows indicate the location of primers used to generate a large probe incorporating the entire intergenic region which is denoted as glpFKD(−219) for initial DNA binding studies.CC BY-NC-ND · PubMed Central
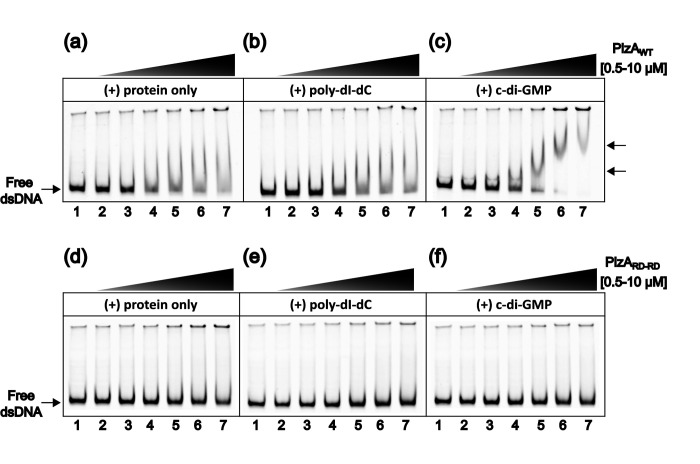
FIGURE 2 DNA binding by PlzA is c-di-GMP dependent. (a) EMSA with increasing concentrations of PlzAWT showing binding to glpFKD(−219) DNA. The mixture was incubated for 10 min before electrophoresis. (b) The same EMSA mixture as in (a) but with a final concentration of 2.5 ng/μL of the nonspecific competitor poly-dI-dC. Protein was incubated with poly-dI-dC for 5 min prior to the addition of labeled glpFKD(−219) probe. (c) The same EMSA mixture as in (b) but supplemented with 100 μM c-di-GMP. Protein was incubated with c-di-GMP for 5 min prior to the addition of any nucleic acids. Arrows indicate PlzA- glpFKD(−219) complexes. Lane 1 in (a-c) is the probe only control, containing 50 nM of probe. Protein concentrations are as follows in each subsequent lane: Lane 2: 0.5 μM, Lane 3: 1 μM, Lane 4: 2.5 μM, Lane 5: 5 μM, Lane 6: 7.5 μM, and Lane 7: 10 μM. (d), (e), (f) EMSA experiments as in (a), (b), and (c), respectively, but performed with the mutant PlzARD-RD protein. All conditions were performed identically as with PlzAWT. Each panel is a representative gel from separate EMSAs which were performed in triplicate (PlzAWT) or duplicate (PlzARD-RD).
FIGURE 2 DNA binding by PlzA is c-di-GMP dependent. (a) EMSA with increasing concentrations of PlzAWT showing binding to glpFKD(−219) DNA. The mixture was incubated for 10 min before electrophoresis. (b) The same EMSA mixture as in (a) but with a final concentration of 2.5 ng/μL of the nonspecific competitor poly-dI-dC. Protein was incubated with poly-dI-dC for 5 min prior to the addition of labeled glpFKD(−219) probe. (c) The same EMSA mixture as in (b) but supplemented with 100 μM c-di-GMP. Protein was incubated with c-di-GMP for 5 min prior to the addition of any nucleic acids. Arrows indicate PlzA- glpFKD(−219) complexes. Lane 1 in (a-c) is the probe only control, containing 50 nM of probe. Protein concentrations are as follows in each subsequent lane: Lane 2: 0.5 μM, Lane 3: 1 μM, Lane 4: 2.5 μM, Lane 5: 5 μM, Lane 6: 7.5 μM, and Lane 7: 10 μM. (d), (e), (f) EMSA experiments as in (a), (b), and (c), respectively, but performed with the mutant PlzARD-RD protein. All conditions were performed identically as with PlzAWT. Each panel is a representative gel from separate EMSAs which were performed in triplicate (PlzAWT) or duplicate (PlzARD-RD).CC BY-NC-ND · PubMed Central
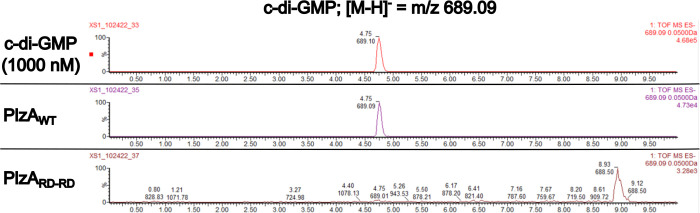
FIGURE 3 Detection of c-di-GMP in recombinant PlzAWT and PlzARD-RD by LC-MS/MS. Recombinant PlzAWT and PlzARD-RD were sent off for mass spectrometry to detect c-di-GMP. Extracted ion chromatograms of the LC-MS/MS analysis for detection of c-di-GMP are displayed. Chromatograms depict the control c-di-GMP standard at 1 μM, recombinant PlzAWT, and recombinant PlzARD-RD. The LC-MS/MS analysis reveals PlzAWT co-purified with c-di-GMP, but PlzARD-RD did not. The concentration of c-di-GMP in recombinant PlzAWT was determined from a standard curve of c-di-GMP. PlzAWT co-purified with 99.29 nM of c-di-GMP and approximately 0.3% of the protein was bound with c-di-GMP. Black lines indicate chromatograms unrelated to this figure that were removed.
FIGURE 3 Detection of c-di-GMP in recombinant PlzAWT and PlzARD-RD by LC-MS/MS. Recombinant PlzAWT and PlzARD-RD were sent off for mass spectrometry to detect c-di-GMP. Extracted ion chromatograms of the LC-MS/MS analysis for detection of c-di-GMP are displayed. Chromatograms depict the control c-di-GMP standard at 1 μM, recombinant PlzAWT, and recombinant PlzARD-RD. The LC-MS/MS analysis reveals PlzAWT co-purified with c-di-GMP, but PlzARD-RD did not. The concentration of c-di-GMP in recombinant PlzAWT was determined from a standard curve of c-di-GMP. PlzAWT co-purified with 99.29 nM of c-di-GMP and approximately 0.3% of the protein was bound with c-di-GMP. Black lines indicate chromatograms unrelated to this figure that were removed.CC BY-NC-ND · PubMed Central
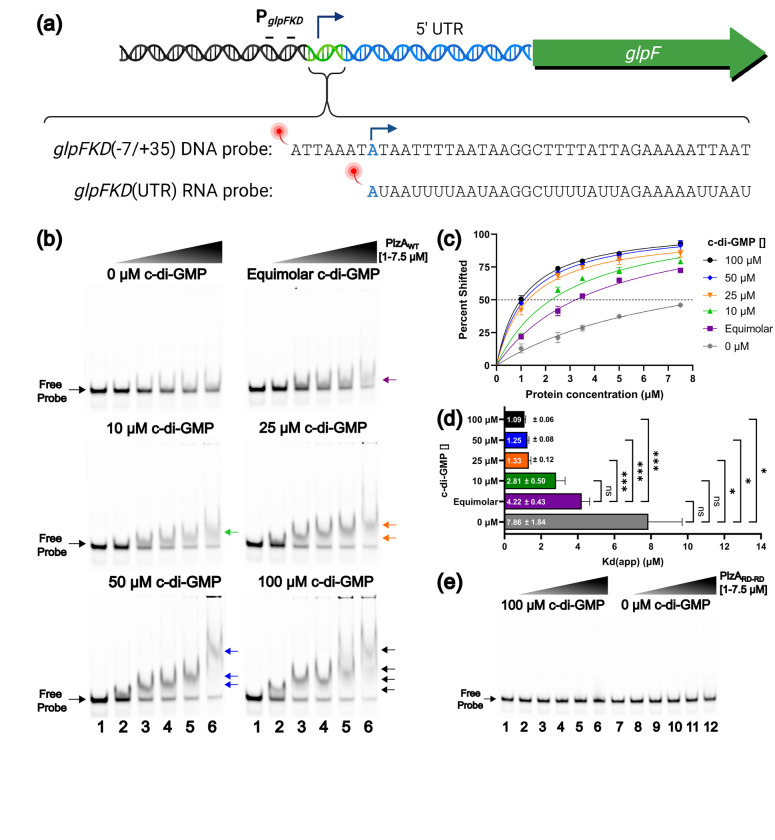
FIGURE 4 Levels of c-di-GMP alter DNA binding affinity of PlzAWT. (a) A diagram of the generated DNA probe, designated as glpFKD(−7/+35), corresponding to a 42 bp sequence adjacent to the −10 site and proceeding 35 bp into the 5’ UTR. An RNA probe was made corresponding to only nucleotides that are within the 5 ‘UTR which was designated as glpFKD(UTR) RNA. Probes were conjugated to a fluorescent molecule for the detection of binding in EMSAs. (b) EMSAs were performed with increasing protein concentrations of PlzAWT, and 10 nM fluorescently labeled probe at varying c-di-GMP concentrations (0, equimolar, 10, 25, 50, or 100 μM). For each EMSA shown, the indicated c-di-GMP concentration was held constant in all lanes. For each EMSA shown, lanes 1 and 7 are probe-only controls. Protein concentrations were as follows: Lane 2– 1 μM, Lane 3– 2.5 μM, Lane 4– 3.5 μM, Lane 5– 5 μM, Lane 6– 7.5 μM. A final concentration of 2.5 ng/μL of the nonspecific competitor poly-dI-dC was added to each lane. Arrows indicate higher-order complexes formed as protein concentration increases. A representative gel for each tested c-di-GMP concentration is shown from triplicate EMSAs. (c) Triplicate EMSAs were quantitated by densitometry to determine the Kd(app) of the PlzAWT-glpFKD(−7/35+) interaction by nonlinear regression analysis using the one-site specific binding setting in GraphPad Prism. Errors bars represent one standard deviation (SD). (d) Bar graph displaying the calculated Kd(app) ± the standard error of the mean (SEM). The Kd(app) values from three EMSAs were analyzed by a Welch ANOVA with Dunnett’s T3 multiple comparisons test via GraphPad Prism. Adjusted P-values are indicated as follows: ns= p >0.05, *= p ≤0.05, and ***= p ≤0.001. Comparisons between 10, 25, 50, and 100 μM c-di-GMP are not indicated on the graph as they were not significant. (e) A similar EMSA experiment was performed as in Figure 4B but with PlzARD-RD and either 100 (lanes 1–6) or 0 (lanes 7–12) μM of c-di-GMP supplemented. No binding is observed.
FIGURE 4 Levels of c-di-GMP alter DNA binding affinity of PlzAWT. (a) A diagram of the generated DNA probe, designated as glpFKD(−7/+35), corresponding to a 42 bp sequence adjacent to the −10 site and proceeding 35 bp into the 5’ UTR. An RNA probe was made corresponding to only nucleotides that are within the 5 ‘UTR which was designated as glpFKD(UTR) RNA. Probes were conjugated to a fluorescent molecule for the detection of binding in EMSAs. (b) EMSAs were performed with increasing protein concentrations of PlzAWT, and 10 nM fluorescently labeled probe at varying c-di-GMP concentrations (0, equimolar, 10, 25, 50, or 100 μM). For each EMSA shown, the indicated c-di-GMP concentration was held constant in all lanes. For each EMSA shown, lanes 1 and 7 are probe-only controls. Protein concentrations were as follows: Lane 2– 1 μM, Lane 3– 2.5 μM, Lane 4– 3.5 μM, Lane 5– 5 μM, Lane 6– 7.5 μM. A final concentration of 2.5 ng/μL of the nonspecific competitor poly-dI-dC was added to each lane. Arrows indicate higher-order complexes formed as protein concentration increases. A representative gel for each tested c-di-GMP concentration is shown from triplicate EMSAs. (c) Triplicate EMSAs were quantitated by densitometry to determine the Kd(app) of the PlzAWT-glpFKD(−7/35+) interaction by nonlinear regression analysis using the one-site specific binding setting in GraphPad Prism. Errors bars represent one standard deviation (SD). (d) Bar graph displaying the calculated Kd(app) ± the standard error of the mean (SEM). The Kd(app) values from three EMSAs were analyzed by a Welch ANOVA with Dunnett’s T3 multiple comparisons test via GraphPad Prism. Adjusted P-values are indicated as follows: ns= p >0.05, *= p ≤0.05, and ***= p ≤0.001. Comparisons between 10, 25, 50, and 100 μM c-di-GMP are not indicated on the graph as they were not significant. (e) A similar EMSA experiment was performed as in Figure 4B but with PlzARD-RD and either 100 (lanes 1–6) or 0 (lanes 7–12) μM of c-di-GMP supplemented. No binding is observed.CC BY-NC-ND · PubMed Central
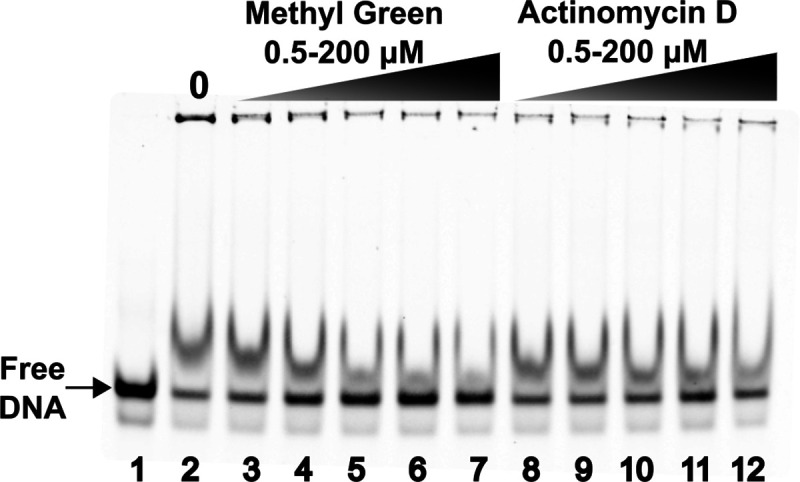
FIGURE 5 Major and Minor Groove Binding Assay. Competition EMSAs were performed with a constant PlzAWT concentration of 3.5 μM, 10 nM fluorescently labeled glpFKD(−7/35+) probe, and a constant c-di-GMP concentration of 100 μM. Lane 1 is the probe-only control, while lane 2 is the probe + protein only control. Lanes 3–7 contain increasing concentrations of methyl green: Lane 3– 0.5 μM, Lane 4– 5 μM, Lane 5– 50 μM, Lane 6– 3 100 μM, and Lane 7– 200 μM. Lanes 8–12 contain increasing concentrations of Actinomycin D: Lane 8– 0.5 μM, Lane 9– 5 μM, Lane 10– 50 μM, Lane 11– 100 μM and Lane 12– 200 μM. A representative gel is shown from three independently performed experiments.
FIGURE 5 Major and Minor Groove Binding Assay. Competition EMSAs were performed with a constant PlzAWT concentration of 3.5 μM, 10 nM fluorescently labeled glpFKD(−7/35+) probe, and a constant c-di-GMP concentration of 100 μM. Lane 1 is the probe-only control, while lane 2 is the probe + protein only control. Lanes 3–7 contain increasing concentrations of methyl green: Lane 3– 0.5 μM, Lane 4– 5 μM, Lane 5– 50 μM, Lane 6– 3 100 μM, and Lane 7– 200 μM. Lanes 8–12 contain increasing concentrations of Actinomycin D: Lane 8– 0.5 μM, Lane 9– 5 μM, Lane 10– 50 μM, Lane 11– 100 μM and Lane 12– 200 μM. A representative gel is shown from three independently performed experiments.CC BY-NC-ND · PubMed Central
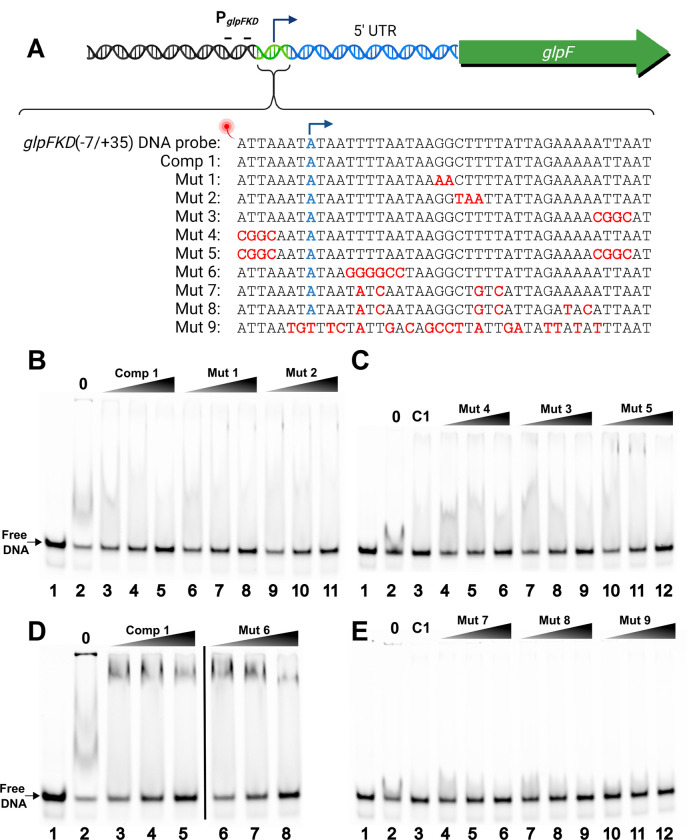
FIGURE 6 Competition EMSAs with mutagenized glpFKD(−7/35+) competitors. (a) A diagram of the generated unlabeled, mutagenized glpFKD(−7/+35) competitors. Comp 1 (C1) is the unlabeled, specific glpFKD(−7/+35) competitor. Introduced mutations are indicated in red for each mutant competitor. The transcriptional start site is the nucleotide labeled as blue. Competition EMSAs were performed with the various mutant competitors and the glpFKD(7/35+) probe. (b) PlzAWT, c-di-GMP, poly-dI-dC, and glpFKD(−7/35+) probe concentrations were held constant at 2.5 μM, 100 μM, 2.5 ng/μL, and 10 nM respectively. Lane 1 is the probe-only control, while lane 2 is the probe + protein only control. Lanes 3–5: 250, 500, & 1000x molar excess (relative to the probe) of comp 1 (unlabeled, glpFKD(−7/35+). Lanes 6–8: Lanes 3–5: 250, 500, & 1000x mut 1 competitor. Lanes 6–8: Lanes 9–11: 250, 500, & 1000x mut 2 competitor. (c) Concentrations for protein, effector, nonspecific competitor, and probe as in (a). Lane 1 is the probe-only control, while lane 2 is the probe + protein only control. Lane 3 is the specific competitor control with 1000x of comp 1. Lanes 4–6: 250, 500, & 1000x mut 4 competitor. Lanes 7–9: 250, 500, & 1000x mut 3 competitor. Lanes 10–12: 250, 500, & 1000x mut 5 competitor. (d) PlzAWT, c-di-GMP, poly-dI-dC, and glpFKD(−7/35+) probe concentrations were held constant at 3.5 μM, 100 μM, 2.5 ng/μL, and 10 nM respectively. Lane 1 is the probe-only control, while lane 2 is the probe + protein only control. Lanes 3–5: 250, 500, & 1000x molar excess (relative to the probe) of comp 1 (unlabeled, glpFKD(−7/35+). Lanes 6–8: Lanes 3–5: 250, 500, & 1000x mut 6 competitor. The black line denotes irrelevant lanes that were removed from the same gel. (e) PlzAWT, c-di-GMP, poly-dI-dC, and glpFKD(−7/35+) probe concentrations were held constant at 2.0 μM, 100 μM, 2.5 ng/μL, and 10 nM respectively. Lane 1 is the probe-only control, while lane 2 is the probe + protein only control. Lane 3 is the specific competitor control with 1000x of comp 1. Lanes 4–6: 250, 500, & 1000x mut 7 competitor. Lanes 7–9: 250, 500, & 1000x mut 8 competitor. Lanes 10–12: 250, 500, & 1000x mut 9 competitor.
FIGURE 6 Competition EMSAs with mutagenized glpFKD(−7/35+) competitors. (a) A diagram of the generated unlabeled, mutagenized glpFKD(−7/+35) competitors. Comp 1 (C1) is the unlabeled, specific glpFKD(−7/+35) competitor. Introduced mutations are indicated in red for each mutant competitor. The transcriptional start site is the nucleotide labeled as blue. Competition EMSAs were performed with the various mutant competitors and the glpFKD(7/35+) probe. (b) PlzAWT, c-di-GMP, poly-dI-dC, and glpFKD(−7/35+) probe concentrations were held constant at 2.5 μM, 100 μM, 2.5 ng/μL, and 10 nM respectively. Lane 1 is the probe-only control, while lane 2 is the probe + protein only control. Lanes 3–5: 250, 500, & 1000x molar excess (relative to the probe) of comp 1 (unlabeled, glpFKD(−7/35+). Lanes 6–8: Lanes 3–5: 250, 500, & 1000x mut 1 competitor. Lanes 6–8: Lanes 9–11: 250, 500, & 1000x mut 2 competitor. (c) Concentrations for protein, effector, nonspecific competitor, and probe as in (a). Lane 1 is the probe-only control, while lane 2 is the probe + protein only control. Lane 3 is the specific competitor control with 1000x of comp 1. Lanes 4–6: 250, 500, & 1000x mut 4 competitor. Lanes 7–9: 250, 500, & 1000x mut 3 competitor. Lanes 10–12: 250, 500, & 1000x mut 5 competitor. (d) PlzAWT, c-di-GMP, poly-dI-dC, and glpFKD(−7/35+) probe concentrations were held constant at 3.5 μM, 100 μM, 2.5 ng/μL, and 10 nM respectively. Lane 1 is the probe-only control, while lane 2 is the probe + protein only control. Lanes 3–5: 250, 500, & 1000x molar excess (relative to the probe) of comp 1 (unlabeled, glpFKD(−7/35+). Lanes 6–8: Lanes 3–5: 250, 500, & 1000x mut 6 competitor. The black line denotes irrelevant lanes that were removed from the same gel. (e) PlzAWT, c-di-GMP, poly-dI-dC, and glpFKD(−7/35+) probe concentrations were held constant at 2.0 μM, 100 μM, 2.5 ng/μL, and 10 nM respectively. Lane 1 is the probe-only control, while lane 2 is the probe + protein only control. Lane 3 is the specific competitor control with 1000x of comp 1. Lanes 4–6: 250, 500, & 1000x mut 7 competitor. Lanes 7–9: 250, 500, & 1000x mut 8 competitor. Lanes 10–12: 250, 500, & 1000x mut 9 competitor.CC BY-NC-ND · PubMed Central
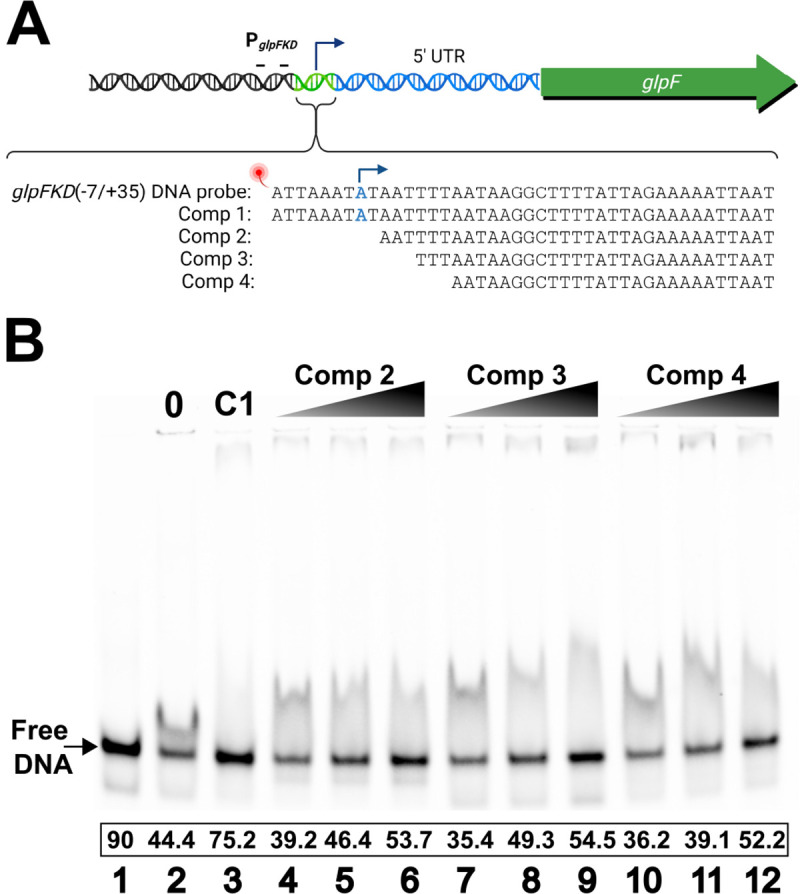
FIGURE 7 Competition EMSAs with truncated glpFKD(−7/35+) competitors. (a) A diagram of the generated unlabeled, truncated glpFKD(−7/+35) competitors. Comp 1 (C1) is the unlabeled, specific glpFKD(−7/+35) competitor. Competitors 2, 3, and 4 are unlabeled glpFKD(−7/+35) truncated at the 5’ end by either 9, 12, or 15 bases respectively. The transcriptional start site is the nucleotide labeled as blue. (b) PlzAWT, c-di-GMP, poly-dI-dC, and glpFKD(−7/35+) probe concentrations were held constant at 2.0 μM, 100 μM, 2.5 ng/μL, and 10 nM respectively. Lane 1 is the probe-only control, while lane 2 is the probe + protein only control. Lane 3 is the specific competitor control with 1000x of comp 1. Lanes 4–6: 250, 500, & 1000x comp 2 competitor. Lanes 7–9: 250, 500, & 1000x comp 3 competitor. Lanes 10–12: 250, 500, & 1000x comp 4 competitor. A representative gel is shown from two independently performed experiments.
FIGURE 7 Competition EMSAs with truncated glpFKD(−7/35+) competitors. (a) A diagram of the generated unlabeled, truncated glpFKD(−7/+35) competitors. Comp 1 (C1) is the unlabeled, specific glpFKD(−7/+35) competitor. Competitors 2, 3, and 4 are unlabeled glpFKD(−7/+35) truncated at the 5’ end by either 9, 12, or 15 bases respectively. The transcriptional start site is the nucleotide labeled as blue. (b) PlzAWT, c-di-GMP, poly-dI-dC, and glpFKD(−7/35+) probe concentrations were held constant at 2.0 μM, 100 μM, 2.5 ng/μL, and 10 nM respectively. Lane 1 is the probe-only control, while lane 2 is the probe + protein only control. Lane 3 is the specific competitor control with 1000x of comp 1. Lanes 4–6: 250, 500, & 1000x comp 2 competitor. Lanes 7–9: 250, 500, & 1000x comp 3 competitor. Lanes 10–12: 250, 500, & 1000x comp 4 competitor. A representative gel is shown from two independently performed experiments.CC BY-NC-ND · PubMed Central
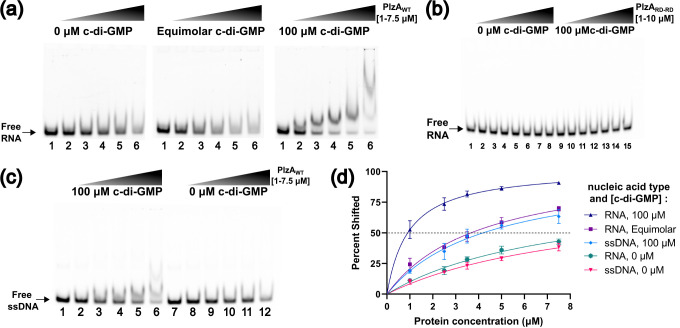
FIGURE 8 PlzAWT also binds single stranded RNA and DNA. (a) Gradient EMSAs were performed with increasing protein concentrations of PlzAWT without c-di-GMP (left panel), equimolar (middle panel), or 100 μM c-di-GMP (right panel) and 10 nM fluorescently labeled glpFKD(UTR) RNA probe. Lane 1 is the probe-only control in each EMSA. Lane protein concentrations were as follows: Lane 2– 1 μM, Lane 3– 2.5 μM, Lane 4– 3.5 μM, Lane 5– 5 μM, Lane 6– 7.5 μM. (b) A similar EMSA experiment was performed with PlzARD-RD with (lanes 1–8) or without (lanes 9–15) 100 μM c-di-GMP and 50 nM of glpFKD(UTR) RNA probe. Lane 1 is a probe-only control. Protein concentrations were as follows: Lanes 2 and 9– 1 μM, Lanes 3 and 10– 1.25 μM, Lanes 4 and 11– 2 μM, Lanes 5 and 12– 2.5 μM, Lanes 6 and 13– 3.3 μM, Lanes 7 and 14– 5 μM, Lanes 8 and 15– 10 μM. Riboguard was supplemented in the PlzARD-RD EMSA mixtures to a final concentration of 4 U/μL. (c) Gradient EMSAs were performed with increasing protein concentrations of PlzAWT with 100 μM c-di-GMP (left panel) or 0 μM c-di-GMP (right panel) with 10 nM fluorescently labeled ssglpF probe. Lanes 1 and 7 are the probe-only control in each EMSA. Lane protein concentrations were as follows: Lanes 2 and 8– 1 μM, Lanes 3 and 9– 2.5 μM, Lanes 4 and 10– 3.5 μM, Lanes 5 and 11– 5 μM, Lanes 6 and 12– 7.5 μM. Representative gels are shown from triplicate (PlzAWT) or duplicate (PlzARD-RD) EMSA experiments. (d) Triplicate EMSAs from (a) and (c) were quantitated by densitometry to determine the Kd(app) of PlzAWT for the glpFKD RNA or ssDNA interactions by nonlinear regression analysis using the one-site specific binding setting in GraphPad Prism. Errors bars represent one standard deviation (SD).
FIGURE 8 PlzAWT also binds single stranded RNA and DNA. (a) Gradient EMSAs were performed with increasing protein concentrations of PlzAWT without c-di-GMP (left panel), equimolar (middle panel), or 100 μM c-di-GMP (right panel) and 10 nM fluorescently labeled glpFKD(UTR) RNA probe. Lane 1 is the probe-only control in each EMSA. Lane protein concentrations were as follows: Lane 2– 1 μM, Lane 3– 2.5 μM, Lane 4– 3.5 μM, Lane 5– 5 μM, Lane 6– 7.5 μM. (b) A similar EMSA experiment was performed with PlzARD-RD with (lanes 1–8) or without (lanes 9–15) 100 μM c-di-GMP and 50 nM of glpFKD(UTR) RNA probe. Lane 1 is a probe-only control. Protein concentrations were as follows: Lanes 2 and 9– 1 μM, Lanes 3 and 10– 1.25 μM, Lanes 4 and 11– 2 μM, Lanes 5 and 12– 2.5 μM, Lanes 6 and 13– 3.3 μM, Lanes 7 and 14– 5 μM, Lanes 8 and 15– 10 μM. Riboguard was supplemented in the PlzARD-RD EMSA mixtures to a final concentration of 4 U/μL. (c) Gradient EMSAs were performed with increasing protein concentrations of PlzAWT with 100 μM c-di-GMP (left panel) or 0 μM c-di-GMP (right panel) with 10 nM fluorescently labeled ssglpF probe. Lanes 1 and 7 are the probe-only control in each EMSA. Lane protein concentrations were as follows: Lanes 2 and 8– 1 μM, Lanes 3 and 9– 2.5 μM, Lanes 4 and 10– 3.5 μM, Lanes 5 and 11– 5 μM, Lanes 6 and 12– 7.5 μM. Representative gels are shown from triplicate (PlzAWT) or duplicate (PlzARD-RD) EMSA experiments. (d) Triplicate EMSAs from (a) and (c) were quantitated by densitometry to determine the Kd(app) of PlzAWT for the glpFKD RNA or ssDNA interactions by nonlinear regression analysis using the one-site specific binding setting in GraphPad Prism. Errors bars represent one standard deviation (SD).CC BY-NC-ND · PubMed Central
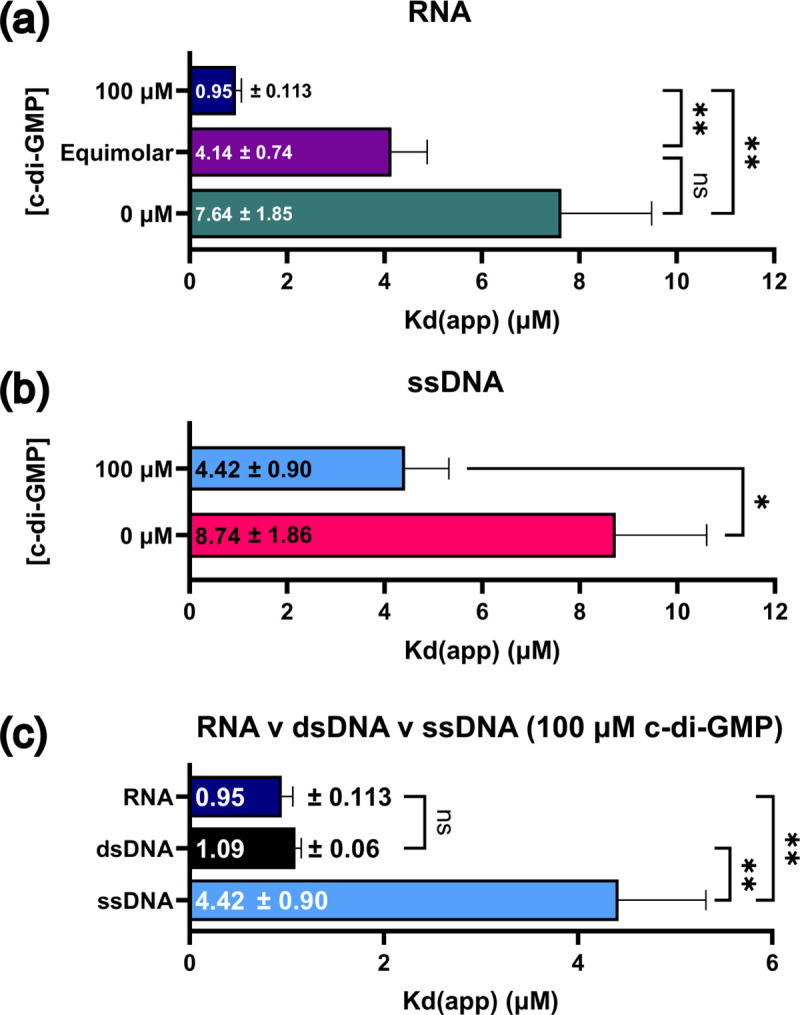
FIGURE 9 c-di-GMP significantly impacts PlzA-nucleic acid binding and PlzA prefers dsDNA and RNA over ssDNA. (a) The Kd(app) values from triplicate RNA EMSAs at each tested c-di-GMP concentration in Figure 5A were analyzed by a Welch ANOVA with Dunnett’s T3 multiple comparisons test. (b) The Kd(app) values from triplicate ssDNA EMSAs at the tested c-di-GMP concentrations in Figure 5C were analyzed by a Welch’s t-test. (c) The Kd(app) values from EMSAs with PlzA and each tested nucleic acid at 100 μM c-di-GMP were compared via a Welch ANOVA with Dunnett’s T3 multiple comparisons test. Bar graphs display the calculated Kd(app)s ± the standard error of the mean (SEM). Adjusted P-values are indicated as follows: ns= p >0.05, *= p ≤0.05, and **= p ≤0.01.
FIGURE 9 c-di-GMP significantly impacts PlzA-nucleic acid binding and PlzA prefers dsDNA and RNA over ssDNA. (a) The Kd(app) values from triplicate RNA EMSAs at each tested c-di-GMP concentration in Figure 5A were analyzed by a Welch ANOVA with Dunnett’s T3 multiple comparisons test. (b) The Kd(app) values from triplicate ssDNA EMSAs at the tested c-di-GMP concentrations in Figure 5C were analyzed by a Welch’s t-test. (c) The Kd(app) values from EMSAs with PlzA and each tested nucleic acid at 100 μM c-di-GMP were compared via a Welch ANOVA with Dunnett’s T3 multiple comparisons test. Bar graphs display the calculated Kd(app)s ± the standard error of the mean (SEM). Adjusted P-values are indicated as follows: ns= p >0.05, *= p ≤0.05, and **= p ≤0.01.CC BY-NC-ND · PubMed Central
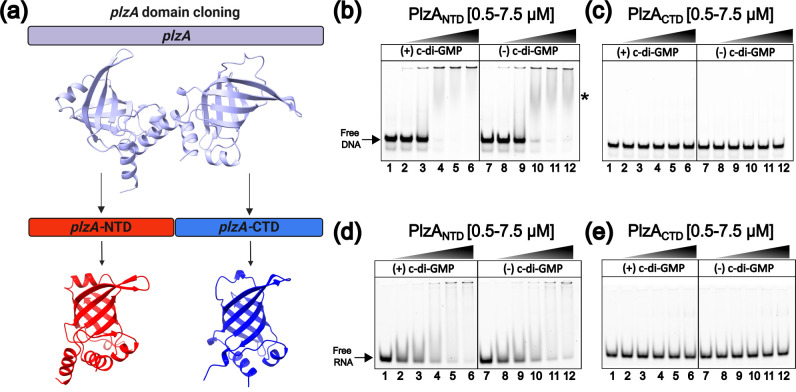
FIGURE 10 The N-terminal domain of PlzA is the nucleic acid binding domain. (a) The cloning strategy used to produce recombinant N (PlzANTD) and C (PlzACTD) terminal PlzA domains. The plzA gene portions corresponding to the N-terminus, plzA-NTD, and the C-terminus, plzA-CTD, were generated and cloned into an expression vector to produce recombinant PlzANTD and PlzACTD proteins. Gradient EMSAs were performed with increasing protein concentrations of PlzANTD (b, d) or PlzACTD (c, e) with (lanes 1–6) or without (lanes 7–12) 100 μM c-di-GMP and 10 nM fluorescently labeled glpFKD(−7/35+) dsDNA (b, c) or glpFKD(UTR) RNA (d, e) probe. Lanes 1 and 7 are probe-only controls. Protein concentrations were as follows: Lanes 2 and 8– 0.5 μM, Lanes 3 and 9– 1 μM, Lanes 4 and 10– 2.5 μM, Lanes 5 and 11– 5 μM, Lanes 6 and 12– 7.5 μM. SUPERase•In RNase inhibitor was supplemented to a final concentration of 2 U/μL in RNA EMSA mixtures. The asterisk indicates PlzANTD-dsDNA shifts. Representative gels are shown from triplicate (PlzANTD) or duplicate (PlzACTD) EMSAs. N= 2 or 3 independent experiments.
FIGURE 10 The N-terminal domain of PlzA is the nucleic acid binding domain. (a) The cloning strategy used to produce recombinant N (PlzANTD) and C (PlzACTD) terminal PlzA domains. The plzA gene portions corresponding to the N-terminus, plzA-NTD, and the C-terminus, plzA-CTD, were generated and cloned into an expression vector to produce recombinant PlzANTD and PlzACTD proteins. Gradient EMSAs were performed with increasing protein concentrations of PlzANTD (b, d) or PlzACTD (c, e) with (lanes 1–6) or without (lanes 7–12) 100 μM c-di-GMP and 10 nM fluorescently labeled glpFKD(−7/35+) dsDNA (b, c) or glpFKD(UTR) RNA (d, e) probe. Lanes 1 and 7 are probe-only controls. Protein concentrations were as follows: Lanes 2 and 8– 0.5 μM, Lanes 3 and 9– 1 μM, Lanes 4 and 10– 2.5 μM, Lanes 5 and 11– 5 μM, Lanes 6 and 12– 7.5 μM. SUPERase•In RNase inhibitor was supplemented to a final concentration of 2 U/μL in RNA EMSA mixtures. The asterisk indicates PlzANTD-dsDNA shifts. Representative gels are shown from triplicate (PlzANTD) or duplicate (PlzACTD) EMSAs. N= 2 or 3 independent experiments.CC BY-NC-ND · PubMed Central
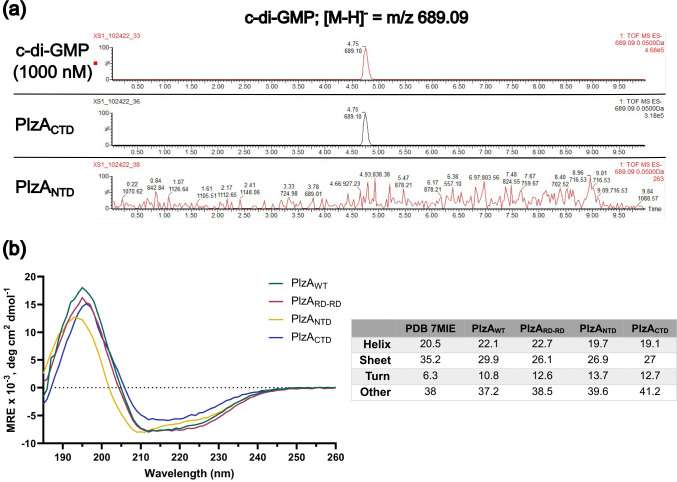
FIGURE 11 Detection of c-di-GMP in recombinant PlzANTD and PlzACTD by LC-MS/MS and circular dichroism of proteins. (a) Recombinant PlzANTD and PlzACTD were sent off for mass spectrometry to detect the presence of c-di-GMP. Extracted ion chromatograms of the LC-MS/MS analysis are displayed. Chromatograms depict the control c-di-GMP standard at 1 μM, recombinant PlzACTD, and recombinant PlzANTD. The LC-MS/MS analysis revealed that PlzACTD co-purified with c-di-GMP, but PlzANTD did not. The concentration of c-di-GMP in recombinant PlzACTD was determined from a standard curve of c-di-GMP. PlzACTD co-purified with 704.29 nM of c-di-GMP and approximately 1.1 % of the protein was bound with c-di-GMP. The c-di-GMP standard chromatogram shown is the same as in Figure 3. (b) Circular dichroism spectra of recombinant PlzAWT, PlzARD-RD, PlzANTD, and PlzACTD (see methods), and a summary table of the secondary structure analysis via BeStSel of recombinant proteins versus the PlzA PDB file 7MIE. CD spectra were derived from averaging the CD results from two different recombinant protein preparations for each protein tested. A buffer only control was performed and subtracted from the averaged measured recombinant protein CD spectra.
FIGURE 11 Detection of c-di-GMP in recombinant PlzANTD and PlzACTD by LC-MS/MS and circular dichroism of proteins. (a) Recombinant PlzANTD and PlzACTD were sent off for mass spectrometry to detect the presence of c-di-GMP. Extracted ion chromatograms of the LC-MS/MS analysis are displayed. Chromatograms depict the control c-di-GMP standard at 1 μM, recombinant PlzACTD, and recombinant PlzANTD. The LC-MS/MS analysis revealed that PlzACTD co-purified with c-di-GMP, but PlzANTD did not. The concentration of c-di-GMP in recombinant PlzACTD was determined from a standard curve of c-di-GMP. PlzACTD co-purified with 704.29 nM of c-di-GMP and approximately 1.1 % of the protein was bound with c-di-GMP. The c-di-GMP standard chromatogram shown is the same as in Figure 3. (b) Circular dichroism spectra of recombinant PlzAWT, PlzARD-RD, PlzANTD, and PlzACTD (see methods), and a summary table of the secondary structure analysis via BeStSel of recombinant proteins versus the PlzA PDB file 7MIE. CD spectra were derived from averaging the CD results from two different recombinant protein preparations for each protein tested. A buffer only control was performed and subtracted from the averaged measured recombinant protein CD spectra.CC BY-NC-ND · PubMed Central
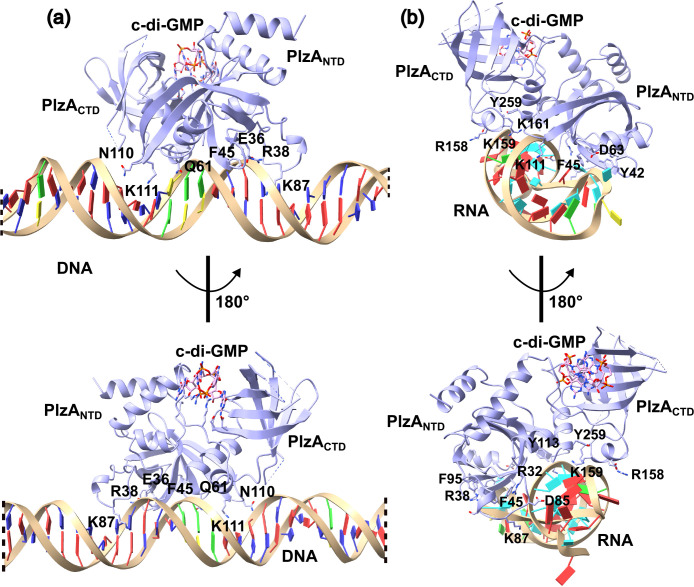
FIGURE 12 Computational docking analysis of PlzA with glp DNA and RNA. Computational docking was performed using the HDOCK server with PlzA and either (a) the 42 bp glpFKD(−7/+35) dsDNA or (b) the glpFKD(UTR) RNA sequence. In (a) only 26 of 42 bp of the glpFKD(−7/+35) sequence is shown. The dashed lines represent where bases were left out of the figure to zoom in on the protein-DNA interactions. The dsDNA model was linear, and removal of the bases has no impact on the interpretation of the data. The top predicted model from each computation is shown. The HDOCK docking and confidence scores for each model were −210.60 and 0.77 for PlzA-glp DNA, and −280.71 and 0.93 for PlzA-glp RNA, respectively. The protein is rotated 180° from the top to the bottom panels. Select amino acid residues that interface the nucleic acids are labeled.
FIGURE 12 Computational docking analysis of PlzA with glp DNA and RNA. Computational docking was performed using the HDOCK server with PlzA and either (a) the 42 bp glpFKD(−7/+35) dsDNA or (b) the glpFKD(UTR) RNA sequence. In (a) only 26 of 42 bp of the glpFKD(−7/+35) sequence is shown. The dashed lines represent where bases were left out of the figure to zoom in on the protein-DNA interactions. The dsDNA model was linear, and removal of the bases has no impact on the interpretation of the data. The top predicted model from each computation is shown. The HDOCK docking and confidence scores for each model were −210.60 and 0.77 for PlzA-glp DNA, and −280.71 and 0.93 for PlzA-glp RNA, respectively. The protein is rotated 180° from the top to the bottom panels. Select amino acid residues that interface the nucleic acids are labeled.CC BY-NC-ND · PubMed Central
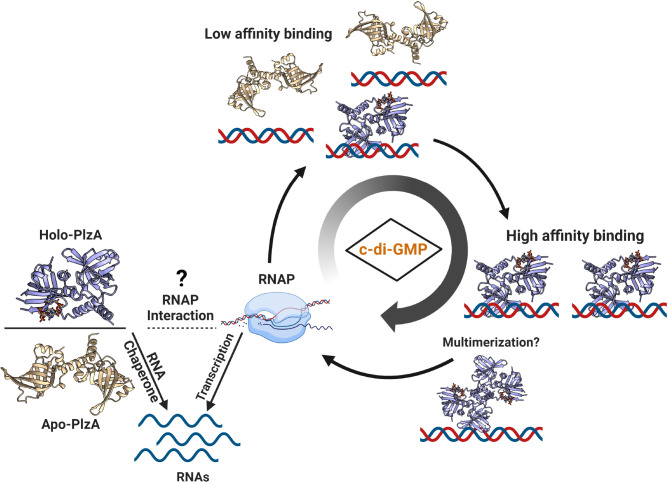
FIGURE 13 Model depicting the modulation of PlzA function by levels of c-di-GMP. Apo and holo-PlzA are hypothesized to have distinct functions in the vertebrate and tick hosts respectively. Recent studies identified PlzA RNA chaperone activity that is c-di-GMP independent (Van Gundy et al., 2023). In environments with no c-di-GMP, such as the vertebrate host, apo-PlzA engages in RNA chaperone activity to modulate gene expression required for survival in the vertebrate host. The phosphodiesterases PdeA and PdeB are likely to be highly active upon transmission and into vertebrate infection, lowering c-di-GMP levels and facilitating apo-PlzA functions (Sultan et al., 2010; Pitzer et al., 2011; Sultan et al., 2011; Novak et al., 2014; Groshong et al., 2021). Phosphodiesterase activity is likely to occur at all stages to regulate c-di-GMP levels and indirectly, PlzA function. When Hk1 is activated (signal unknown), Rrp1 is phosphorylated and produces c-di-GMP. Holo-PlzA can also engage in RNA chaperone activity by annealing RNAs, and potentially interact with RNAP (Grassmann et al., 2023; Van Gundy et al., 2023). We propose that levels of c-di-GMP impact the specific genes regulated by PlzA through altering nucleic acid binding affinity. At lower c-di-GMP levels, few holo-PlzA monomers exist resulting in weak PlzA binding affinity for certain target loci. As levels of c-di-GMP increase, more holo-PlzA molecules bind target genes with higher affinity, and PlzA could potentially multimerize on DNA.
FIGURE 13 Model depicting the modulation of PlzA function by levels of c-di-GMP. Apo and holo-PlzA are hypothesized to have distinct functions in the vertebrate and tick hosts respectively. Recent studies identified PlzA RNA chaperone activity that is c-di-GMP independent (Van Gundy et al., 2023). In environments with no c-di-GMP, such as the vertebrate host, apo-PlzA engages in RNA chaperone activity to modulate gene expression required for survival in the vertebrate host. The phosphodiesterases PdeA and PdeB are likely to be highly active upon transmission and into vertebrate infection, lowering c-di-GMP levels and facilitating apo-PlzA functions (Sultan et al., 2010; Pitzer et al., 2011; Sultan et al., 2011; Novak et al., 2014; Groshong et al., 2021). Phosphodiesterase activity is likely to occur at all stages to regulate c-di-GMP levels and indirectly, PlzA function. When Hk1 is activated (signal unknown), Rrp1 is phosphorylated and produces c-di-GMP. Holo-PlzA can also engage in RNA chaperone activity by annealing RNAs, and potentially interact with RNAP (Grassmann et al., 2023; Van Gundy et al., 2023). We propose that levels of c-di-GMP impact the specific genes regulated by PlzA through altering nucleic acid binding affinity. At lower c-di-GMP levels, few holo-PlzA monomers exist resulting in weak PlzA binding affinity for certain target loci. As levels of c-di-GMP increase, more holo-PlzA molecules bind target genes with higher affinity, and PlzA could potentially multimerize on DNA.CC BY-NC-ND · PubMed Central

Verification

Claims the paper makes

The claims and statistics of this paper haven’t been checked yet.

Run the check — free, no account needed. It reads the open-access text and checks the sources it cites.

A few free checks a day · papers already verified open instantly · results are public

Self-check

Percentages, sums and reported differences re-computed from the paper’s own numbers.

The self-check needs the paper’s full text.

Citations

Cites

Research works printed but not linked: 85

  1. 10.1093/nar/gkw1180 · DOI
  2. 10.1093/bioinformatics/bti739 · DOI
  3. 10.1128/JB.00005-06 · DOI
  4. 10.1093/nar/gkp502 · DOI
  5. 10.1016/j.jsb.2015.08.013 · DOI
  6. Bong, H.J. , Ko, E.M. , Song, S.Y. , Ko, I.J. , and Oh, J. II (2019) Tripartite regulation of the glpFKD operon involved in glycerol catabolism by gylr, crp, and sigf in Mycobacterium smegmatis . J Bacteriol 201. · DOI
  7. 10.1093/nar/gkq284 · DOI
  8. 10.1128/IAI.00315-15 · DOI
  9. 10.1128/IAI.05136-11 · DOI
  10. 10.3390/ijms23116274 · DOI
  11. 10.1046/j.1365-2958.2000.01698.x · DOI
  12. 10.1042/BST20180543 · DOI
  13. 10.1128/JB.00333-15 · DOI
  14. Corona, A. , and Schwartz, I . (2015) Borrelia burgdorferi : Carbon Metabolism and the Tick-Mammal Enzootic Cycle. Microbiol Spectr 3. · DOI
  15. 10.1038/37551 · DOI · Paper page
  16. 2009, Identification and molecular characterization of a cyclic-di-GMP effector protein, PlzA (BB0733): Additional evidence for the existence of a functional cyclic-di-GMP regulatory network in the Lyme disease spirochete, Borrelia burgdorferi, FEMS Immunol Med Microbiol, 58, 285
  17. 1981, Equilibria and kinetics of lac repressor-operator interactions by polyacrylamide gel electrophoresis, Nucleic Acids Res, 9, 1981
  18. 10.1002/elps.1150100515 · DOI
  19. Galperin, M.Y. , and Chou, S.H . (2020) Structural conservation and diversity of PilZ-related domains. J Bacteriol 202. · DOI
  20. 10.1111/j.1574-6968.2001.tb10814.x · DOI · Paper page
  21. 10.1002/pro.3235 · DOI · Paper page
  22. Grassmann, A.A. , Tokarz, R. , Golino, C. , McLain, M.A. , Groshong, A.M. , Radolf, J.D. , and Caimano, M.J . (2023) BosR and PlzA reciprocally regulate RpoS function to sustain Borrelia burgdorferi in ticks and mammals. Journal of Clinical Investigation http://www.jci.org/articles/view/166710. · DOI
  23. 10.1371/journal.ppat.1009501 · DOI
  24. Grove, A.P. , Liveris, D. , Iyer, R. , Petzke, M. , Rudman, J. , Caimano, M.J. , et al. (2017) Two Distinct Mechanisms govern RpoS-Mediated Repression of Tick-Phase Genes during Mammalian Host Adaptation by Borrelia burgdorferi, the Lyme Disease Spirochete. mBio 8 https://journals.asm.org/doi/full/10.1128/mBio.01204-17. Accessed June 18, 2022. · DOI
  25. He, M. , Ouyang, Z. , Troxell, B. , Xu, H. , Moh, A. , Piesman, J. , et al. (2011) Cyclic di-gmp is essential for the survival of the lyme disease spirochete in ticks. PLoS Pathog 7. · DOI
  26. 10.1128/IAI.01238-13 · DOI
  27. Helble, J.D. , McCarthy, J.E. , and Hu, L.T . (2021) Interactions between Borrelia burgdorferi and its hosts across the enzootic cycle. Parasite Immunol 43. · DOI
  28. 10.1038/nprot.2007.249 · DOI
  29. 10.1038/nrmicro2109 · DOI · Paper page
  30. 10.1093/nar/gky606 · DOI
  31. Huang, S.Y. , and Zou, X . (2014) A knowledge-based scoring function for protein-RNA interactions derived from a statistical mechanics-based iterative method. Nucleic Acids Res 42. · DOI
  32. 10.1038/nrmicro.2016.190 · DOI · Paper page
  33. Junkermeier, E.H. , and Hengge, R . (2023) Local signaling enhances output specificity of bacterial c-di-GMP signaling networks. microLife 4. · DOI
  34. 10.1128/JB.00252-12 · DOI
  35. 10.1074/jbc.M113.491357 · DOI
  36. 2013, Eubacterial SpoVG Homologs Constitute a New Family of Site-Specific DNA-Binding Proteins, PLoS One, 8, 66683, 10.1371/journal.pone.0066683 · DOI
  37. 10.1126/science.1553548 · DOI
  38. 10.1016/0014-5793(93)81133-K · DOI
  39. 10.1073/pnas.96.21.11735 · DOI
  40. 10.1111/j.1365-2958.2011.07687.x · DOI
  41. 2018, The Borrelia burgdorferi c-di-GMP Binding Receptors, PlzA and PlzB, Are Functionally Distinct, Front Cell Infect Microbiol, 8, 213, 10.3389/fcimb.2018.00213 · DOI
  42. 10.1128/jb.00396-22 · DOI
  43. 1996, Optimization of competitor poly(dI-dC).poly(dI-dC) levels is advised in DNA-protein interaction studies involving enriched nuclear proteins, Biotechniques, 20, 439, 10.2144/19962003439 · DOI
  44. 10.1086/physzool.60.4.30157912 · DOI
  45. 10.1111/mmi.13383 · DOI
  46. 2016, Cyclic-di-GMP binding induces structural rearrangements in the PlzA and PlzC proteins of the Lyme disease and relapsing fever spirochetes: A possible switch mechanism for c-di-GMP-mediated effector functions, Pathog Dis, 74, 1
  47. 10.1093/nar/gkac345 · DOI · Paper page
  48. 10.1093/nar/gky497 · DOI
  49. 10.1073/pnas.1500851112 · DOI
  50. Novak, E.A. , Sultan, S.Z. , and Motaleb, M.A. (2014) The cyclic-di-GMP signaling pathway in the Lyme disease spirochete, Borrelia burgdorferi . Front Cell Infect Microbiol 4 www.frontiersin.org. Accessed April 26, 2021. · DOI
  51. Pappas, C.J. , Iyer, R. , Petzke, M.M. , Caimano, M.J. , Radolf, J.D. , and Schwartz, I . (2011) Borrelia burgdorferi requires glycerol for maximum fitness during the tick phase of the enzootic cycle. PLoS Pathog 7. · DOI
  52. 10.1002/PRO.3943 · DOI · Paper page
  53. 10.1128/IAI.00075-11 · DOI
  54. 10.1371/journal.pone.0162755 · DOI · Paper page
  55. 10.1111/mmi.12066 · DOI
  56. 10.1093/nar/gkp027 · DOI
  57. 10.1111/j.1365-2958.2009.06621.x · DOI
  58. 10.1128/MMBR.00043-12 · DOI
  59. 10.1016/S0022-2836(02)00263-2 · DOI
  60. 10.1074/jbc.C600179200 · DOI
  61. 10.1128/JB.187.5.1792-1798.2005 · DOI · Paper page
  62. Sarenko, O. , Klauck, G. , Wilke, F.M. , Pfiffer, V. , Richter, A.M. , Herbst, S. , et al. (2017) More than enzymes that make or break cyclic Di-GMP—local signaling in the interactome of GGDEF/EAL domain proteins of Escherichia coli. mBio 8. · DOI
  63. 10.1093/nar/gkh733 · DOI
  64. Savage, C.R. , Jutras, B.L. , Bestor, A. , Tilly, K. , Rosa, P.A. , Tourand, Y. , et al. (2018) Borrelia burgdorferi SpoVG DNA- and RNA-binding protein modulates the physiology of the Lyme disease spirochete. J Bacteriol 200 http://jb.asm.org/. Accessed April 26, 2021. · DOI
  65. 2023, Quantitative analyses of interactions between SpoVG and RNA/DNA, Biochem Biophys Res Commun, 654, 40, 10.1016/j.bbrc.2023.02.044 · DOI
  66. 10.1073/pnas.1702435114 · DOI
  67. 2019, Protein aggregation in bacteria, FEMS Microbiol Rev, 44, 54
  68. 2022, The convergent xenogeneic silencer MucR predisposes α-proteobacteria to integrate AT-rich symbiosis genes, Nucleic Acids Res, 50, 8580, 10.1093/nar/gkac664 · DOI
  69. 2021, High-resolution crystal structure of the Borreliella burgdorferi PlzA protein in complex with c-di-GMP: new insights into the interaction of c-di-GMP with the novel xPilZ domain, Pathog Dis, 79, 1
  70. 10.1038/s41467-020-15628-8 · DOI
  71. 10.1128/IAI.05153-11 · DOI
  72. 10.1111/j.1365-2958.2010.07191.x · DOI
  73. 10.1128/JB.02615-14 · DOI
  74. 10.1016/j.cell.2014.07.022 · DOI
  75. 10.1146/annurev-micro-020518-115555 · DOI
  76. 2023, c-di-GMP regulates activity of the PlzA RNA chaperone from the Lyme disease spirochete, Mol Microbiol, 119, 711, 10.1111/mmi.15066 · DOI
  77. 10.1007/s13238-016-0317-y · DOI
  78. 10.1371/journal.ppat.1002204 · DOI · Paper page
  79. 10.1038/S41596-020-0312-X · DOI
  80. 2017, Addressing recent docking challenges: A hybrid strategy to integrate template-based and free protein-protein docking. Proteins: Structure, Function and Bioinformatics, 85, 497, 10.1002/prot.25234 · DOI
  81. 10.1093/nar/gkx407 · DOI
  82. Yang, J. , Wilksch, J.J. , Tan, J.W.H. , Hocking, D.M. , Webb, C.T. , Lithgow, T. , et al. (2013) Transcriptional activation of the mrkA promoter of the Klebsiella pneumoniae type 3 fimbrial operon by the c-di-GMP-dependent MrkH protein. PLoS One 8. · DOI
  83. 10.1128/JB.02439-14 · DOI
  84. 10.1128/JB · DOI
  85. Zhang, J.-J. , Raghunandanan, S. , Wang, Q. , Priya, R. , Alanazi, F. , Lou, Y. , and Yang, X.F. (2024) BadR directly represses the expression of the glycerol utilization operon in the Lyme disease pathogen. J Bacteriol https://journals.asm.org/doi/10.1128/jb.00340-23. · DOI

Metadata

Authors
Jusufovic, N., Krusenstjerna, A. C., Savage, C. R., Saylor, T. C., Brissette, C. A., Zückert, W. R., Schlax, P. J., Motaleb, M. A., & Stevenson, B.
Affiliations
  • University of Kentucky (US)
  • University of North Dakota (US)
  • University of Kansas (US)
  • Bates College (US)
  • East Carolina University (US)
Corresponding author
Stevenson, Brian
Venue
Molecular Microbiology
Publisher
openRxiv
Published
2023-01-31
Volume
121
Issue
5
Pages
1039-1062
ISSN
0950-382X (ISSN-L)
OpenAlex
W4394758680
Cited by
7
References
1
Citations by year
2025: 2 · 2024: 1 · 2023: 4
FWCI
0.79
Type
journal article
Language
en
Open access
Licence
cc-by-nc
Locations
  • Molecular Microbiology (publishedVersion, cc-by-nc)
  • bioRxiv (Cold Spring Harbor Laboratory) (acceptedVersion, cc-by-nc-nd)
  • PubMed (publishedVersion)
  • PubMed Central (submittedVersion, cc-by-nc-nd)
  • SCARAB (Bates College) (submittedVersion, cc-by-nc)
  • UKnowledge (University of Kentucky) (submittedVersion, cc-by-nc)
Funders
  • Michigan State University
  • National Institutes of Health
  • College of Engineering, Michigan State University
  • National Institute of Allergy and Infectious Diseases (R01AI144126)
Topics
  • Life Sciences › Biochemistry, Genetics and Molecular Biology › Genetics › Bacterial Genetics and Biotechnology
  • Life Sciences › Immunology and Microbiology › Parasitology › Vector-borne infectious diseases
  • Life Sciences › Biochemistry, Genetics and Molecular Biology › Molecular Biology › Biochemical and Structural Characterization
Keywords
Borrelia burgdorferi, PilZ domain, c-di-GMP, nucleic acid binding, DNA binding, RNA binding, major groove, GC content, protein-DNA interactions, protein structure stabilization, gene expression regulation

About these checks

Registry, retraction, Cites and statistics results are computed, not judged, with one exception: a printed reference that no index lists is read once by a model before it counts as a citation error. Claims are extracted by a model and kept only when their quote appears verbatim in the text; each cited source is then checked, with a model’s help, for whether it says what the claim relies on. Those verdicts can be wrong — read the claim’s quote and the cited source before relying on one.

Statistics and arithmetic are recomputed, not judged.

Confidence bands are shown only for fields calibrated on our annotated test set. None is calibrated yet, so no band is shown.

What counts as a claim ›How we measure confidence ›How we check this ›

Are you an author, or do you see a problem with this page? Request a review

Data sources

Bibliographic data: Semantic Scholar, OpenAlex, Crossref.

Contains information from the Semantic Scholar Academic Graph Datasets, made available under the ODC Attribution License (ODC-BY 1.0).

Semantic Scholar’s data is described in: Kinney, R., et al. (2023). The Semantic Scholar Open Data Platform. arXiv:2301.10140.