PreprintCited by 37Protein Structure and DynamicsEnzyme Structure and FunctionRNA and protein synthesis mechanisms

The DOI matches its Crossref record; 1 of the 1 references it cites were found in a registry or an index.

SSDraw: software for generating comparative protein secondary structure diagrams

Open access
Chen, Ethan A., Porter, Lauren L.·2023·Protein Science

Preprint — published as 10.1002/pro.4836

Abstract

The program SSDraw generates publication-quality protein secondary structure diagrams from three-dimensional protein structures. To depict relationships between secondary structure and other protein features, diagrams can be colored by conservation score, B-factor, or custom scoring. Diagrams of homologous proteins can be registered according to an input multiple sequence alignment. Linear visualization allows the user to stack registered diagrams, facilitating comparison of secondary structure and other properties among homologous proteins. SSDraw can be used to compare secondary structures of homologous proteins with both conserved and divergent folds. It can also generate one secondary structure diagram from an input protein structure of interest. The source code can be downloaded ( https://github.com/ethanchen1301/SSDraw ) and run locally for rapid structure generation, while a Google Colab notebook allows easy use.

Overview

The claims and statistics of this paper haven’t been checked yet.

Run the check — free, no account needed. It reads the open-access text and checks the sources it cites.

A few free checks a day · papers already verified open instantly · results are public

Integrity signals

Registry

Crossref · 10.1101/2023.08.25.554905

Cites

1 of 1 references verified0 citation errors · 0 not checkable

Statistics

Figures

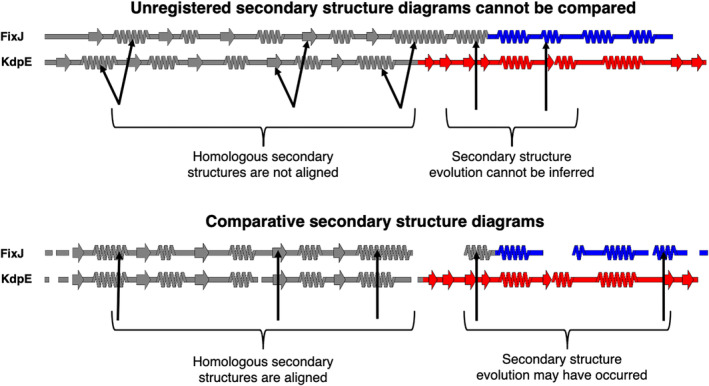
FIGURE 1 Comparative secondary structure diagrams result from registering secondary structure annotations with their corresponding aligned amino acid sequences. Secondary structures of unregistered diagrams (above) are not aligned, disallowing reliable inferences about secondary structure evolution. Diagrams align when their secondary structures have been registered with their corresponding aligned amino acid sequences (comparative secondary structure diagrams, below), suggesting possible secondary structure evolution where α‐helices align with β‐sheets. Secondary structure diagrams were made from structures of bacterial response regulators FixJ (PDB ID: 5XSO, chain A) and KdpE (PDB ID: 4KFC, chain A). The C‐terminal domains of FixJ and KdpE are colored blue and red, respectively, indicating different folds (helix‐turn‐helix, blue; winged helix, red), while their structurally conserved N‐terminal domains are gray. Arrows pointing to the gray domains indicate homologous secondary structures; arrows pointing to the colored domains indicate divergent secondary structures. Previous phylogenetic analysis and ancestral reconstruction (Chakravarty, Sreenivasan, et al., 2023) indicate that the C‐terminal β‐sheet of the winged helix evolved from the C‐terminal α‐helix of the helix‐turn‐helix by stepwise mutation.
FIGURE 1 Comparative secondary structure diagrams result from registering secondary structure annotations with their corresponding aligned amino acid sequences. Secondary structures of unregistered diagrams (above) are not aligned, disallowing reliable inferences about secondary structure evolution. Diagrams align when their secondary structures have been registered with their corresponding aligned amino acid sequences (comparative secondary structure diagrams, below), suggesting possible secondary structure evolution where α‐helices align with β‐sheets. Secondary structure diagrams were made from structures of bacterial response regulators FixJ (PDB ID: 5XSO, chain A) and KdpE (PDB ID: 4KFC, chain A). The C‐terminal domains of FixJ and KdpE are colored blue and red, respectively, indicating different folds (helix‐turn‐helix, blue; winged helix, red), while their structurally conserved N‐terminal domains are gray. Arrows pointing to the gray domains indicate homologous secondary structures; arrows pointing to the colored domains indicate divergent secondary structures. Previous phylogenetic analysis and ancestral reconstruction (Chakravarty, Sreenivasan, et al., 2023) indicate that the C‐terminal β‐sheet of the winged helix evolved from the C‐terminal α‐helix of the helix‐turn‐helix by stepwise mutation.CC BY · PubMed Central
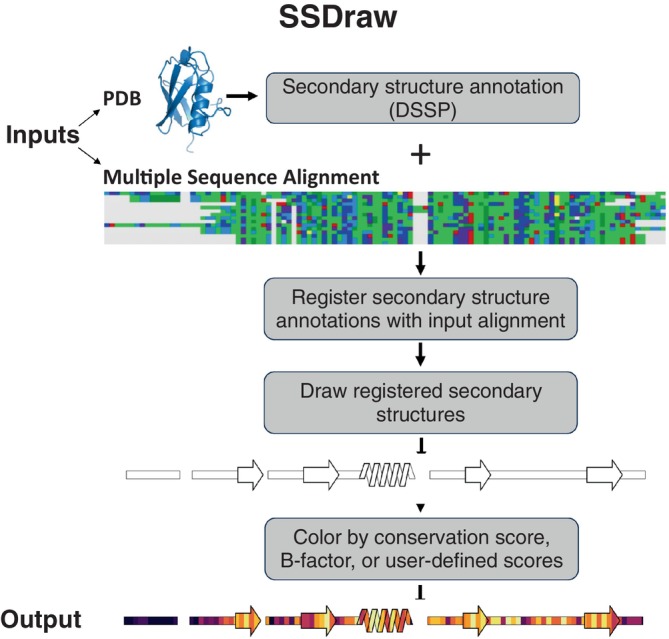
FIGURE 2 SSDraw flowchart. Inputs to SSDraw include three‐dimensional coordinates of a protein structure in Protein Data Bank (PDB) format and a single sequence or multiple sequence alignment (MSA) in FASTA format. Protein secondary structure is determined from the input PDB using Define Secondary Structure of Proteins (DSSP). Stacked polygons represent α‐helices, arrows represent β‐sheets, rectangles represent loops, β‐turns, disordered regions, and secondary structure shorter than three to four residues; alignment gaps are empty spaces. Secondary structures are registered with the input sequence or alignment to account for gaps and drawn using the Matplotlib patches library for Python3. Finally, secondary structures are colored by sequence conservation scores, B‐factor, or another user‐defined input. In this figure, the final diagram is colored by default sequence conservation scores. Output structures can be saved as .png, .eps, .svg, .ps, or .tiff files at a user‐specified resolution. MSA depicted using the Alignment Viewer program.
FIGURE 2 SSDraw flowchart. Inputs to SSDraw include three‐dimensional coordinates of a protein structure in Protein Data Bank (PDB) format and a single sequence or multiple sequence alignment (MSA) in FASTA format. Protein secondary structure is determined from the input PDB using Define Secondary Structure of Proteins (DSSP). Stacked polygons represent α‐helices, arrows represent β‐sheets, rectangles represent loops, β‐turns, disordered regions, and secondary structure shorter than three to four residues; alignment gaps are empty spaces. Secondary structures are registered with the input sequence or alignment to account for gaps and drawn using the Matplotlib patches library for Python3. Finally, secondary structures are colored by sequence conservation scores, B‐factor, or another user‐defined input. In this figure, the final diagram is colored by default sequence conservation scores. Output structures can be saved as .png, .eps, .svg, .ps, or .tiff files at a user‐specified resolution. MSA depicted using the Alignment Viewer program.CC BY · PubMed Central
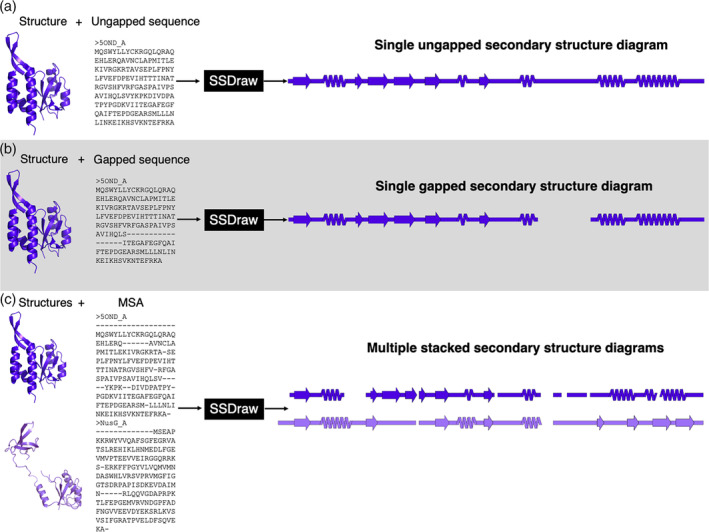
FIGURE 3 SSDraw has three modes of use. In the first mode, the user inputs a protein structure and an ungapped sequence; a single ungapped secondary structure diagram is outputted (A). In the second mode, the user inputs a protein structure and a gapped sequence; a single gapped secondary structure diagram is outputted (B). In the third mode, the user inputs multiple structures and a multiple sequence alignment that aligns their sequences; multiple stacked secondary structure diagrams are outputted. In all three panels, the experimentally determined structure of the transcriptional regulator RfaH (Belogurov et al., 2007; Zuber et al., 2018; PDB ID: 5OND, chain A, dark purple) and its sequence (in different alignments) are inputted. In panel (C), its homolog NusG (Kang et al., 2018; PDB ID: 6ZTJ, chain CF, light purple) is also inputted with a multiple sequence alignment (MSA). RfaH and NusG are members of the only known family of transcriptional regulators conserved from bacteria to humans (Werner, 2012). They share a structurally conserved N‐terminal domain, while their C‐terminal domains differ dramatically in the ground state (Burmann et al., 2012; Porter et al., 2022): RfaH's is all α‐helical, while NusG's is all β‐sheet.
FIGURE 3 SSDraw has three modes of use. In the first mode, the user inputs a protein structure and an ungapped sequence; a single ungapped secondary structure diagram is outputted (A). In the second mode, the user inputs a protein structure and a gapped sequence; a single gapped secondary structure diagram is outputted (B). In the third mode, the user inputs multiple structures and a multiple sequence alignment that aligns their sequences; multiple stacked secondary structure diagrams are outputted. In all three panels, the experimentally determined structure of the transcriptional regulator RfaH (Belogurov et al., 2007; Zuber et al., 2018; PDB ID: 5OND, chain A, dark purple) and its sequence (in different alignments) are inputted. In panel (C), its homolog NusG (Kang et al., 2018; PDB ID: 6ZTJ, chain CF, light purple) is also inputted with a multiple sequence alignment (MSA). RfaH and NusG are members of the only known family of transcriptional regulators conserved from bacteria to humans (Werner, 2012). They share a structurally conserved N‐terminal domain, while their C‐terminal domains differ dramatically in the ground state (Burmann et al., 2012; Porter et al., 2022): RfaH's is all α‐helical, while NusG's is all β‐sheet.CC BY · PubMed Central
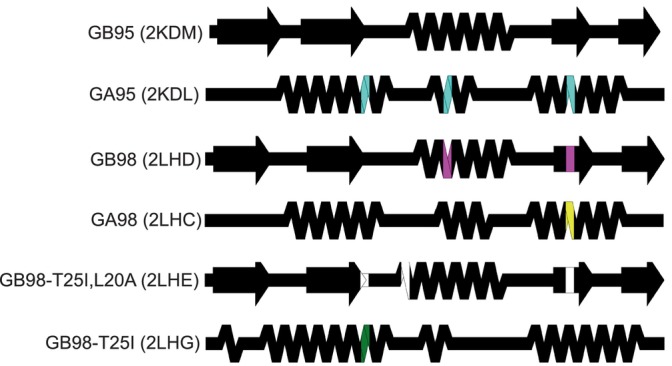
FIGURE 4 Comparing the structures of proteins with highly identical amino acid sequences but different folds. Diagrams show very different secondary structures derived from the nuclear magnetic resonance structures (Protein Data Bank [PDB] IDs in parentheses) of engineered variants of immunoglobulin binding protein GB (4β + α‐fold) and human serum albumin binding protein GA (trihelical bundle). This figure should be read from top to bottom. Position‐specific mutations required to switch a given fold from that of its predecessor, the diagram directly above it, are shown in different colors representing mutations unique to each protein. Black positions were not mutated relative to their immediate predecessors.
FIGURE 4 Comparing the structures of proteins with highly identical amino acid sequences but different folds. Diagrams show very different secondary structures derived from the nuclear magnetic resonance structures (Protein Data Bank [PDB] IDs in parentheses) of engineered variants of immunoglobulin binding protein GB (4β + α‐fold) and human serum albumin binding protein GA (trihelical bundle). This figure should be read from top to bottom. Position‐specific mutations required to switch a given fold from that of its predecessor, the diagram directly above it, are shown in different colors representing mutations unique to each protein. Black positions were not mutated relative to their immediate predecessors.CC BY · PubMed Central
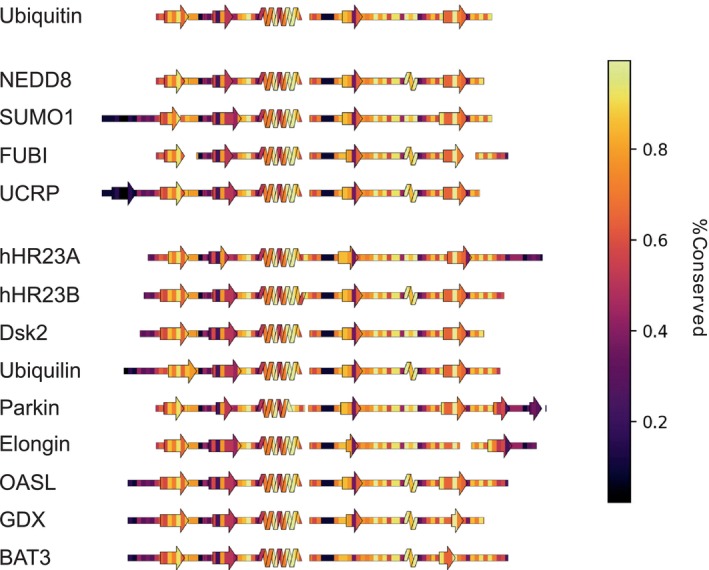
FIGURE 5 SSDraw diagrams for ubiquitin and ubiquitin‐like proteins colored by sequence conservation score (1.0 is highly conserved; 0.0 is least conserved). Sequences of secondary structure elements tend to be more conserved, with the notable exception of the second β‐sheet, whose binding functions vary among some ubiquitin‐like proteins.
FIGURE 5 SSDraw diagrams for ubiquitin and ubiquitin‐like proteins colored by sequence conservation score (1.0 is highly conserved; 0.0 is least conserved). Sequences of secondary structure elements tend to be more conserved, with the notable exception of the second β‐sheet, whose binding functions vary among some ubiquitin‐like proteins.CC BY · PubMed Central

Verification

Claims the paper makes

The claims and statistics of this paper haven’t been checked yet.

Run the check — free, no account needed. It reads the open-access text and checks the sources it cites.

A few free checks a day · papers already verified open instantly · results are public

Self-check

Percentages, sums and reported differences re-computed from the paper’s own numbers.

The self-check needs the paper’s full text.

Citations

Cites

Research works printed but not linked: 54

  1. 10.1038/s41586-020-2833-4 · DOI
  2. 2019, A review on the applications and recent advances in environmental DNA (edna) metagenomics, Reviews in Environmental Science and Bio/Technology, 18, 389, 10.1007/s11157-019-09501-4 · DOI
  3. 10.1371/journal.pcbi.1000667 · DOI
  4. 10.1126/science.abj8754 · DOI · Paper page
  5. 10.1126/science.ade2574 · DOI · Paper page
  6. Chowdhury R , Bouatta N , Biswas S , Floristean C , Kharkare A , Roye K , Rochereau C , Ahdritz G , Zhang J , Church GM et al. 2022. Single-sequence protein structure prediction using a language model and deep learning. Nat Biotechnol. · DOI · Paper page
  7. 10.1107/S0907444902003451 · DOI
  8. 10.1007/978-1-4939-7000-1_26 · DOI · Paper page
  9. 2021, Alphafold protein structure database: Massively expanding the structural coverage of protein-sequence space with high-accuracy models, Nucleic Acids Research, 50, D439
  10. 10.1093/nar/gkaa1100 · DOI · Paper page
  11. 10.1002/PRO.3943 · DOI
  12. 10.1126/science.abd8700 · DOI
  13. 2023, Inhibition of fam46/tent5 activity by bccipα adopting a unique fold, Science Advances, 9, eadf5583, 10.1126/sciadv.adf5583 · DOI
  14. 2023, Design and characterization of a protein fold switching network, Nat Commun, 14, 431, 10.1038/s41467-023-36065-3 · DOI
  15. 2023, Reversible switching between two common protein folds in a designed system using only temperature, Proc Natl Acad Sci U S A, 120, e2215418120, 10.1073/pnas.2215418120 · DOI
  16. 2023, Identification of a covert evolutionary pathway between two protein folds, Nat Commun, 14, 3177, 10.1038/s41467-023-38519-0 · DOI · Paper page
  17. 2008, Biochemistry, Metamorphic proteins. Science, 320, 1725
  18. 10.1073/pnas.1800168115 · DOI
  19. 2023, Evolutionary selection of proteins with two folds, Nat Commun, 14, 5478, 10.1038/s41467-023-41237-2 · DOI
  20. Porter LL . 2023. Fluid protein fold space and its implications. Bioessays.e2300057. · DOI
  21. 10.1002/prot.340080303 · DOI
  22. 10.1093/nar/gkg556 · DOI
  23. 10.1093/bioinformatics/btr575 · DOI
  24. 10.1038/nmeth.3258 · DOI
  25. 2017, Comparative visualization of protein secondary structures, BMC Bioinformatics, 18, 23
  26. 2021, 2dprots: Database of family-wide protein secondary structure diagrams, Bioinformatics, 37, 4599, 10.1093/bioinformatics/btab505 · DOI
  27. 2022, Overprot: Secondary structure consensus for protein families, Bioinformatics, 38, 3648, 10.1093/bioinformatics/btac384 · DOI
  28. 10.1186/1471-2105-5-113 · DOI
  29. 10.1007/978-1-62703-646-7_6 · DOI
  30. 10.1093/nar/gkr367 · DOI · Paper page
  31. 10.1093/nar/gkq1105 · DOI
  32. 10.1002/bip.360221211 · DOI · Paper page
  33. 10.1073/pnas.96.25.14258 · DOI
  34. 2021, Uncovering of cytochrome p450 anatomy by secstrannotator, Sci Rep, 11, 12345, 10.1038/s41598-021-91494-8 · DOI
  35. 10.1109/MCSE.2007.55 · DOI · Paper page
  36. 10.1093/bioinformatics/18.suppl_1.S71 · DOI
  37. 10.1016/j.molcel.2007.02.021 · DOI
  38. Zuber PK , Artsimovitch I , NandyMazumdar M , Liu Z , Nedialkov Y , Schweimer K , Rosch P , Knauer SH . 2018. The universally-conserved transcription factor rfah is recruited to a hairpin structure of the non-template DNA strand. Elife. 7. · DOI
  39. 10.1016/j.cell.2018.05.017 · DOI
  40. 10.1016/j.jmb.2012.01.031 · DOI
  41. 10.1016/j.cell.2012.05.042 · DOI
  42. 10.1038/s41467-022-31532-9 · DOI
  43. 10.1073/pnas.0700922104 · DOI
  44. 10.1073/pnas.0906408106 · DOI
  45. 10.1016/j.str.2011.11.018 · DOI
  46. 2016, Theoretical insights into the biophysics of protein bistability and evolutionary switches, PLoS Comput Biol, 12, e1004960, 10.1371/journal.pcbi.1004960 · DOI
  47. 2020, Exploring the sequence fitness landscape of a bridge between two protein folds, PLoS Comput Biol, 16, e1008285, 10.1371/journal.pcbi.1008285 · DOI
  48. 2004, Ubiquitin family proteins and their relationship to the proteasome: A structural perspective, Biochimica et Biophysica Acta (BBA)-Molecular Cell Research, 1695, 73, 10.1016/j.bbamcr.2004.10.005 · DOI
  49. 10.1073/pnas.0403498101 · DOI
  50. 2017, The nedd8 non-covalent binding region in the smurf hect domain is critical to its ubiquitn ligase function, Sci Rep, 7, 41364, 10.1038/srep41364 · DOI
  51. 10.1002/pro.4596 · DOI
  52. 10.1093/bioinformatics/btp163 · DOI · Paper page
  53. 10.1073/pnas.89.22.10915 · DOI · Paper page
  54. 10.1093/nar/gkw408 · DOI · Paper page

Metadata

Authors
Chen, E. A., & Porter, L. L.
Affiliations
National Institutes of Health (US)
Corresponding author
Porter, Lauren L.
Venue
Protein Science
Publisher
openRxiv
Published
2023-08-27
Volume
32
Issue
12
Pages
e4836-e4836
ISSN
0961-8368 (ISSN-L)
OpenAlex
W4388633862
Cited by
37
References
1
Citations by year
2026: 9 · 2025: 20 · 2024: 7 · 2023: 1
FWCI
3.30
Type
journal article
Language
en
Open access
Licence
cc-by
Locations
  • Protein Science (publishedVersion, cc-by)
  • bioRxiv (Cold Spring Harbor Laboratory) (acceptedVersion)
  • PubMed Central (publishedVersion, cc-by)
  • PubMed (publishedVersion)
  • PubMed Central (submittedVersion, public-domain)
Funders
  • National Institutes of Health (LM202011)
  • U.S. National Library of Medicine (LM202011, ZIALM202011)
Topics
  • Life Sciences › Biochemistry, Genetics and Molecular Biology › Molecular Biology › Protein Structure and Dynamics
  • Life Sciences › Biochemistry, Genetics and Molecular Biology › Structural Biology › Enzyme Structure and Function
  • Life Sciences › Biochemistry, Genetics and Molecular Biology › Molecular Biology › RNA and protein synthesis mechanisms
Keywords
protein secondary structure, homologous proteins, conservation scores, Debye-Waller factor, multiple sequence alignment, protein structure visualization

About these checks

Registry, retraction, Cites and statistics results are computed, not judged, with one exception: a printed reference that no index lists is read once by a model before it counts as a citation error. Claims are extracted by a model and kept only when their quote appears verbatim in the text; each cited source is then checked, with a model’s help, for whether it says what the claim relies on. Those verdicts can be wrong — read the claim’s quote and the cited source before relying on one.

Statistics and arithmetic are recomputed, not judged.

Confidence bands are shown only for fields calibrated on our annotated test set. None is calibrated yet, so no band is shown.

What counts as a claim ›How we measure confidence ›How we check this ›

Are you an author, or do you see a problem with this page? Request a review