PreprintCited by 7Bacterial Genetics and BiotechnologyEvolution and Genetic DynamicsAntibiotic Resistance in Bacteria

The DOI matches its Crossref record; 1 of the 1 references it cites were found in a registry or an index.

Evolution of a Plasmid Regulatory Circuit Ameliorates Plasmid Fitness Cost

Open access

Preprint — published as 10.1093/molbev/msaf062 · Paper page

Abstract

Plasmids play a major role in rapid adaptation of bacteria by facilitating horizontal transfer of diverse genes, most notably those conferring antibiotic resistance. While most plasmids that replicate in a broad range of bacteria also persist well in diverse hosts, there are exceptions that are poorly understood. We investigated why a broad-host range plasmid, pBP136, originally found in clinical Bordetella pertussis isolates, quickly became extinct in laboratory Escherichia coli populations. Through experimental evolution we found that inactivation of a previously uncharacterized plasmid gene, upf31 , drastically improved plasmid maintenance in E. coli . This gene inactivation resulted in decreased transcription of the global plasmid regulators ( korA , korB, and korC) and numerous genes in their regulons. It also caused transcriptional changes in many chromosomal genes primarily related to metabolism. In silico analyses suggested that the change in plasmid transcriptome may be initiated by Upf31 interacting with the plasmid regulator KorB. Expression of upf31 in trans negatively affected persistence of pBP136Δ upf31 as well as the closely related archetypal IncP-1β plasmid R751, which is stable in E. coli and natively encodes a truncated upf31 allele. Our results demonstrate that while the upf31 allele in pBP136 might advantageously modulate gene expression in its original host, B. pertussis , it has harmful effects in E. coli . Thus, evolution of a single plasmid gene can change the range of hosts in which that plasmid persists, due to effects on the regulation of plasmid gene transcription.

Overview

The claims and statistics of this paper haven’t been checked yet.

Run the check — free, no account needed. It reads the open-access text and checks the sources it cites.

A few free checks a day · papers already verified open instantly · results are public

Integrity signals

Registry

Crossref · 10.1101/2024.02.05.579024

Cites

1 of 1 references verified0 citation errors · 0 not checkable

Statistics

Figures

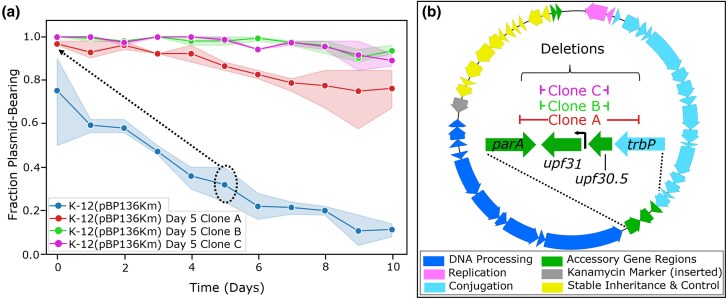
Fig. 1. Plasmid evolution rapidly improved pBP136Km persistence. a) Persistence of the ancestral plasmid pBP136Km (blue) and three populations (red, green, magenta) inoculated with clones that were isolated on Day 5 of the ancestral plasmid assay (see dotted ellipse and arrow). Clones isolated on Day 5 had greatly improved persistence compared with the ancestor. Lighter shades indicate 95% confidence interval. b) Genomic map of pBP136Km in evolved day 5 clones revealed deletions in the accessory region (green) between the trb-tra operons (light and dark blue, respectively).
Fig. 1. Plasmid evolution rapidly improved pBP136Km persistence. a) Persistence of the ancestral plasmid pBP136Km (blue) and three populations (red, green, magenta) inoculated with clones that were isolated on Day 5 of the ancestral plasmid assay (see dotted ellipse and arrow). Clones isolated on Day 5 had greatly improved persistence compared with the ancestor. Lighter shades indicate 95% confidence interval. b) Genomic map of pBP136Km in evolved day 5 clones revealed deletions in the accessory region (green) between the trb-tra operons (light and dark blue, respectively).CC BY-NC · PubMed Central
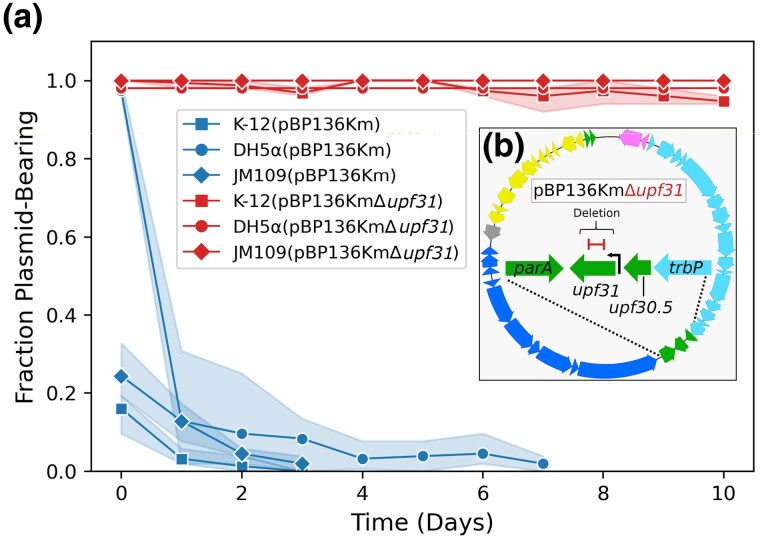
Fig. 2. Upf31 inactivation alone explained improved persistence in E. coli hosts. a) The poor persistence of plasmid pBP136Km (blue lines) in E. coli strains K-12 MG1655, DH5α, and JM109 (square, circle, and diamond respectively) was markedly improved after an internal 168-bp deletion in plasmid gene upf31 (red lines). Lighter shades indicate 95% confidence interval. b) A map of pBP136KmΔupf31 showing the 168 bp deletion (red) within the coding sequence of upf31.
Fig. 2. Upf31 inactivation alone explained improved persistence in E. coli hosts. a) The poor persistence of plasmid pBP136Km (blue lines) in E. coli strains K-12 MG1655, DH5α, and JM109 (square, circle, and diamond respectively) was markedly improved after an internal 168-bp deletion in plasmid gene upf31 (red lines). Lighter shades indicate 95% confidence interval. b) A map of pBP136KmΔupf31 showing the 168 bp deletion (red) within the coding sequence of upf31.CC BY-NC · PubMed Central
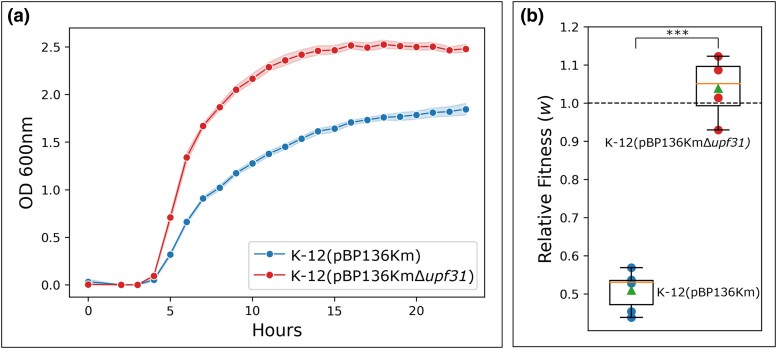
Fig. 3. The presence of upf31 encoded on pBP136Km lowered host fitness. a) Bacterial growth in batch culture was slower (blue) when carrying pBP136Km with ancestral upf31 compared with the evolved plasmid pBP136KmΔupf31 with inactivated upf31 (red). Lighter shades indicate 95% confidence interval (two sample independent t-test of max growth rates, n = 10, P = 2.35 × 10⁻³). b) With the fitness of plasmid-free K-12 normalized to 1 (dashed line), the relative fitness (w) of E. coli with ancestral pBP136Km (in blue) was 0.51, i.e. a ∼49% cost (two sample independent t-test, n = 5, P = 1.70 × 10⁻⁶). The relative fitness of evolved genotype K-12 (pBP136KmΔupf31) to plasmid-free K-12 was statistically indistinguishable (two sample independent t-test, n = 5, P = 0.40). Box is interquartile range, green triangle is mean, and orange line is median, ***P ≤ 0.001.
Fig. 3. The presence of upf31 encoded on pBP136Km lowered host fitness. a) Bacterial growth in batch culture was slower (blue) when carrying pBP136Km with ancestral upf31 compared with the evolved plasmid pBP136KmΔupf31 with inactivated upf31 (red). Lighter shades indicate 95% confidence interval (two sample independent t-test of max growth rates, n = 10, P = 2.35 × 10⁻³). b) With the fitness of plasmid-free K-12 normalized to 1 (dashed line), the relative fitness (w) of E. coli with ancestral pBP136Km (in blue) was 0.51, i.e. a ∼49% cost (two sample independent t-test, n = 5, P = 1.70 × 10⁻⁶). The relative fitness of evolved genotype K-12 (pBP136KmΔupf31) to plasmid-free K-12 was statistically indistinguishable (two sample independent t-test, n = 5, P = 0.40). Box is interquartile range, green triangle is mean, and orange line is median, ***P ≤ 0.001.CC BY-NC · PubMed Central
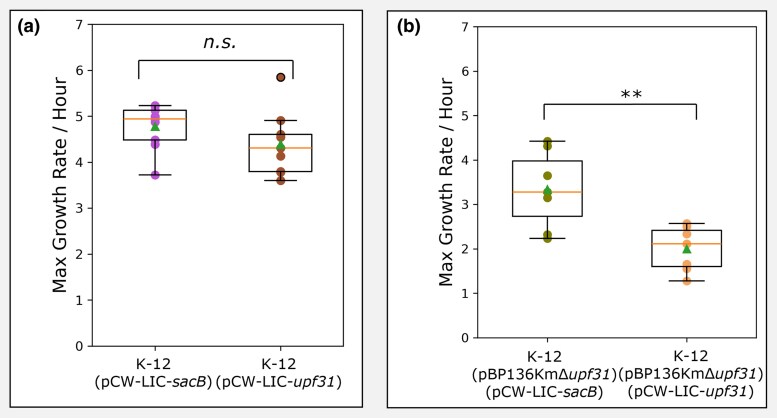
Fig. 4. Upf31 requires the presence of pBP136Km to significantly reduce K-12 growth rate. a) In the absence of plasmid pBP136Km there was no significant difference in maximum growth rate between E. coli K-12 expressing control sacB (purple) and upf31 (brown) (two sample independent t-test, n = 10, P = 0.46). b) K-12 (pBP136KmΔupf31) with upf31 expressed in trans (orange) showed a lower maximum growth rate than K-12 (pBP136KmΔupf31) with control sacB expressed in trans (green) (two sample independent t-test, n = 10, P-value = 4.23 × 10⁻³). Box is interquartile range, green triangle is mean, and orange line is median, n.s.P > 0.05, **P ≤ 0.01.
Fig. 4. Upf31 requires the presence of pBP136Km to significantly reduce K-12 growth rate. a) In the absence of plasmid pBP136Km there was no significant difference in maximum growth rate between E. coli K-12 expressing control sacB (purple) and upf31 (brown) (two sample independent t-test, n = 10, P = 0.46). b) K-12 (pBP136KmΔupf31) with upf31 expressed in trans (orange) showed a lower maximum growth rate than K-12 (pBP136KmΔupf31) with control sacB expressed in trans (green) (two sample independent t-test, n = 10, P-value = 4.23 × 10⁻³). Box is interquartile range, green triangle is mean, and orange line is median, n.s.P > 0.05, **P ≤ 0.01.CC BY-NC · PubMed Central
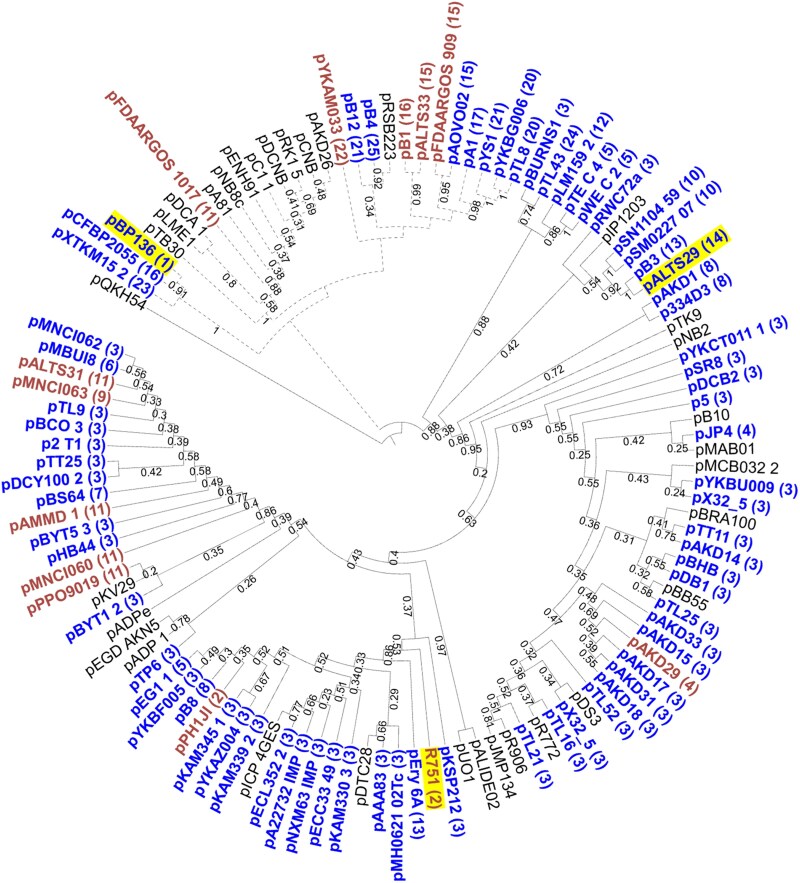
Fig. 5. Phylogeny of 115 IncP-1β plasmids with those containing upf31 homologs annotated in color (blue for full-length alleles, red for truncated alleles). Plasmids in this study highlighted in yellow. The distinct upf31 allele numbers are shown in parentheses after the plasmid name. Dashed branches are IncP-1βI, solid branches are IncP-1βII, bootstrap values >0.16 are shown. Summary phylogeny based on nine backbone genes (see Materials and Methods). Some IncP-1β plasmids are not shown as they have missing or incomplete backbone genes (supplementary data S1, Supplementary Material online). The IncP-1γ plasmid pQKH54 was used as the outgroup.
Fig. 5. Phylogeny of 115 IncP-1β plasmids with those containing upf31 homologs annotated in color (blue for full-length alleles, red for truncated alleles). Plasmids in this study highlighted in yellow. The distinct upf31 allele numbers are shown in parentheses after the plasmid name. Dashed branches are IncP-1βI, solid branches are IncP-1βII, bootstrap values >0.16 are shown. Summary phylogeny based on nine backbone genes (see Materials and Methods). Some IncP-1β plasmids are not shown as they have missing or incomplete backbone genes (supplementary data S1, Supplementary Material online). The IncP-1γ plasmid pQKH54 was used as the outgroup.CC BY-NC · PubMed Central
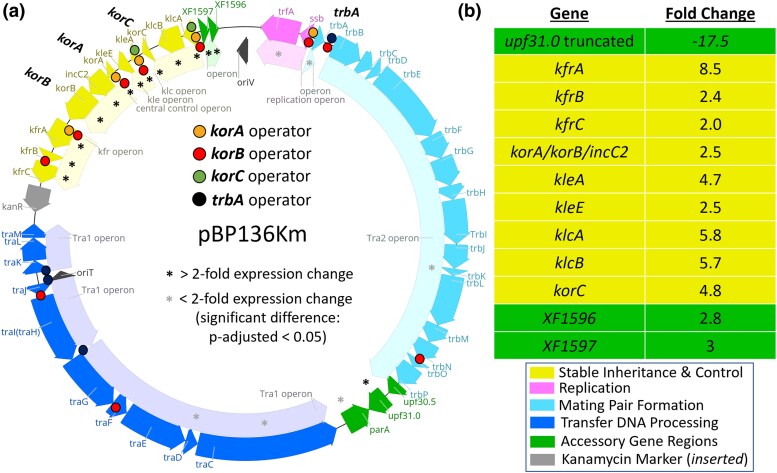
Fig. 6. Expression of global plasmid regulators and their associated operons was increased in the presence of ancestral upf31 compared with the deletion mutant. a) Genetic map of pBP136Km with operons and operator sites annotated for global regulators KorA, KorB, KorC, and TrbA. Asterisks denote differentially expressed plasmid genes in the presence of upf31. b) Table of plasmid-encoded genes with at least 2-fold differential expression (black asterisks in a) in the presence of upf31. Note that the expression of the ancestral upf31 is 17.5-fold lower than that of the truncated upf31 knockout.
Fig. 6. Expression of global plasmid regulators and their associated operons was increased in the presence of ancestral upf31 compared with the deletion mutant. a) Genetic map of pBP136Km with operons and operator sites annotated for global regulators KorA, KorB, KorC, and TrbA. Asterisks denote differentially expressed plasmid genes in the presence of upf31. b) Table of plasmid-encoded genes with at least 2-fold differential expression (black asterisks in a) in the presence of upf31. Note that the expression of the ancestral upf31 is 17.5-fold lower than that of the truncated upf31 knockout.CC BY-NC · PubMed Central
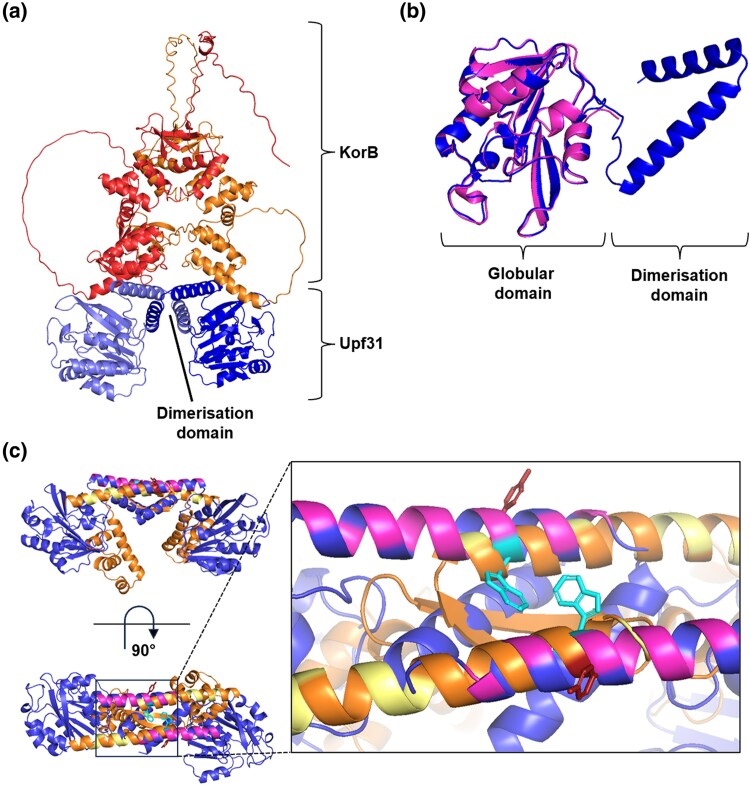
Fig. 7. AlphaFold2 modeling reveals the potential interaction between pBP136 Upf31 and KorB is mediated by the CTD. a) AlphaFold2 modeling of the pBP136 Upf31 homodimer (light and dark blue) with the pBP136 KorB homodimer (red and orange). b) Superimposed AlphaFold2 models of pBP136 Upf31 (dark blue) and R751 Upf31 (magenta) highlighting the additional CTD of pBP136 Upf31. c) Overlay of the AlphaFold2 model of pBP136 Upf31 homodimer (dark blue) with the crystal structure of the RK2 KorA homodimer (PDB: 5CM3, DNA duplex removed). Basic residues in the dimerization domain are highlighted in magenta or yellow. KorA Y84 is highlighted in deep red, Upf31 W198 is highlighted in cyan.
Fig. 7. AlphaFold2 modeling reveals the potential interaction between pBP136 Upf31 and KorB is mediated by the CTD. a) AlphaFold2 modeling of the pBP136 Upf31 homodimer (light and dark blue) with the pBP136 KorB homodimer (red and orange). b) Superimposed AlphaFold2 models of pBP136 Upf31 (dark blue) and R751 Upf31 (magenta) highlighting the additional CTD of pBP136 Upf31. c) Overlay of the AlphaFold2 model of pBP136 Upf31 homodimer (dark blue) with the crystal structure of the RK2 KorA homodimer (PDB: 5CM3, DNA duplex removed). Basic residues in the dimerization domain are highlighted in magenta or yellow. KorA Y84 is highlighted in deep red, Upf31 W198 is highlighted in cyan.CC BY-NC · PubMed Central
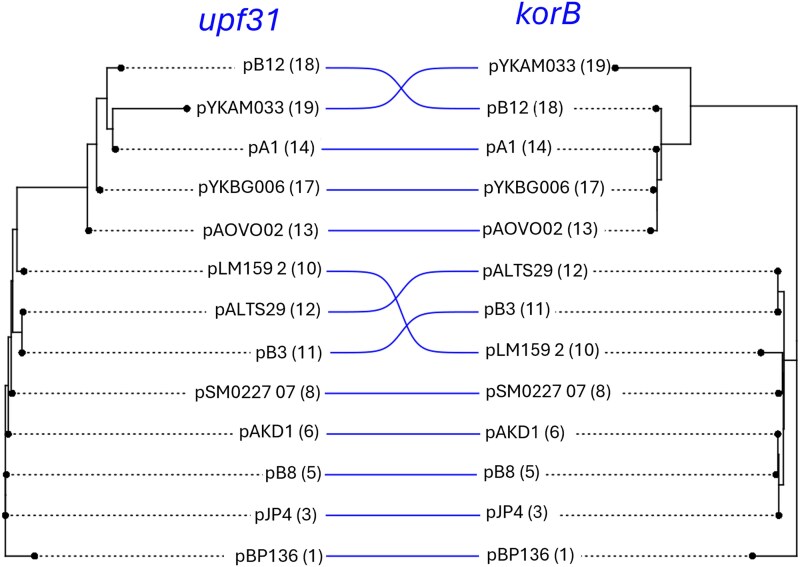
Fig. 8. Co-phylogenies of upf31 and korB homologs. Plasmid representatives from the IncP-1β plasmids that encode the 17 distinct full-length upf31 alleles are shown on the left with their respective korB gene on the right.
Fig. 8. Co-phylogenies of upf31 and korB homologs. Plasmid representatives from the IncP-1β plasmids that encode the 17 distinct full-length upf31 alleles are shown on the left with their respective korB gene on the right.CC BY-NC · PubMed Central

Verification

Claims the paper makes

The claims and statistics of this paper haven’t been checked yet.

Run the check — free, no account needed. It reads the open-access text and checks the sources it cites.

A few free checks a day · papers already verified open instantly · results are public

Self-check

Percentages, sums and reported differences re-computed from the paper’s own numbers.

The self-check needs the paper’s full text.

Citations

Cites

Research works printed but not linked: 76

  1. 10.18388/abp.2003_3696 · DOI
  2. Akhtar, P. (2002). Phylogeny and genomic motifs of the beta sub-family of IncP-1 plasmids. PhD Thesis. University of Birmingham.
  3. 10.1371/journal.pone.0124388 · DOI
  4. 10.1186/1471-2164-15-1039 · DOI
  5. 10.1006/jmbi.2001.4729 · DOI
  6. 10.1016/j.jmb.2005.03.062 · DOI
  7. 10.1111/j.1365-2958.2008.06498.x · DOI
  8. 10.1016/S1369-5274(00)00188-0 · DOI
  9. 10.1038/s41559-017-0242-3 · DOI
  10. 10.1038/335351a0 · DOI
  11. 10.1093/genetics/165.4.1641 · DOI
  12. 10.1099/mic.0.2006/001784-0 · DOI
  13. 10.1534/genetics.107.084475 · DOI
  14. 10.1186/gb-2003-4-9-r60 · DOI
  15. 10.1111/j.1574-6941.1998.tb00553.x · DOI
  16. 10.1073/pnas.79.6.1935 · DOI
  17. 10.2307/2410305 · DOI
  18. 10.1093/molbev/mst187 · DOI · Paper page
  19. 10.1099/mic.0.000862 · DOI
  20. 10.1371/journal.pbio.3001225 · DOI
  21. 10.1016/j.cub.2015.06.024 · DOI
  22. Hassan, H. , & Troxell, B . (2013). Transcriptional regulation by Ferric Uptake Regulator (Fur) in pathogenic bacteria. Frontiers in Cellular and Infection Microbiology, 3. https://www.frontiersin.org/articles/10.3389/fcimb.2013.00059 · DOI · Paper page
  23. 10.1038/nprot.2007.132 · DOI
  24. 10.3391/mbi.2012.3.2.02 · DOI
  25. 10.1111/1574-6968.12241 · DOI
  26. 10.1038/s41559-020-1170-1 · DOI
  27. 10.1099/mic.0.29056-0 · DOI
  28. 10.1038/ismej.2014.191 · DOI
  29. 10.1128/jb.175.16.5078-5090.1993 · DOI
  30. 10.1006/jmbi.1999.2761 · DOI
  31. 10.1006/jmbi.1999.3359 · DOI
  32. 10.1371/journal.pbio.3001732 · DOI
  33. 10.1093/femsec/fiy104 · DOI
  34. 10.1038/nmeth.1923 · DOI · Paper page
  35. 10.1128/jb.176.16.5022-5032.1994 · DOI
  36. 10.3389/fmicb.2021.606409 · DOI
  37. 10.1093/bioinformatics/btt656 · DOI · Paper page
  38. 10.1038/s41559-017-0243-2 · DOI
  39. 10.1186/s13059-014-0550-8 · DOI · Paper page
  40. 10.3389/fcimb.2021.660702 · DOI
  41. 10.1101/2024.01.29.577767 · DOI
  42. 10.1101/2024.02.16.579611 · DOI
  43. 10.1038/s41592-022-01488-1 · DOI · Paper page
  44. 10.2307/2409918 · DOI
  45. 10.1016/S0140-6736(21)02724-0 · DOI · Paper page
  46. 10.1098/rstb.2009.0037 · DOI
  47. 10.1006/jmbi.1994.1404 · DOI
  48. 10.3389/fmicb.2013.00044 · DOI
  49. 10.1093/molbev/msw163 · DOI
  50. 10.1093/nar/gkw191 · DOI
  51. Sambrook, Joseph ., & Russell, D. W. (David W., 1957-. (2001). Molecular cloning: A Laboratory Manual (3rd ed.). Cold Spring Harbor Laboratory Press; WorldCat.org.
  52. 10.1016/j.tim.2018.06.007 · DOI
  53. 10.1038/ncomms6208 · DOI
  54. 10.1038/ncomms7845 · DOI
  55. 1985, Regions of broad-host-range plasmid RK2 involved in replication and stable maintenance in nine species of gram-negative bacteria, Journal of Bacteriology, 164, 446, 10.1128/jb.164.1.446-455.1985 · DOI
  56. 10.1093/molbev/mss210 · DOI
  57. 10.1264/jsme2.me10155 · DOI
  58. 10.1007/s11274-008-9653-2 · DOI
  59. 10.1128/JB.01906-06 · DOI
  60. 10.1038/ismej.2010.72 · DOI
  61. 10.1038/nrg3962 · DOI
  62. 10.1038/s41598-017-04662-0 · DOI
  63. 10.1046/j.1365-2958.2000.02006.x · DOI
  64. 10.1016/j.plasmid.2017.03.006 · DOI
  65. 10.1371/journal.pbio.3001988 · DOI
  66. 10.1006/jmbi.1998.2060 · DOI
  67. 10.1111/1462-2920.14880 · DOI
  68. 10.1371/journal.pone.0126210 · DOI · Paper page
  69. 10.1128/mbio.00442-23 · DOI
  70. 10.1128/JB.06395-11 · DOI
  71. 10.1099/mic.0.068387-0 · DOI
  72. 10.1111/mmi.13407 · DOI
  73. 10.1128/JB.183.3.1022-1031.2001 · DOI
  74. 10.1128/jb.179.23.7201-7209.1997 · DOI
  75. 10.1016/j.jtbi.2009.10.013 · DOI
  76. 10.1073/pnas.80.4.1101 · DOI

Metadata

Authors
Elg, C. A., Mack, E., Rolfsmeier, M., McLean, T. C., Kosterlitz, O., Soderling, E., Narum, S., Rowley, P. A., Thomas, C. M., & Top, E. M.
Affiliations
  • University of Idaho (US)
  • John Innes Centre (GB)
  • University of Birmingham (GB)
Corresponding author
Top, Eva M.
Venue
Molecular Biology and Evolution
Publisher
openRxiv
Published
2024-02-06
Volume
42
Issue
4
ISSN
0737-4038 (ISSN-L)
OpenAlex
W4408956324
Cited by
7
References
1
Citations by year
2026: 4 · 2025: 3
FWCI
4.12
Type
journal article
Language
en
Open access
Licence
cc-by-nc
Locations
  • Molecular Biology and Evolution (publishedVersion, cc-by-nc)
  • bioRxiv (Cold Spring Harbor Laboratory) (acceptedVersion, cc-by-nc-nd)
  • Europe PMC (PubMed Central) (publishedVersion, cc-by-nc)
  • PubMed Central (publishedVersion, cc-by-nc)
  • PubMed (publishedVersion)
  • PubMed Central (submittedVersion, cc-by-nc-nd)
Funders
  • National Science Foundation (DGE-2019265372, 1762114)
  • University of Washington
  • University of Arizona
  • Wellcome Trust (221776, 221776/Z/2/Z)
  • National Institutes of Health
  • National Science Foundation of Sri Lanka
  • National Institute of Allergy and Infectious Diseases (R01AI084918)
  • Division of Environmental Biology (2142718)
  • National Science Foundation Graduate Research Fellowship Program (DGE‐1762114)
Topics
  • Life Sciences › Biochemistry, Genetics and Molecular Biology › Genetics › Bacterial Genetics and Biotechnology
  • Life Sciences › Biochemistry, Genetics and Molecular Biology › Genetics › Evolution and Genetic Dynamics
  • Health Sciences › Medicine › Microbiology (medical) › Antibiotic Resistance in Bacteria
Keywords
plasmid persistence, KorB, kora, transcriptional repression, broad-host-range plasmids, Bordetella pertussis, Escherichia coli, experimental evolution

About these checks

Registry, retraction, Cites and statistics results are computed, not judged, with one exception: a printed reference that no index lists is read once by a model before it counts as a citation error. Claims are extracted by a model and kept only when their quote appears verbatim in the text; each cited source is then checked, with a model’s help, for whether it says what the claim relies on. Those verdicts can be wrong — read the claim’s quote and the cited source before relying on one.

Statistics and arithmetic are recomputed, not judged.

Confidence bands are shown only for fields calibrated on our annotated test set. None is calibrated yet, so no band is shown.

What counts as a claim ›How we measure confidence ›How we check this ›

Are you an author, or do you see a problem with this page? Request a review