PreprintCited by 17Bacterial Genetics and BiotechnologyGene Regulatory Network AnalysisRedox biology and oxidative stress

The DOI matches its Crossref record; 1 of the 1 references it cites were found in a registry or an index.

Glycogen phase separation drives macromolecular rearrangement and asymmetric division in Escherichia coli

Open access

Preprint — published as 10.1038/s44318-025-00621-y

Abstract

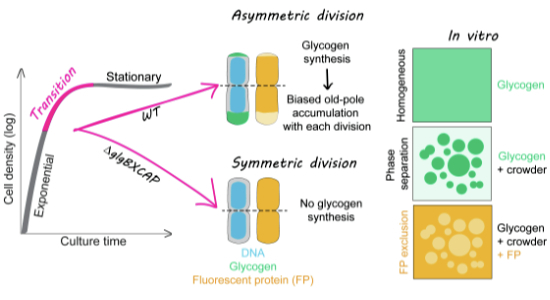
Bacteria often experience nutrient limitation. While the exponential and stationary growth phases have been characterized in the model bacterium Escherichia coli , little is known about what transpires inside individual cells during the transition between these two phases. Through quantitative cell imaging, we found that the positions of nucleoids and cell division sites become increasingly asymmetric during transition phase. These asymmetries were coupled with asymmetric reorganization of protein, ribosome, and RNA probes in the cytoplasm. Results from live-cell imaging experiments, complemented with genetic and 13 C whole-cell nuclear magnetic resonance spectroscopy studies, show that preferential accumulation of the storage polymer glycogen at the old cell pole leads to the observed rearrangements and asymmetric divisions. Live-cell atomic force microscopy analysis, combined with in vitro biochemical experiments, suggests that these phenotypes are due to the propensity of glycogen to phase separate into soft condensates in the crowded cytoplasm. Glycogen-associated differences in cell sizes between strains and future daughter cells suggest that glycogen phase separation allows cells to store large glucose reserves without counting them as cytoplasmic space.

Overview

The claims and statistics of this paper haven’t been checked yet.

Run the check — free, no account needed. It reads the open-access text and checks the sources it cites.

A few free checks a day · papers already verified open instantly · results are public

Integrity signals

Registry

Crossref · 10.1101/2024.04.19.590186

Cites

1 of 1 references verified0 citation errors · 0 not checkable

Statistics

Figures

Image 1
CC BY · PubMed Central
Image 2
CC BY · PubMed Central
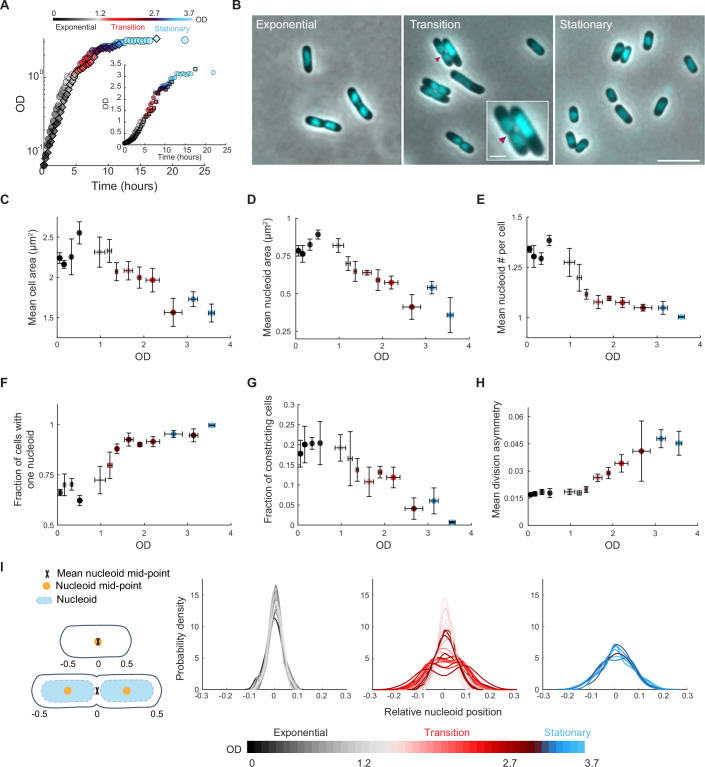
Figure 1 Cellular features change as the cell density of the culture increases. (A) Growth curves of two independent cultures of strain CJW4677. The datapoints for the same culture have the same shape (spherical vs square). OD measurements were manually collected by spectrophotometry over time. (B) Representative phase-contrast images of DAPI-labeled cells in exponential (OD = 0.5), transition (OD = 2.0), and stationary phase (OD = 3.25). The magenta arrowhead indicates the site of cell constriction. The inset shows a zoomed view of two cells in the transition phase displaying cellular asymmetries in nucleoid and/or constriction positioning. The scale bars in the inset and larger field of view are 1 and 5 µm, respectively. (C) Scatter plot of OD vs. mean cell area. Samples of different cultures of strain CJW4677 were collected at 35 different ODs (n > 500 cells for each OD) for cell imaging. The binned data for the indicated OD ranges are shown, with the mean describing the averaged mean value for cell samples from three OD values and error bars indicating the standard deviation. Gray, red, and blue shades indicate exponential, transition, and stationary phases, respectively. (D) Same as (C) but for OD vs. mean nucleoid area. (E) Same as (C) but for OD vs. mean number of nucleoids per cell. (F) Same as (C) but for OD vs. fraction of cells with one nucleoid. (G) Same as (C) but for OD vs. the fraction of constricting cells in the population. (H) Same as (C) but for OD vs. mean division asymmetry, calculated by dividing the absolute distance of the division position from the cell center by cell length and averaging across cells. This was done for cultures at ODs at which the fraction of dividing cells in the population was greater than 0.05. (I) Kernel density plots of the relative nucleoid positioning for cells in exponential, transition, or stationary phases, determined by calculating the absolute distance between the nucleoid mid-point and cell center, normalized for cell length. Note that for cells with two nucleoids, their relative mid-points were averaged such that when the center of each nucleoid was positioned at the relative quarter cell positions, the mean mid-point was at the cell center (see schematic). Source data are available online for this figure.
Figure 1 Cellular features change as the cell density of the culture increases. (A) Growth curves of two independent cultures of strain CJW4677. The datapoints for the same culture have the same shape (spherical vs square). OD measurements were manually collected by spectrophotometry over time. (B) Representative phase-contrast images of DAPI-labeled cells in exponential (OD = 0.5), transition (OD = 2.0), and stationary phase (OD = 3.25). The magenta arrowhead indicates the site of cell constriction. The inset shows a zoomed view of two cells in the transition phase displaying cellular asymmetries in nucleoid and/or constriction positioning. The scale bars in the inset and larger field of view are 1 and 5 µm, respectively. (C) Scatter plot of OD vs. mean cell area. Samples of different cultures of strain CJW4677 were collected at 35 different ODs (n > 500 cells for each OD) for cell imaging. The binned data for the indicated OD ranges are shown, with the mean describing the averaged mean value for cell samples from three OD values and error bars indicating the standard deviation. Gray, red, and blue shades indicate exponential, transition, and stationary phases, respectively. (D) Same as (C) but for OD vs. mean nucleoid area. (E) Same as (C) but for OD vs. mean number of nucleoids per cell. (F) Same as (C) but for OD vs. fraction of cells with one nucleoid. (G) Same as (C) but for OD vs. the fraction of constricting cells in the population. (H) Same as (C) but for OD vs. mean division asymmetry, calculated by dividing the absolute distance of the division position from the cell center by cell length and averaging across cells. This was done for cultures at ODs at which the fraction of dividing cells in the population was greater than 0.05. (I) Kernel density plots of the relative nucleoid positioning for cells in exponential, transition, or stationary phases, determined by calculating the absolute distance between the nucleoid mid-point and cell center, normalized for cell length. Note that for cells with two nucleoids, their relative mid-points were averaged such that when the center of each nucleoid was positioned at the relative quarter cell positions, the mean mid-point was at the cell center (see schematic). Source data are available online for this figure.CC BY · PubMed Central
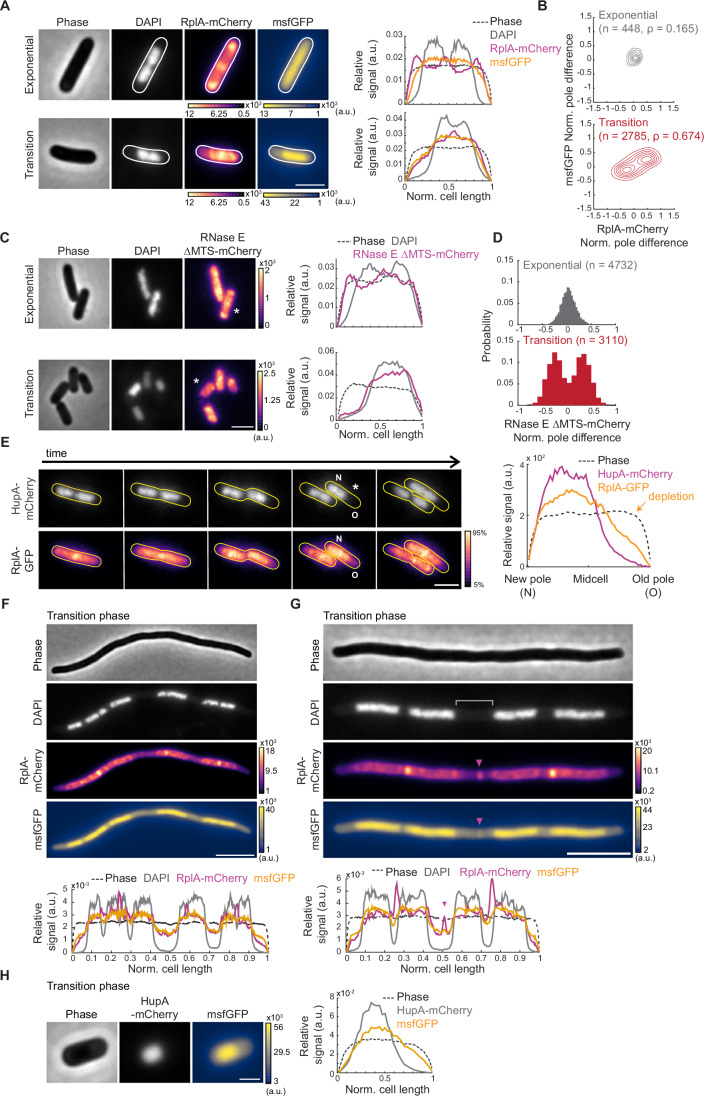
Figure 2 The localization pattern of cytoplasmic components changes in the transition phase. (A) Representative phase-contrast and fluorescence images of DAPI-labeled CJW7325 cells expressing RplA-mCherry and msfGFP, along with corresponding cell signal intensity profiles. Cultures were in exponential phase (OD = 0.14) or transition phase (OD = 1.83), as indicated. Fluorescence intensity is indicated in arbitrary units (a.u.). Scale bar: 2 µm. (B) Contour plots showing the normalized pole difference of msfGFP and RplA-mCherry signals in cells in exponential (top, n = 448) or transition (bottom, n = 2785) phase. The normalized pole difference of a fluorescent signal corresponds to the difference in this signal between pole regions divided by the average signal intensity across the cell. The contour lines represent the 0.167, 0.33, 0.5, 0.66, 0.83, and 1 kernel density envelopes of the data. (C) Representative images of DAPI-stained CJW5685 cells expressing RNase E ∆MTS tagged with mCherry in exponential (OD = 0.1) or transition (OD = 1.3) phase, along with signal intensity profiles for the indicated (*) cell. Scale bar: 2 µm. (D) Histograms of normalized pole difference of RNase E ∆MTS-mCherry in CJW5685 cells in exponential (OD = 0.1, n = 4732) or transition (OD = 1.7, n = 3110) phase. (E) Time-lapse sequence of a cell (CJW5159) expressing RplA-GFP and HupA-mCherry, with “N” and “O” indicating the new and old poles, respectively. Cells in exponential phase at OD ~ 0.5 were washed in spent medium from a transition-phase culture (OD = 2.63) and spotted on an agarose pad containing the same spent medium. The RplA-GFP images were scaled to reflect the 5-95% range of signal intensity for each image. The signal intensity profile is provided by the cell marked by an asterisk. Scale bar: 2 µm. (F) Representative phase-contrast and fluorescence images of a cephalexin-treated and DAPI-labeled CJW7325 cell carrying RplA-mCherry and msfGFP in the transition phase, with the corresponding signal intensity profiles shown below. Fluorescence intensities are indicated in arbitrary units (a.u.). Scale bar: 5 µm. (G) Same as (F) but highlighting a band of enriched RplA-mCherry and msfGFP signals (purple arrowheads) in the region lacking DAPI staining (gray bracket). Scale bar: 5 µm. (H) Phase-contrast and fluorescence images of a CJW7326 cell carrying HupA-mCherry and msfGFP, along with the corresponding signal intensity profile. Scale bar: 1 µm. Source data are available online for this figure.
Figure 2 The localization pattern of cytoplasmic components changes in the transition phase. (A) Representative phase-contrast and fluorescence images of DAPI-labeled CJW7325 cells expressing RplA-mCherry and msfGFP, along with corresponding cell signal intensity profiles. Cultures were in exponential phase (OD = 0.14) or transition phase (OD = 1.83), as indicated. Fluorescence intensity is indicated in arbitrary units (a.u.). Scale bar: 2 µm. (B) Contour plots showing the normalized pole difference of msfGFP and RplA-mCherry signals in cells in exponential (top, n = 448) or transition (bottom, n = 2785) phase. The normalized pole difference of a fluorescent signal corresponds to the difference in this signal between pole regions divided by the average signal intensity across the cell. The contour lines represent the 0.167, 0.33, 0.5, 0.66, 0.83, and 1 kernel density envelopes of the data. (C) Representative images of DAPI-stained CJW5685 cells expressing RNase E ∆MTS tagged with mCherry in exponential (OD = 0.1) or transition (OD = 1.3) phase, along with signal intensity profiles for the indicated (*) cell. Scale bar: 2 µm. (D) Histograms of normalized pole difference of RNase E ∆MTS-mCherry in CJW5685 cells in exponential (OD = 0.1, n = 4732) or transition (OD = 1.7, n = 3110) phase. (E) Time-lapse sequence of a cell (CJW5159) expressing RplA-GFP and HupA-mCherry, with “N” and “O” indicating the new and old poles, respectively. Cells in exponential phase at OD ~ 0.5 were washed in spent medium from a transition-phase culture (OD = 2.63) and spotted on an agarose pad containing the same spent medium. The RplA-GFP images were scaled to reflect the 5-95% range of signal intensity for each image. The signal intensity profile is provided by the cell marked by an asterisk. Scale bar: 2 µm. (F) Representative phase-contrast and fluorescence images of a cephalexin-treated and DAPI-labeled CJW7325 cell carrying RplA-mCherry and msfGFP in the transition phase, with the corresponding signal intensity profiles shown below. Fluorescence intensities are indicated in arbitrary units (a.u.). Scale bar: 5 µm. (G) Same as (F) but highlighting a band of enriched RplA-mCherry and msfGFP signals (purple arrowheads) in the region lacking DAPI staining (gray bracket). Scale bar: 5 µm. (H) Phase-contrast and fluorescence images of a CJW7326 cell carrying HupA-mCherry and msfGFP, along with the corresponding signal intensity profile. Scale bar: 1 µm. Source data are available online for this figure.CC BY · PubMed Central
Figure EV1 Localization of various cytoplasmic probes in cells in transition phase. (A) Representative fluorescence images of DAPI-stained E. coli cells expressing different ribosomal protein fusions in transition phase: RplA-GFP (CJW4677), RplA-msfGFP (CJW7020), and RpsB-msfGFP (CJW7021). Arrowheads indicate cell areas of ribosome signal depletion. Scale bar: 2 µm. (B) Representative fluorescence image of DAPI-stained E. coli cells (CJW7006) expressing mScarlet-I in transition phase. Arrowheads indicate cell areas of mScarlet-I depletion. Scale bar: 2 µm. (C) Representative fluorescence images of DAPI-stained E. coli expressing RplA-mCherry as well as free fluorescent GFP variants with the following net surface charges (strain name): -30 (CJW7485), -7 (CJW7486), 0 (CJW7487), +7 (CJW7488), +11a (CJW7489), +11b (CJW7490), +15 (CJW7491), and +25 (CJW7492). For GFP with a net surface charge +11, ‘a’ and ‘b’ refer to variations in the distribution of the charge on the protein surface (Schavemaker et al, 2017). Cells were grown in M9gluCAAT and supplemented with 0.4% arabinose to induce GFP expression. Arrowheads indicate cell areas depleted of the GFP variant. Scale bar: 2 µm. (D) Fluorescence images of representative DAPI- and RNASelect-labeled E. coli cells (CJW7324) in exponential (OD ~ 0.30) and transition (OD ~ 1.72) phase. Also shown are the corresponding fluorescence signal profiles for the indicated (*) cells. Arrowheads indicate areas depleted of RNASelect signal. Scale bar: 2 µm. Source data are available online for this figure.
Figure EV1 Localization of various cytoplasmic probes in cells in transition phase. (A) Representative fluorescence images of DAPI-stained E. coli cells expressing different ribosomal protein fusions in transition phase: RplA-GFP (CJW4677), RplA-msfGFP (CJW7020), and RpsB-msfGFP (CJW7021). Arrowheads indicate cell areas of ribosome signal depletion. Scale bar: 2 µm. (B) Representative fluorescence image of DAPI-stained E. coli cells (CJW7006) expressing mScarlet-I in transition phase. Arrowheads indicate cell areas of mScarlet-I depletion. Scale bar: 2 µm. (C) Representative fluorescence images of DAPI-stained E. coli expressing RplA-mCherry as well as free fluorescent GFP variants with the following net surface charges (strain name): -30 (CJW7485), -7 (CJW7486), 0 (CJW7487), +7 (CJW7488), +11a (CJW7489), +11b (CJW7490), +15 (CJW7491), and +25 (CJW7492). For GFP with a net surface charge +11, ‘a’ and ‘b’ refer to variations in the distribution of the charge on the protein surface (Schavemaker et al, 2017). Cells were grown in M9gluCAAT and supplemented with 0.4% arabinose to induce GFP expression. Arrowheads indicate cell areas depleted of the GFP variant. Scale bar: 2 µm. (D) Fluorescence images of representative DAPI- and RNASelect-labeled E. coli cells (CJW7324) in exponential (OD ~ 0.30) and transition (OD ~ 1.72) phase. Also shown are the corresponding fluorescence signal profiles for the indicated (*) cells. Arrowheads indicate areas depleted of RNASelect signal. Scale bar: 2 µm. Source data are available online for this figure.CC BY · PubMed Central
Figure EV2 Assessment of the potential effects of membrane retraction and cell division on the localization of cytoplasmic probes in transition-phase cells. (A) Microscopy images of MitoTracker Green-labeled cells (CJW7324) expressing RplA-mCherry. The samples were obtained from cultures in either exponential or transition phase. Fluorescence intensities are indicated in arbitrary units (a.u.). Signal intensity profiles are provided for the cells indicated by asterisks. White arrowheads show the depletion of RplA-mCherry signal at a cell pole. (B) Representative microscopy images of DAPI-stained FtsZ-depleted cells (CJW7588) expressing cytoplasmic msfGFP in transition phase in M9gluCAAT supplemented with 0.4% arabinose to induce the CRISPRi system, thereby blocking the expression of ftsZ. The corresponding signal intensity profile is shown below. Scale bar: 5 µm. Source data are available online for this figure.
Figure EV2 Assessment of the potential effects of membrane retraction and cell division on the localization of cytoplasmic probes in transition-phase cells. (A) Microscopy images of MitoTracker Green-labeled cells (CJW7324) expressing RplA-mCherry. The samples were obtained from cultures in either exponential or transition phase. Fluorescence intensities are indicated in arbitrary units (a.u.). Signal intensity profiles are provided for the cells indicated by asterisks. White arrowheads show the depletion of RplA-mCherry signal at a cell pole. (B) Representative microscopy images of DAPI-stained FtsZ-depleted cells (CJW7588) expressing cytoplasmic msfGFP in transition phase in M9gluCAAT supplemented with 0.4% arabinose to induce the CRISPRi system, thereby blocking the expression of ftsZ. The corresponding signal intensity profile is shown below. Scale bar: 5 µm. Source data are available online for this figure.CC BY · PubMed Central
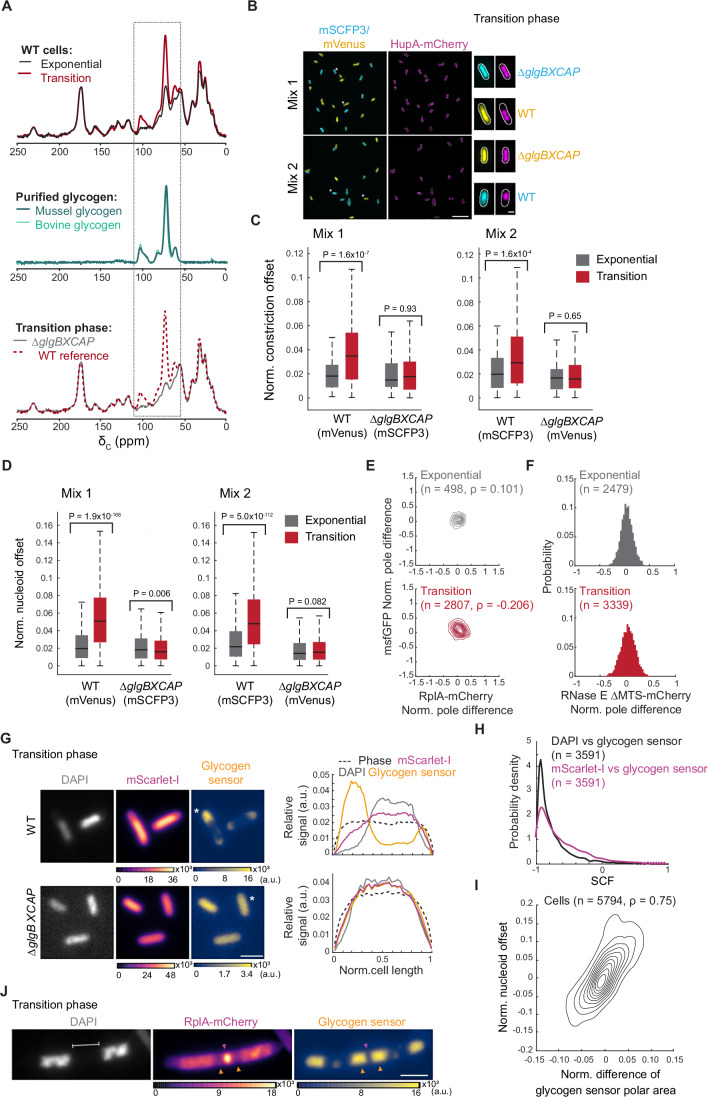
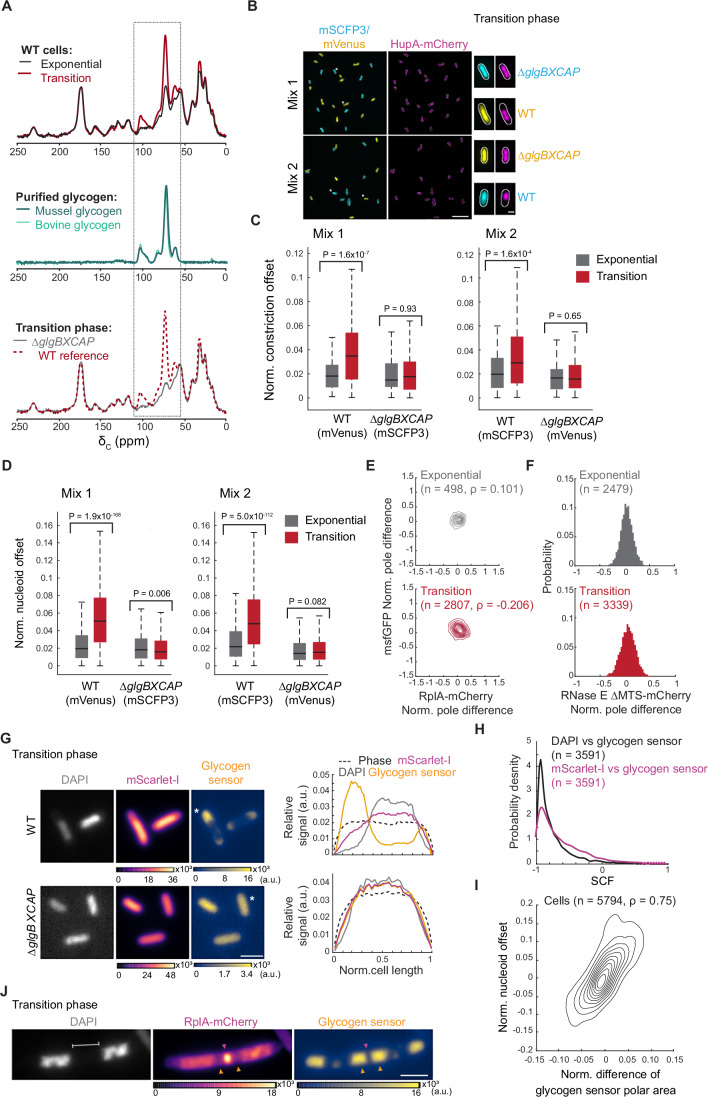
Figure 3 Glycogen accumulation in the transition phase drives intracellular rearrangement. (A) Representative relative whole-cell 13C CPMAS spectral overlays of WT cell extracts (strain CJW2168) from cultures in exponential vs. transition phase (top), purified bovine and mussel glycogen (middle), and WT vs. ∆glgBXCAP (CJW7537) cell extracts from transition-phase cultures (bottom). The dashed rectangle marks the sugar carbon region of the spectrum. (B) Representative fields of view of fluorescence images showing cells from co-cultures in the transition phase. The top two fields of view show glycogen-producing cells (CJW7666) expressing mVenus and HupA-mCherry mixed with glycogen-devoid cells (CJW7667) expressing mSCFP3 and HupA-mCherry (Mix 1). The bottom fields of view illustrate glycogen-producing cells (CJW7665) expressing mSCFP3 and HupA-mCherry mixed with glycogen-devoid cells (CJW7668) expressing mVenus and HupA-mCherry (Mix 2). Scale bar: 10 µm. On the right side of the fields of view, the images of single cells (indicated by the single or double asterisks) show examples of the localization of mVenus (yellow), mSCFP3 (cyan), and HupA-mCherry (purple) for the relevant strain. Scale bar: 1 µm. (C) Boxplots showing the normalized (norm.) offset of the cell constriction site of the co-cultured WT and ∆glgBXCAP cells carrying either mVenus or mSCFP3 in exponential and transition phases. The horizontal lines in the boxes correspond to the medians, with the bottom and top of the boxes showing the 25th and 75th percentiles, respectively. The endpoints of the whiskers mark the minimum and maximum values within a range that excludes the outliers. Outlier values are defined as those more than 1.5 times the interquartile range away from the bottom or top of the boxes. The results shown correspond to the first replicate for Mix 1 and Mix 2. The results for two other biological replicates of each mix are shown in Fig. EV3. The indicated P values were obtained using a two-sided Wilcoxon rank sum test. (D) Same as (C) but for the normalized nucleoid position offset. The second and third biological replicates of Mix 1 and Mix 2 are shown in Fig. EV4. (E) Contour plots showing the normalized (Norm.) pole differences of msfGFP vs. the normalized pole differences of RplA-mCherry for exponential (top, OD = 0.065, n = 498) and transition-phase (bottom, OD = 1.2, n = 2807) cells of the glycogen-deficient strain ∆glgBXCAP (CJW7878). The normalized pole difference of a fluorescent signal corresponds to the difference in this signal between pole regions divided by the average signal intensity across the cell. The contour lines represent the 0.167, 0.33, 0.5, 0.66, 0.83, and 1 kernel density envelopes of the data. (F) Histograms of the normalized pole difference of RNase E ∆MTS-mCherry for cells (strain CJW7877) in exponential (OD = 0.07, n = 2479) or transition (OD = 0.82, n = 3339) phase. (G) Representative images of WT (CJW7606) and ∆glgBXCAP (CJW7607) cells in transition phase (OD 2.7) labeled with DAPI and expressing mScarlet-I and the glycogen sensor, along with the signal intensity profiles for the indicated (*) cells. Fluorescence intensities are indicated in arbitrary units (a.u.). Scale bar: 2 µm. (H) Distributions of SCF values of the glycogen sensor vs. DAPI or mScarlet-I for glycogen-producing cells (n = 3591, CJW7606 in transition phase. (I) Density contour plot showing the area difference of the glycogen sensor signal between the cell poles (normalized by the cell area) vs. the nucleoid position asymmetry in CJW7606 cells (n = 5794). The latter was calculated by determining the offset of the nucleoid mid-point from the cell center, normalized to the cell length. The contour lines represent the 0.10, 0.2, 0.3, 0.4, 0.50, 0.6, 0.7, 0.8, and 0.9 probability envelopes of the data. Spearman correlation coefficient (ρ) is 0.748 (P value = 0). (J) Example phase-contrast and fluorescence images of a DAPI-labeled CJW7606 cell carrying RplA-mCherry and the glycogen sensor. The cell was from a culture in transition phase following cephalexin treatment. Gray bracket indicates DNA-free region where glycogen accumulation (orange arrowheads) sandwiches a band of RplA-mCherry enrichment (purple arrowhead). Scale bar: 2 µm. Source data are available online for this figure.
Figure 3 Glycogen accumulation in the transition phase drives intracellular rearrangement. (A) Representative relative whole-cell 13C CPMAS spectral overlays of WT cell extracts (strain CJW2168) from cultures in exponential vs. transition phase (top), purified bovine and mussel glycogen (middle), and WT vs. ∆glgBXCAP (CJW7537) cell extracts from transition-phase cultures (bottom). The dashed rectangle marks the sugar carbon region of the spectrum. (B) Representative fields of view of fluorescence images showing cells from co-cultures in the transition phase. The top two fields of view show glycogen-producing cells (CJW7666) expressing mVenus and HupA-mCherry mixed with glycogen-devoid cells (CJW7667) expressing mSCFP3 and HupA-mCherry (Mix 1). The bottom fields of view illustrate glycogen-producing cells (CJW7665) expressing mSCFP3 and HupA-mCherry mixed with glycogen-devoid cells (CJW7668) expressing mVenus and HupA-mCherry (Mix 2). Scale bar: 10 µm. On the right side of the fields of view, the images of single cells (indicated by the single or double asterisks) show examples of the localization of mVenus (yellow), mSCFP3 (cyan), and HupA-mCherry (purple) for the relevant strain. Scale bar: 1 µm. (C) Boxplots showing the normalized (norm.) offset of the cell constriction site of the co-cultured WT and ∆glgBXCAP cells carrying either mVenus or mSCFP3 in exponential and transition phases. The horizontal lines in the boxes correspond to the medians, with the bottom and top of the boxes showing the 25th and 75th percentiles, respectively. The endpoints of the whiskers mark the minimum and maximum values within a range that excludes the outliers. Outlier values are defined as those more than 1.5 times the interquartile range away from the bottom or top of the boxes. The results shown correspond to the first replicate for Mix 1 and Mix 2. The results for two other biological replicates of each mix are shown in Fig. EV3. The indicated P values were obtained using a two-sided Wilcoxon rank sum test. (D) Same as (C) but for the normalized nucleoid position offset. The second and third biological replicates of Mix 1 and Mix 2 are shown in Fig. EV4. (E) Contour plots showing the normalized (Norm.) pole differences of msfGFP vs. the normalized pole differences of RplA-mCherry for exponential (top, OD = 0.065, n = 498) and transition-phase (bottom, OD = 1.2, n = 2807) cells of the glycogen-deficient strain ∆glgBXCAP (CJW7878). The normalized pole difference of a fluorescent signal corresponds to the difference in this signal between pole regions divided by the average signal intensity across the cell. The contour lines represent the 0.167, 0.33, 0.5, 0.66, 0.83, and 1 kernel density envelopes of the data. (F) Histograms of the normalized pole difference of RNase E ∆MTS-mCherry for cells (strain CJW7877) in exponential (OD = 0.07, n = 2479) or transition (OD = 0.82, n = 3339) phase. (G) Representative images of WT (CJW7606) and ∆glgBXCAP (CJW7607) cells in transition phase (OD 2.7) labeled with DAPI and expressing mScarlet-I and the glycogen sensor, along with the signal intensity profiles for the indicated (*) cells. Fluorescence intensities are indicated in arbitrary units (a.u.). Scale bar: 2 µm. (H) Distributions of SCF values of the glycogen sensor vs. DAPI or mScarlet-I for glycogen-producing cells (n = 3591, CJW7606 in transition phase. (I) Density contour plot showing the area difference of the glycogen sensor signal between the cell poles (normalized by the cell area) vs. the nucleoid position asymmetry in CJW7606 cells (n = 5794). The latter was calculated by determining the offset of the nucleoid mid-point from the cell center, normalized to the cell length. The contour lines represent the 0.10, 0.2, 0.3, 0.4, 0.50, 0.6, 0.7, 0.8, and 0.9 probability envelopes of the data. Spearman correlation coefficient (ρ) is 0.748 (P value = 0). (J) Example phase-contrast and fluorescence images of a DAPI-labeled CJW7606 cell carrying RplA-mCherry and the glycogen sensor. The cell was from a culture in transition phase following cephalexin treatment. Gray bracket indicates DNA-free region where glycogen accumulation (orange arrowheads) sandwiches a band of RplA-mCherry enrichment (purple arrowhead). Scale bar: 2 µm. Source data are available online for this figure.CC BY · PubMed Central
Figure EV3 Normalized constriction offset measurements for the WT and ∆glgBXCAP cells from co-culture experiments. Boxplots of the normalized constriction offset in exponential and transition phases for the biological replicates of the co-culture experiments shown in Fig. 3C. The horizontal lines in the boxes correspond to the medians, with the bottom and top of the boxes showing the 25th and 75th percentiles, respectively. The endpoints of the whiskers mark the minimum and maximum values within a range that excludes the outliers. Outlier values are defined as those more than 1.5 times the interquartile range away from the bottom or top of the boxes. The indicated P values were obtained using a two-sided Wilcoxon rank sum test. Source data are available online for this figure.
Figure EV3 Normalized constriction offset measurements for the WT and ∆glgBXCAP cells from co-culture experiments. Boxplots of the normalized constriction offset in exponential and transition phases for the biological replicates of the co-culture experiments shown in Fig. 3C. The horizontal lines in the boxes correspond to the medians, with the bottom and top of the boxes showing the 25th and 75th percentiles, respectively. The endpoints of the whiskers mark the minimum and maximum values within a range that excludes the outliers. Outlier values are defined as those more than 1.5 times the interquartile range away from the bottom or top of the boxes. The indicated P values were obtained using a two-sided Wilcoxon rank sum test. Source data are available online for this figure.CC BY · PubMed Central
Figure EV4 Normalized nucleoid offset measurements for the WT and ∆glgBXCAP cells from the co-culture experiments across different growth phases. Boxplots of the normalized nucleoid offset in exponential, transition, early stationary (24 h), and late stationary phase (72 h) for all the biological replicates of the co-culture experiments. Exponential and transition phase datapoints for Replica 1 of both mixes are shown in Fig. 3D. The horizontal lines in the boxes correspond to the medians, with the bottom and top of the boxes showing the 25th and 75th percentiles, respectively. The endpoints of the whiskers mark the minimum and maximum values within a range that excludes the outliers. Outlier values are defined as those more than 1.5 times the interquartile range away from the bottom or top of the boxes. The indicated P values were obtained using a two-sided Wilcoxon rank-sum test. Source data are available online for this figure.
Figure EV4 Normalized nucleoid offset measurements for the WT and ∆glgBXCAP cells from the co-culture experiments across different growth phases. Boxplots of the normalized nucleoid offset in exponential, transition, early stationary (24 h), and late stationary phase (72 h) for all the biological replicates of the co-culture experiments. Exponential and transition phase datapoints for Replica 1 of both mixes are shown in Fig. 3D. The horizontal lines in the boxes correspond to the medians, with the bottom and top of the boxes showing the 25th and 75th percentiles, respectively. The endpoints of the whiskers mark the minimum and maximum values within a range that excludes the outliers. Outlier values are defined as those more than 1.5 times the interquartile range away from the bottom or top of the boxes. The indicated P values were obtained using a two-sided Wilcoxon rank-sum test. Source data are available online for this figure.CC BY · PubMed Central
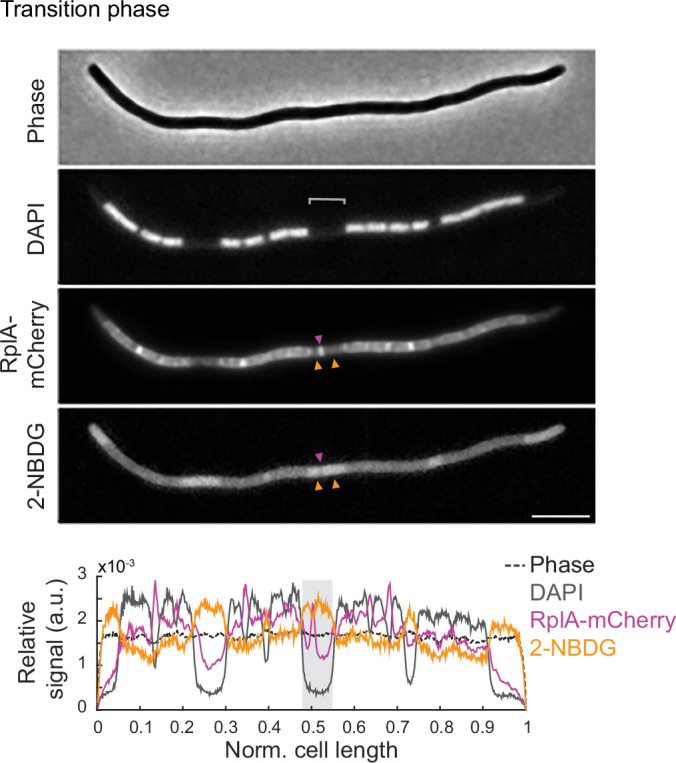
Figure EV5 Representative image of 2-NBDG incorporation in a filamentous polynucleoid cell in transition phase. Microscopy images of a cephalexin-treated cell (CJW7324) expressing RplA-mCherry in transition phase (OD ~ 2.0). Yellow arrowheads indicate accumulations of 2-NBDG that sandwich an accumulation of RplA-mCherry signal. Below is the cell signal intensity profile, with the gray shade highlighting the region of interest. Scale bar: 5 µm. Source data are available online for this figure.
Figure EV5 Representative image of 2-NBDG incorporation in a filamentous polynucleoid cell in transition phase. Microscopy images of a cephalexin-treated cell (CJW7324) expressing RplA-mCherry in transition phase (OD ~ 2.0). Yellow arrowheads indicate accumulations of 2-NBDG that sandwich an accumulation of RplA-mCherry signal. Below is the cell signal intensity profile, with the gray shade highlighting the region of interest. Scale bar: 5 µm. Source data are available online for this figure.CC BY · PubMed Central
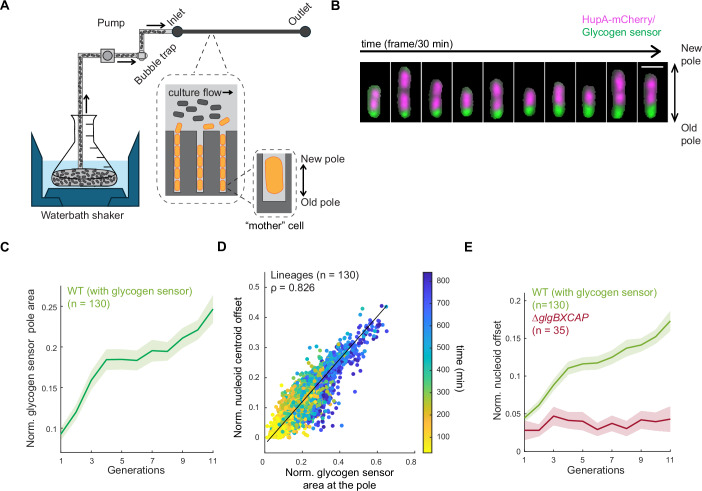
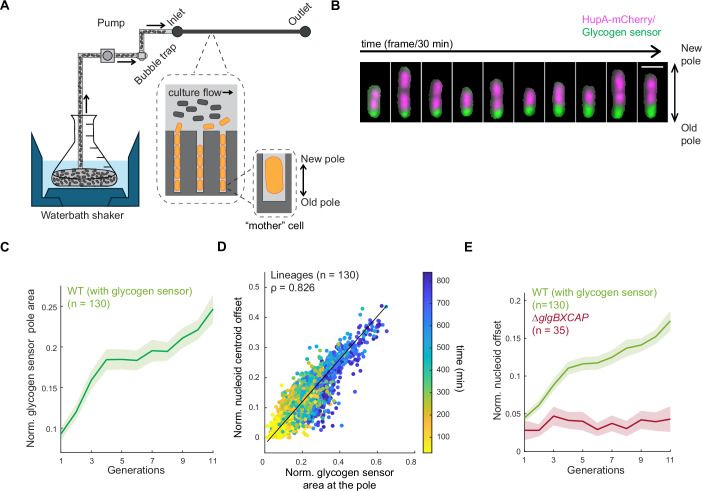
Figure 4 Preferential glycogen accumulation at the old cell pole through inheritance contributes to the asymmetry in nucleoid positioning. (A) Schematic of the setup used in the microfluidic experiment. A waterbath shaker is used to grow a batch culture with controlled temperature (30 °C) and shaking (200 rpm). Culture is first passed through a custom-built bubble trap and then through the microfluidics chip (mother machine) using a peristaltic pump. The large inset (dotted lines) shows a zoomed-in depiction of the microfluidic chip, with the culture flowing through the feeding channels and cells growing in the narrow trenches. The smaller inset shows an enlargement of the mother cell. (B) Montage of a representative mother cell lineage of CJW7605 showing the overlay between the HupA-mCherry and glycogen sensor signals. For clarity purposes, the mother cell was computationally extracted using its segmentation mask. Scale bar 2 µm. (C) Plot showing the normalized glycogen sensor pole area over all observed generations. The solid line represents the mean across all tracked cell lineages (n = 130), while the shaded area indicates the 95% confidence interval. (D) Scatter plot of the correlation between the normalized nucleoid offset and the normalized glycogen sensor pole area for all tracked lineages (n = 130) across all analyzed time points (color bar). Spearman correlation coefficient (ρ) is 0.826 (P value = 0). (E) Plot showing the normalized nucleoid offset as a function of cell generations for the glycogen WT strain (CJW7605, n = 130 lineages) and the glycogen-deficient (∆glgBXCAP) strain (CJW7668, n = 35 lineages). The solid lines represent the means across all tracked cell lineages, while the shaded areas indicate the 95% confidence interval. Source data are available online for this figure.
Figure 4 Preferential glycogen accumulation at the old cell pole through inheritance contributes to the asymmetry in nucleoid positioning. (A) Schematic of the setup used in the microfluidic experiment. A waterbath shaker is used to grow a batch culture with controlled temperature (30 °C) and shaking (200 rpm). Culture is first passed through a custom-built bubble trap and then through the microfluidics chip (mother machine) using a peristaltic pump. The large inset (dotted lines) shows a zoomed-in depiction of the microfluidic chip, with the culture flowing through the feeding channels and cells growing in the narrow trenches. The smaller inset shows an enlargement of the mother cell. (B) Montage of a representative mother cell lineage of CJW7605 showing the overlay between the HupA-mCherry and glycogen sensor signals. For clarity purposes, the mother cell was computationally extracted using its segmentation mask. Scale bar 2 µm. (C) Plot showing the normalized glycogen sensor pole area over all observed generations. The solid line represents the mean across all tracked cell lineages (n = 130), while the shaded area indicates the 95% confidence interval. (D) Scatter plot of the correlation between the normalized nucleoid offset and the normalized glycogen sensor pole area for all tracked lineages (n = 130) across all analyzed time points (color bar). Spearman correlation coefficient (ρ) is 0.826 (P value = 0). (E) Plot showing the normalized nucleoid offset as a function of cell generations for the glycogen WT strain (CJW7605, n = 130 lineages) and the glycogen-deficient (∆glgBXCAP) strain (CJW7668, n = 35 lineages). The solid lines represent the means across all tracked cell lineages, while the shaded areas indicate the 95% confidence interval. Source data are available online for this figure.CC BY · PubMed Central
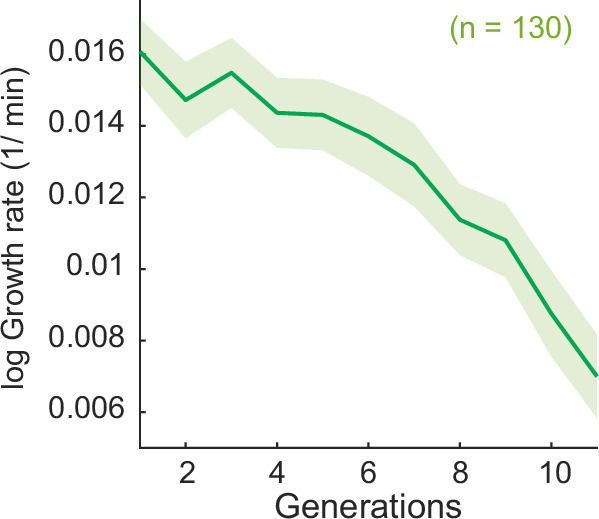
Figure EV6 Growth rate measurements in the microfluidic device. Plot of the calculated log growth rate as a function of cell generations for the strain CJW7605 (n = 130 lineages). The solid line and shaded region correspond to the average and the 95% confidence interval, respectively. Source data are available online for this figure.
Figure EV6 Growth rate measurements in the microfluidic device. Plot of the calculated log growth rate as a function of cell generations for the strain CJW7605 (n = 130 lineages). The solid line and shaded region correspond to the average and the 95% confidence interval, respectively. Source data are available online for this figure.CC BY · PubMed Central
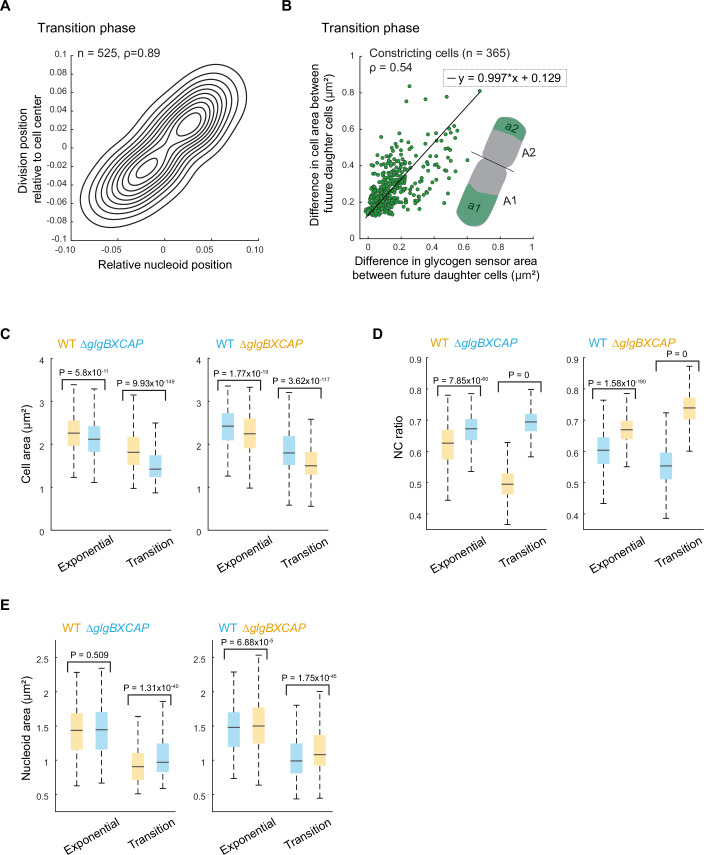
Figure 5 Asymmetry in glycogen accumulation creates cell size differences and asymmetric cell divisions. (A) Density contour plot of the relative division position as a function of the nucleoid centroid position in dividing cells for transition-phase cells (strain CJW7666, n = 525). The values + 0.5 and −0.5 represent the cell poles, while 0 corresponds to the cell center. Spearman correlation coefficient (ρ) for WT cells is 0.89 (P value = 0). (B) Scatter plot showing the difference in cell area and the difference in the area occupied by the glycogen sensor between future daughter cells (strain CJW7606). Constricting cells (n = 365) were computationally divided into two future daughter cells based on the cell constriction position (illustrated in the inset). Spearman correlation coefficient (ρ) is 0.54 (P value = 1.28 × 10⁻²⁷). (C) Boxplots showing the area of exponential and transition-phase cells from WT (CJW7665 and CJW7666) and ∆glgBXCAP (CJW7667 and CJW7668) cultures carrying either mVenus (yellow) or mSCFP3 (cyan). The horizontal lines in the boxes correspond to the medians, with the bottom and top of the boxes showing the 25th and 75th percentiles, respectively. The endpoints of the whiskers mark the minimum and maximum values within a range that excludes the outliers. Outlier values are defined as those more than 1.5 times the interquartile range away from the bottom or top of the boxes. The indicated P values were obtained using a two-sided Wilcoxon rank-sum test. The results shown correspond to the first replicate for Mix 1 and Mix 2. The results for two other biological replicates of each mix are shown in Fig. EV7. (D) Same as (C) but for the NC ratio. (E) Same as (C) but for the total nucleoid area. Source data are available online for this figure.
Figure 5 Asymmetry in glycogen accumulation creates cell size differences and asymmetric cell divisions. (A) Density contour plot of the relative division position as a function of the nucleoid centroid position in dividing cells for transition-phase cells (strain CJW7666, n = 525). The values + 0.5 and −0.5 represent the cell poles, while 0 corresponds to the cell center. Spearman correlation coefficient (ρ) for WT cells is 0.89 (P value = 0). (B) Scatter plot showing the difference in cell area and the difference in the area occupied by the glycogen sensor between future daughter cells (strain CJW7606). Constricting cells (n = 365) were computationally divided into two future daughter cells based on the cell constriction position (illustrated in the inset). Spearman correlation coefficient (ρ) is 0.54 (P value = 1.28 × 10⁻²⁷). (C) Boxplots showing the area of exponential and transition-phase cells from WT (CJW7665 and CJW7666) and ∆glgBXCAP (CJW7667 and CJW7668) cultures carrying either mVenus (yellow) or mSCFP3 (cyan). The horizontal lines in the boxes correspond to the medians, with the bottom and top of the boxes showing the 25th and 75th percentiles, respectively. The endpoints of the whiskers mark the minimum and maximum values within a range that excludes the outliers. Outlier values are defined as those more than 1.5 times the interquartile range away from the bottom or top of the boxes. The indicated P values were obtained using a two-sided Wilcoxon rank-sum test. The results shown correspond to the first replicate for Mix 1 and Mix 2. The results for two other biological replicates of each mix are shown in Fig. EV7. (D) Same as (C) but for the NC ratio. (E) Same as (C) but for the total nucleoid area. Source data are available online for this figure.CC BY · PubMed Central
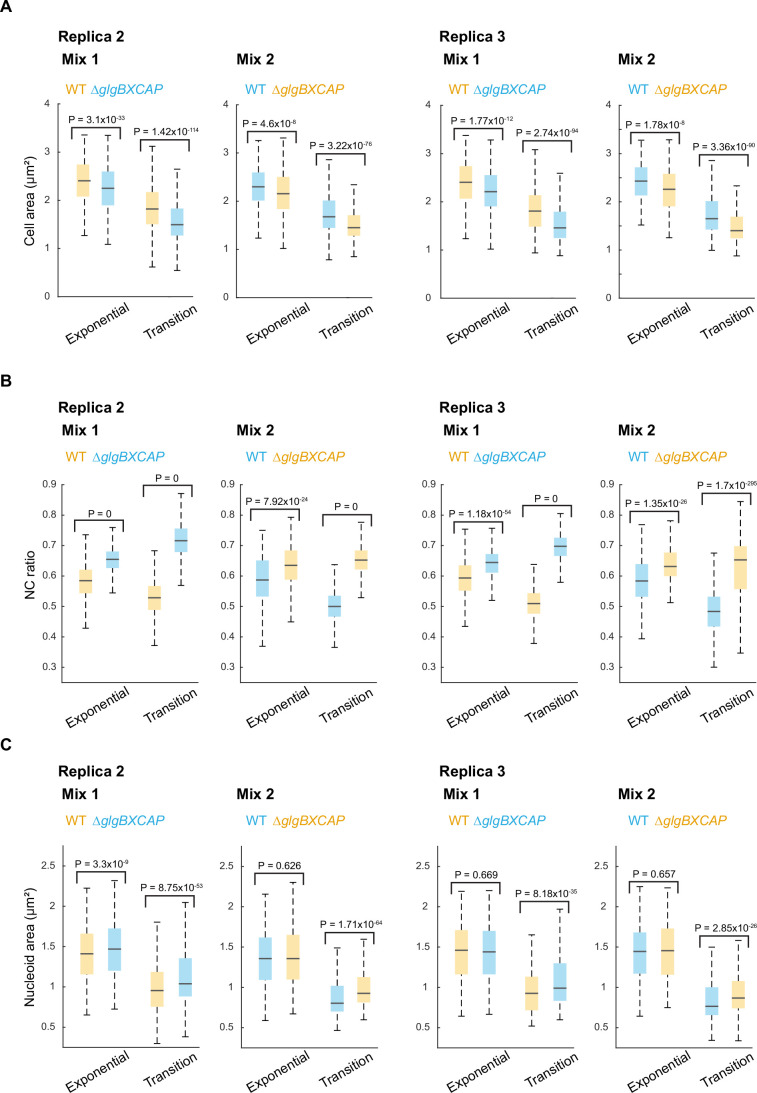
Figure EV7 Cell area, NC ratio and nucleoid area measurements for the WT and ∆glgBXCAP cells from co-culture experiments. (A) Boxplots of the cell area of exponential and transition-phase cells for the biological replicates of the co-culture experiments shown in Fig. 5. The horizontal lines in the boxes correspond to the medians, with the bottom and top of the boxes showing the 25th and 75th percentiles, respectively. The endpoints of the whiskers mark the minimum and maximum values within a range that excludes the outliers. Outlier values are defined as those more than 1.5 times the interquartile range away from the bottom or top of the boxes. The indicated P values were obtained using a two-sided Wilcoxon rank-sum test. (B) Same as (A) but for the NC ratio. (C) Same as (A) but for the total nucleoid area. Source data are available online for this figure.
Figure EV7 Cell area, NC ratio and nucleoid area measurements for the WT and ∆glgBXCAP cells from co-culture experiments. (A) Boxplots of the cell area of exponential and transition-phase cells for the biological replicates of the co-culture experiments shown in Fig. 5. The horizontal lines in the boxes correspond to the medians, with the bottom and top of the boxes showing the 25th and 75th percentiles, respectively. The endpoints of the whiskers mark the minimum and maximum values within a range that excludes the outliers. Outlier values are defined as those more than 1.5 times the interquartile range away from the bottom or top of the boxes. The indicated P values were obtained using a two-sided Wilcoxon rank-sum test. (B) Same as (A) but for the NC ratio. (C) Same as (A) but for the total nucleoid area. Source data are available online for this figure.CC BY · PubMed Central
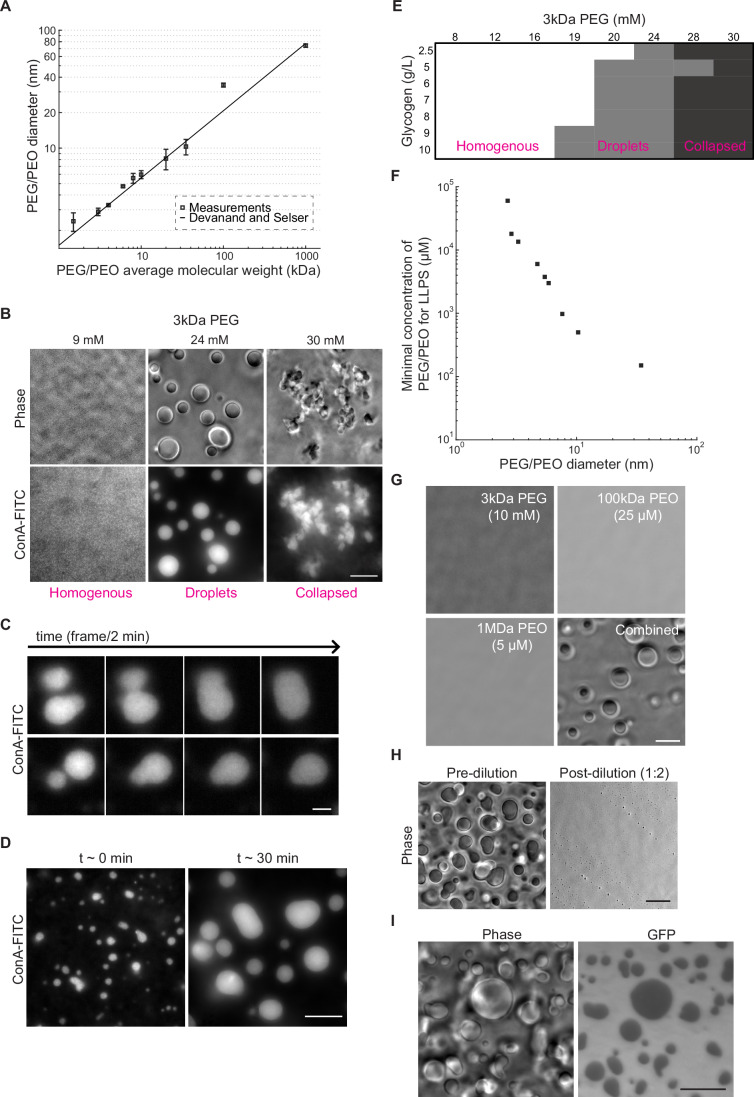
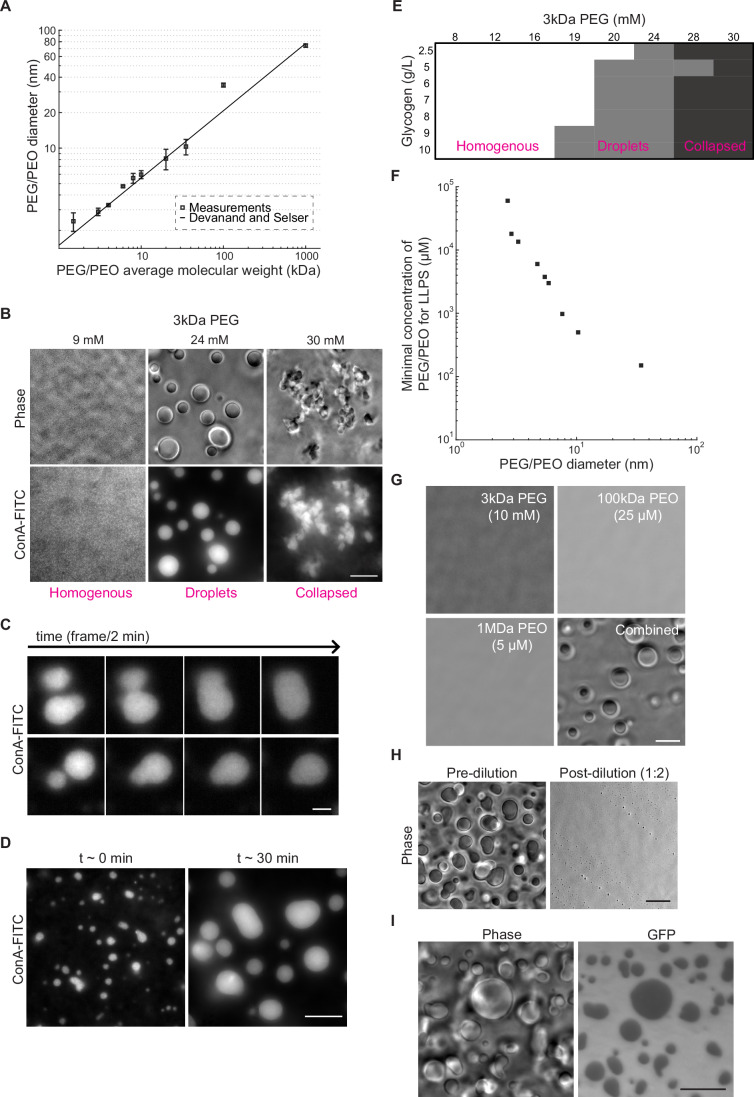
Figure 6 Mimicking intracellular conditions of crowding and ionic strength induces phase transition of glycogen into liquid condensates that partially exclude GFP. (A) Plot showing dynamic light scattering (DLS) measurements of the particle diameter size for PEG and PEO polymers of different molecular weights in IS buffer. Samples were measured in triplicate (technical replicates) for 300 s at 25 °C with a 90-degree detection angle. The line indicates the empirical relation (hydrodynamic diameter (σPEG/PEO) = 0.029*MWPEG/PEO(0.571±0.009)) determined by Devanand and Selser (1991). Error bars represent the standard error of the mean. (B) Phase-contrast and ConA-FITC fluorescence images of representative fields of view showing a homogeneous distribution of glycogen (left), glycogen droplets (center), and collapsed glycogen aggregates (right) obtained with the indicated concentrations of 3 kDa PEG. All samples were made using the IS buffer and contained 9 g/L of glycogen. Scale bar: 10 µm. (C) Example montages of glycogen condensates labeled with ConA-FITC undergoing fusion events over time. The samples contained 9 g/L of glycogen and 8 kDa PEG (3 mM) in IS buffer. After mixing with the crowder, the samples were immediately spotted in the glass-bottom dish and imaged for a total of 7 min. Scale bar: 3 µm. (D) Fluorescence images of ConA-FITC-labeled glycogen condensates imaged at t ~ 3 min and t ~ 30 min after the addition of 3 kDa PEG (24 mM). The samples contained 9 g/L of glycogen in IS buffer. The Samples were imaged immediately after spotting in the glass-bottom dish. Scale bar: 10 µm. (E) Phase diagram of glycogen phases as a function of glycogen and 3 kDa PEG concentrations. Samples were imaged immediately after mixing with the appropriate amount of crowder. Each data point was evaluated two to three times in independent experiments to determine consensus classification based on visual inspection. (F) Plot showing the minimal concentration required to drive droplet formation as a function of the average Stokes diameters for all tested PEG/PEO crowders. Phase separation was determined by assessing the formation of droplets using phase-contrast imaging. The average diameter for each PEG/PEO crowder corresponds to the measurements shown in (A). (G) Phase-contrast images of representative fields of view of glycogen (10 g/L) in IS buffer mixed with the indicated concentration and molecular weight of PEG or PEO (separately or combined). Scale bar: 10 µm. (H) Phase-contrast images of glycogen (10 g/L) and 3 kDa PEG (20 mM) mixtures in IS buffer before and after a two-fold dilution. For both conditions, imaging was performed within 1 min after mixing. Scale bar: 10 µm. (I) Phase-contrast and GFP images of a representative field of view of glycogen (10 g/L) in IS buffer mixed with GFP (15 µM) and 3 kDa PEG (20 mM). Scale bar: 10 µm. Source data are available online for this figure.
Figure 6 Mimicking intracellular conditions of crowding and ionic strength induces phase transition of glycogen into liquid condensates that partially exclude GFP. (A) Plot showing dynamic light scattering (DLS) measurements of the particle diameter size for PEG and PEO polymers of different molecular weights in IS buffer. Samples were measured in triplicate (technical replicates) for 300 s at 25 °C with a 90-degree detection angle. The line indicates the empirical relation (hydrodynamic diameter (σPEG/PEO) = 0.029*MWPEG/PEO(0.571±0.009)) determined by Devanand and Selser (1991). Error bars represent the standard error of the mean. (B) Phase-contrast and ConA-FITC fluorescence images of representative fields of view showing a homogeneous distribution of glycogen (left), glycogen droplets (center), and collapsed glycogen aggregates (right) obtained with the indicated concentrations of 3 kDa PEG. All samples were made using the IS buffer and contained 9 g/L of glycogen. Scale bar: 10 µm. (C) Example montages of glycogen condensates labeled with ConA-FITC undergoing fusion events over time. The samples contained 9 g/L of glycogen and 8 kDa PEG (3 mM) in IS buffer. After mixing with the crowder, the samples were immediately spotted in the glass-bottom dish and imaged for a total of 7 min. Scale bar: 3 µm. (D) Fluorescence images of ConA-FITC-labeled glycogen condensates imaged at t ~ 3 min and t ~ 30 min after the addition of 3 kDa PEG (24 mM). The samples contained 9 g/L of glycogen in IS buffer. The Samples were imaged immediately after spotting in the glass-bottom dish. Scale bar: 10 µm. (E) Phase diagram of glycogen phases as a function of glycogen and 3 kDa PEG concentrations. Samples were imaged immediately after mixing with the appropriate amount of crowder. Each data point was evaluated two to three times in independent experiments to determine consensus classification based on visual inspection. (F) Plot showing the minimal concentration required to drive droplet formation as a function of the average Stokes diameters for all tested PEG/PEO crowders. Phase separation was determined by assessing the formation of droplets using phase-contrast imaging. The average diameter for each PEG/PEO crowder corresponds to the measurements shown in (A). (G) Phase-contrast images of representative fields of view of glycogen (10 g/L) in IS buffer mixed with the indicated concentration and molecular weight of PEG or PEO (separately or combined). Scale bar: 10 µm. (H) Phase-contrast images of glycogen (10 g/L) and 3 kDa PEG (20 mM) mixtures in IS buffer before and after a two-fold dilution. For both conditions, imaging was performed within 1 min after mixing. Scale bar: 10 µm. (I) Phase-contrast and GFP images of a representative field of view of glycogen (10 g/L) in IS buffer mixed with GFP (15 µM) and 3 kDa PEG (20 mM). Scale bar: 10 µm. Source data are available online for this figure.CC BY · PubMed Central
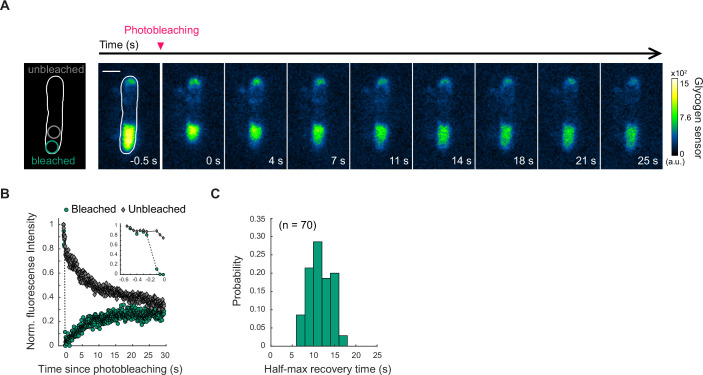
Figure EV8 FRAP measurements of the fluorescent glycogen sensor dynamics in glycogen-producing cells in transition phase. (A) Time-lapse images of a glycogen-producing cell in transition phase before and after photobleaching a region of the cell pole with the larger glycogen sensor accumulation. The first image on the left shows the time frame before photobleaching, while the subsequent images represent frames captured after photobleaching at the indicated time. The schematic shows the region that was photobleached. Scale bar: 1 µm. (B) Plot showing the evolution of the normalized fluorescence intensity of the glycogen sensor for the unbleached region and the photobleached region of the cell shown in (A), before and after photobleaching. The inset shows the data before and during photobleaching. (C) Histogram of the half-max fluorescence recovery times calculated for 70 cells in which FRAP measurements were obtained. Source data are available online for this figure.
Figure EV8 FRAP measurements of the fluorescent glycogen sensor dynamics in glycogen-producing cells in transition phase. (A) Time-lapse images of a glycogen-producing cell in transition phase before and after photobleaching a region of the cell pole with the larger glycogen sensor accumulation. The first image on the left shows the time frame before photobleaching, while the subsequent images represent frames captured after photobleaching at the indicated time. The schematic shows the region that was photobleached. Scale bar: 1 µm. (B) Plot showing the evolution of the normalized fluorescence intensity of the glycogen sensor for the unbleached region and the photobleached region of the cell shown in (A), before and after photobleaching. The inset shows the data before and during photobleaching. (C) Histogram of the half-max fluorescence recovery times calculated for 70 cells in which FRAP measurements were obtained. Source data are available online for this figure.CC BY · PubMed Central
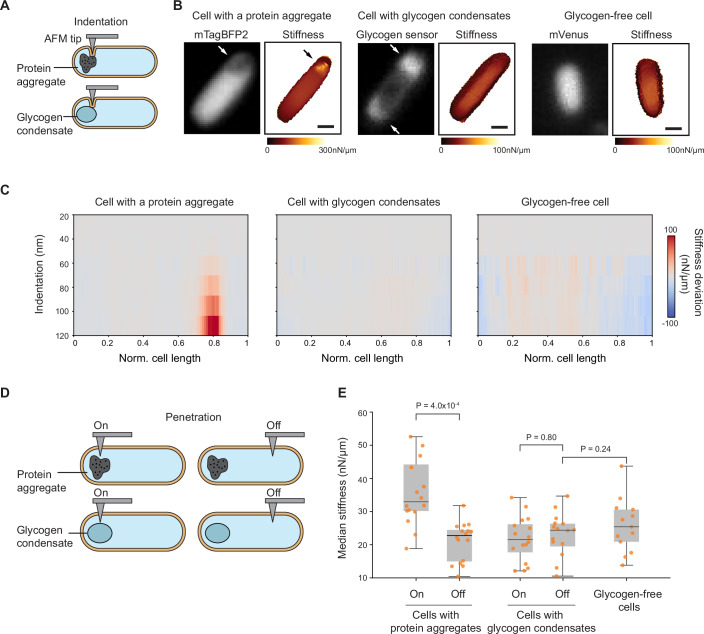
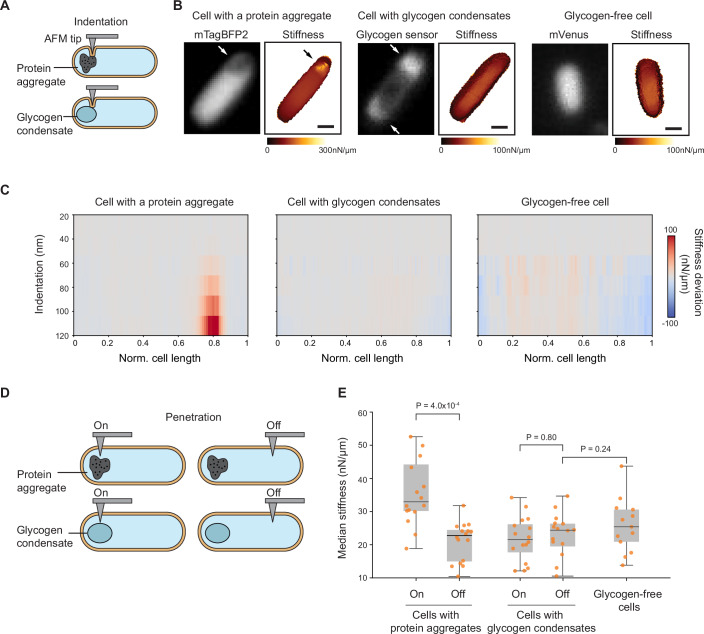
Figure 7 Intracellular regions containing glycogen condensates are softer than those with protein aggregates and are comparable in stiffness to other cytoplasmic regions. AFM experiments were performed on cells from three strains co-cultured to the transition phase (ODs ranging between 1.5 and 1.7): CJW7798 overexpressing mTagBFP2 and accumulating protein aggregates at a cell pole, CJW7605 expressing the glycogen sensor to visualize glycogen condensates, and CJW7668 (ΔglgBXCAP) carrying free mVenus. (A) Schematic of indentation-based subsurface AFM imaging with a cell containing a protein aggregate or a glycogen condensate. (B) Two-dimensional depth-resolved stiffness maps (right) with the correlated fluorescence images (left) showing stiffness distributions for a representative cell with a protein aggregate, a cell with accumulations of the fluorescent glycogen sensor (white arrows), or a cell without glycogen. Scale bar: 500 nm. (C) Stiffness tomography showing the distribution of stiffness deviations along the indentation depth of cells with either a protein aggregate, glycogen condensates, or without glycogen. The stiffness deviation is the difference in stiffness between the stiffness value at each location and the median stiffness value across the cell length at the same indentation depth. Gray means no deviation. (D) Schematic illustrating penetration-based stiffness measurements at targeted regions containing protein aggregates or glycogen condensates (labeled “On”) and at regions away from them (labeled “Off”). (E) Plot showing the median stiffness of “On” and “Off” intracellular regions of either cells (n = 15) containing protein aggregates or cells (n = 16) with glycogen condensates, compared to cytoplasmic regions of glycogen-free cells (n = 13). In the boxplots, the central line in the box indicates the median (50th percentile), the bounds of the box represent the 25th and 75th percentiles (interquartile range), and the whiskers extend to the minimum and maximum values of a range that excludes the outliers. Outlier values are defined as those more than 1.5 times the interquartile range away from the bottom or top of the boxes. Each dot represents the median stiffness of an individual cell obtained from 64 puncturing events (technical replicates). Data were collected over three independent experiments (biological replicates) with an average of about five cells per replicate. Source data are available online for this figure.
Figure 7 Intracellular regions containing glycogen condensates are softer than those with protein aggregates and are comparable in stiffness to other cytoplasmic regions. AFM experiments were performed on cells from three strains co-cultured to the transition phase (ODs ranging between 1.5 and 1.7): CJW7798 overexpressing mTagBFP2 and accumulating protein aggregates at a cell pole, CJW7605 expressing the glycogen sensor to visualize glycogen condensates, and CJW7668 (ΔglgBXCAP) carrying free mVenus. (A) Schematic of indentation-based subsurface AFM imaging with a cell containing a protein aggregate or a glycogen condensate. (B) Two-dimensional depth-resolved stiffness maps (right) with the correlated fluorescence images (left) showing stiffness distributions for a representative cell with a protein aggregate, a cell with accumulations of the fluorescent glycogen sensor (white arrows), or a cell without glycogen. Scale bar: 500 nm. (C) Stiffness tomography showing the distribution of stiffness deviations along the indentation depth of cells with either a protein aggregate, glycogen condensates, or without glycogen. The stiffness deviation is the difference in stiffness between the stiffness value at each location and the median stiffness value across the cell length at the same indentation depth. Gray means no deviation. (D) Schematic illustrating penetration-based stiffness measurements at targeted regions containing protein aggregates or glycogen condensates (labeled “On”) and at regions away from them (labeled “Off”). (E) Plot showing the median stiffness of “On” and “Off” intracellular regions of either cells (n = 15) containing protein aggregates or cells (n = 16) with glycogen condensates, compared to cytoplasmic regions of glycogen-free cells (n = 13). In the boxplots, the central line in the box indicates the median (50th percentile), the bounds of the box represent the 25th and 75th percentiles (interquartile range), and the whiskers extend to the minimum and maximum values of a range that excludes the outliers. Outlier values are defined as those more than 1.5 times the interquartile range away from the bottom or top of the boxes. Each dot represents the median stiffness of an individual cell obtained from 64 puncturing events (technical replicates). Data were collected over three independent experiments (biological replicates) with an average of about five cells per replicate. Source data are available online for this figure.CC BY · PubMed Central
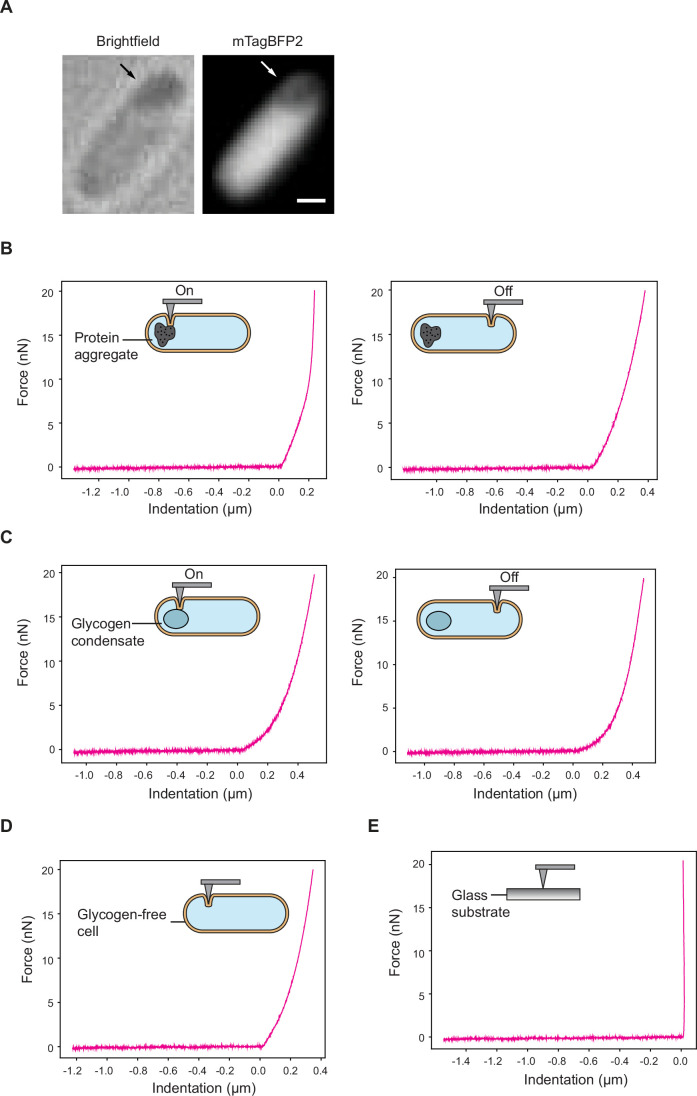
Figure EV9 Force-distance curve examples of indentation-based AFM experiments. The experimental conditions and strains are the same as in Fig. 7A–C. (A) Brightfield image of the protein aggregate-containing cell illustrated in Fig. 7B. The accompanying fluorescence image, which is a duplication of the image in Fig. 7B, is shown for comparison. (B) Representative force-distance curves of a cell at regions “On” and “Off” the protein aggregates. (C) Same as (A) but for a cell with glycogen condensates. (D) Same as (A) but for a glycogen-free cell. (E) Representative force-distance curve on the glass substrate is shown as a control. Source data are available online for this figure.
Figure EV9 Force-distance curve examples of indentation-based AFM experiments. The experimental conditions and strains are the same as in Fig. 7A–C. (A) Brightfield image of the protein aggregate-containing cell illustrated in Fig. 7B. The accompanying fluorescence image, which is a duplication of the image in Fig. 7B, is shown for comparison. (B) Representative force-distance curves of a cell at regions “On” and “Off” the protein aggregates. (C) Same as (A) but for a cell with glycogen condensates. (D) Same as (A) but for a glycogen-free cell. (E) Representative force-distance curve on the glass substrate is shown as a control. Source data are available online for this figure.CC BY · PubMed Central
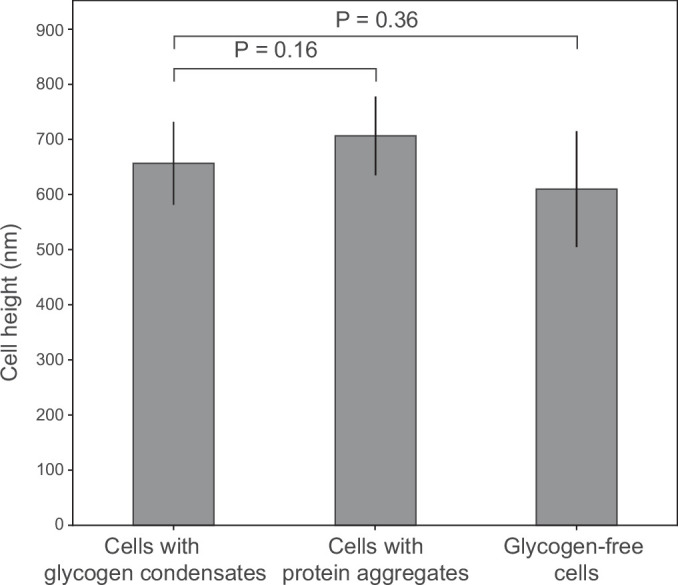
Figure EV10 Cell height measurements by AFM microscopy. The experimental conditions and strains are the same as in Fig. 7A–C. Plot showing cell height measurements of 21 cells with protein aggregates, 7 cells with glycogen condensates, and 7 cells without glycogen. The cell height information was analyzed from AFM height images collected from more than three biological replicates. Displayed here are the mean values ± the standard deviations. Statistical comparisons were performed using an unpaired two-tailed Student’s t test. Source data are available online for this figure.
Figure EV10 Cell height measurements by AFM microscopy. The experimental conditions and strains are the same as in Fig. 7A–C. Plot showing cell height measurements of 21 cells with protein aggregates, 7 cells with glycogen condensates, and 7 cells without glycogen. The cell height information was analyzed from AFM height images collected from more than three biological replicates. Displayed here are the mean values ± the standard deviations. Statistical comparisons were performed using an unpaired two-tailed Student’s t test. Source data are available online for this figure.CC BY · PubMed Central
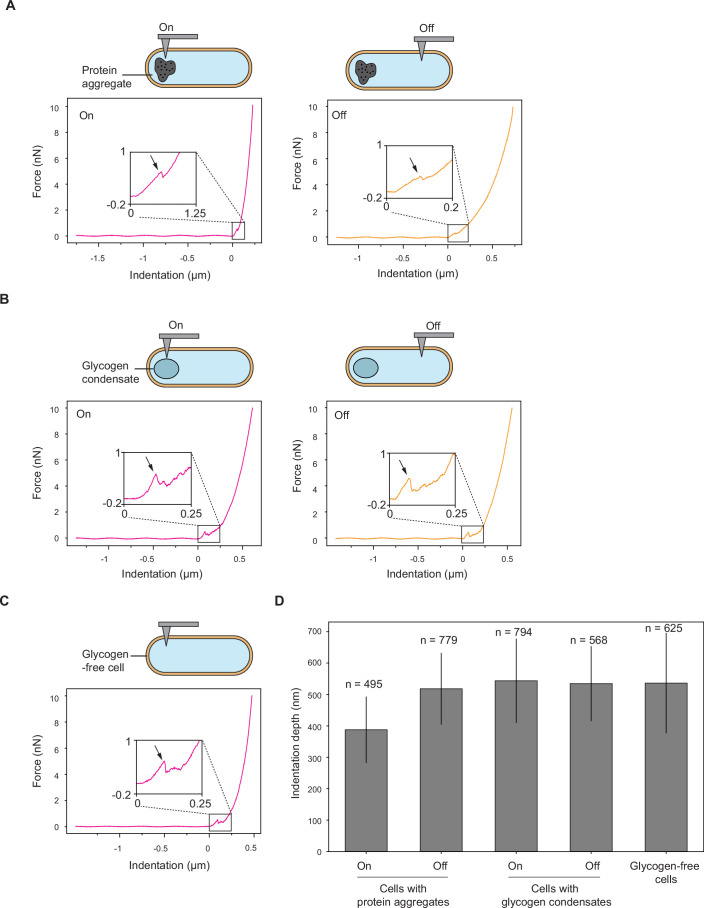
Figure EV11 Force-distance curve examples of penetration-based experiments. The experimental conditions and strains are the same as in Fig. 7D,E. Representative force-distance curves showing membrane puncture events (indicated by the arrow) in the figure inset. (A) Representative force-distance curves of a cell at regions “On” and “Off” the protein aggregates. (B) Same as (A) but for a cell with glycogen condensates. (C) Same as (A) but for a glycogen-free cell. (D) Plot showing the indentation depth distributions of 15 cells with protein aggregates, 16 cells with glycogen condensates, and 13 cells without glycogen. Shown are the mean values ± the standard deviations for the total number of indentation events (technical replicates) indicated by the n value. The indentation events were collected from more than three biological replicates. Source data are available online for this figure.
Figure EV11 Force-distance curve examples of penetration-based experiments. The experimental conditions and strains are the same as in Fig. 7D,E. Representative force-distance curves showing membrane puncture events (indicated by the arrow) in the figure inset. (A) Representative force-distance curves of a cell at regions “On” and “Off” the protein aggregates. (B) Same as (A) but for a cell with glycogen condensates. (C) Same as (A) but for a glycogen-free cell. (D) Plot showing the indentation depth distributions of 15 cells with protein aggregates, 16 cells with glycogen condensates, and 13 cells without glycogen. Shown are the mean values ± the standard deviations for the total number of indentation events (technical replicates) indicated by the n value. The indentation events were collected from more than three biological replicates. Source data are available online for this figure.CC BY · PubMed Central

Verification

Claims the paper makes

The claims and statistics of this paper haven’t been checked yet.

Run the check — free, no account needed. It reads the open-access text and checks the sources it cites.

A few free checks a day · papers already verified open instantly · results are public

Self-check

Percentages, sums and reported differences re-computed from the paper’s own numbers.

The self-check needs the paper’s full text.

Citations

Cites

Research works printed but not linked: 138

  1. 10.1128/jb.177.23.6791-6797.1995 · DOI
  2. 10.1128/JB.162.1.413-419.1985 · DOI
  3. 10.1016/j.cell.2018.12.035 · DOI · Paper page
  4. 10.1038/s41580-020-00326-6 · DOI
  5. 10.1016/j.jmb.2018.06.038 · DOI
  6. 10.1007/s11274-015-1983-2 · DOI
  7. Almagro G , Viale AM , Montero M , Rahimpour M , Muñoz FJ , Baroja-Fernández E , Bahaji A , Zúñiga M , González-Candelas F & Pozueta-Romero J (2015) Comparative genomic and phylogenetic analyses of gammaproteobacterial glg genes traced the origin of the Escherichia coli glycogen glgBXCAP operon to the last common ancestor of the sister orders Enterobacteriales and Pasteurellales. PLoS One 10 · DOI
  8. 10.1128/JB.01566-05 · DOI
  9. 10.1038/s41467-022-35677-5 · DOI · Paper page
  10. 10.1063/1.1740347 · DOI
  11. 10.1002/pol.1958.1203312618 · DOI
  12. 10.1016/j.bpj.2020.09.023 · DOI
  13. 10.1046/j.1365-2443.2000.00350.x · DOI
  14. 10.1128/JB.00957-12 · DOI
  15. 10.1111/mmi.12805 · DOI
  16. 10.1038/s41564-021-00900-4 · DOI
  17. 10.1111/j.1365-2958.2012.08081.x · DOI · Paper page
  18. 10.1007/s002030050248 · DOI
  19. 10.1038/nmeth.4509 · DOI
  20. 10.1038/nrm.2017.7 · DOI
  21. 10.1016/j.cell.2005.04.013 · DOI
  22. 10.1038/259406a0 · DOI
  23. 10.1063/1.470372 · DOI
  24. 2018, Spatial Structure of Glycogen Molecules in Cells, Biochemistry (Moscow), 83, 467, 10.1134/S0006297918050012 · DOI
  25. Boehm A , Arnoldini M , Bergmiller T , Röösli T , Bigosch C & Ackermann M (2016) Genetic Manipulation of Glycogen Allocation Affects Replicative Lifespan in E. coli. PLoS Genet 12 · DOI
  26. 10.1016/j.tcb.2018.02.004 · DOI
  27. 10.1111/j.1365-2958.2009.06629.x · DOI
  28. 10.1016/j.cell.2008.11.016 · DOI · Paper page
  29. Bremer H & Dennis PP (2008) Modulation of Chemical Composition and Other Parameters of the Cell at Different Exponential Growth Rates. EcoSal Plus 3 · DOI · Paper page
  30. 10.1186/1752-0509-7-27 · DOI
  31. Buchanan RE (1918) Life Phases in a Bacterial Culture · DOI
  32. 10.1073/pnas.1604995113 · DOI
  33. 10.1074/jbc.M114.557348 · DOI
  34. 2013, Characterization of 582 natural and synthetic terminators and quantification of their design constraints, Nature Methods, 10, 659, 10.1038/nmeth.2515 · DOI
  35. 10.1016/0378-1119(95)00193-A · DOI
  36. 10.1016/j.tibs.2020.04.011 · DOI · Paper page
  37. 10.1038/s41592-022-01639-4 · DOI
  38. 10.1073/pnas.120163297 · DOI
  39. 10.1021/ma00022a008 · DOI
  40. Diner EJ , Garza-Sánchez F & Hayes CS (2011) Genome Engineering Using Targeted Oligonucleotide Libraries and Functional Selection. In Bone, Williams JA (ed) pp 71–82. Totowa, NJ: Humana Press · DOI
  41. 10.1146/annurev-micro-041320-111014 · DOI
  42. 10.1128/JB.181.1.197-203.1999 · DOI
  43. 10.1007/s12575-009-9008-x · DOI · Paper page
  44. 10.1371/journal.pone.0067590 · DOI
  45. 10.1038/s41467-019-11725-5 · DOI
  46. 1987, Maintenance of intracellular calcium in Escherichia coli, Journal of Biological Chemistry, 262, 12570, 10.1016/S0021-9258(18)45243-X · DOI
  47. 10.1063/1.2914118 · DOI · Paper page
  48. 1969, Isolation of mutants of Escherichia coli B altered in their ability to synthesize glycogen, J Bacteriol, 97, 970, 10.1128/jb.97.2.970-972.1969 · DOI
  49. 10.1016/J.CELL.2019.05.017 · DOI
  50. 10.1016/S0378-1119(98)00020-1 · DOI
  51. 10.1099/mic.0.062950-0 · DOI
  52. 2019, Subsurface Imaging of Cell Organelles by Force Microscopy, ACS Nano, 13, 9629, 10.1021/acsnano.9b04808 · DOI
  53. Hardo G , Noka M & Bakshi S (2022) Synthetic Micrographs of Bacteria (SyMBac) allows accurate segmentation of bacterial cells using deep neural networks. BMC Biol 20 · DOI
  54. 10.1038/318478a0 · DOI
  55. 10.1016/S0168-9525(02)02734-8 · DOI
  56. 10.1074/jbc.M001348200 · DOI
  57. Hoang AY , Azaldegui CA , Ghalmi M , Biteen JS & Vecchiarelli AG (2023) An experimental framework to assess biomolecular condensates in bacteria. · DOI
  58. 10.3891/acta.chem.scand.11-0757 · DOI
  59. 1956, Changes in Glycogen and Nitrogen-containing Compounds in Escherichia coli B during Growth in Deficient Media, I. Nitrogen and Carbon Starvation. Acta Chem Scand, 10, 578
  60. 10.1146/annurev-cellbio-100913-013325 · DOI · Paper page
  61. 2019, Stiffness tomography of eukaryotic intracellular compartments by atomic force microscopy, Nanoscale, 11, 10320, 10.1039/C8NR08955H · DOI
  62. 10.1128/jb.175.11.3401-3407.1993 · DOI
  63. 10.1021/acs.macromol.8b02476 · DOI
  64. 10.1111/j.1365-2958.2008.06454.x · DOI
  65. 10.2217/fmb-2016-0218 · DOI
  66. 10.1016/j.cub.2016.08.054 · DOI
  67. 10.1128/JB.00536-08 · DOI
  68. 10.1128/jb.155.3.1027-1032.1983 · DOI
  69. 10.1128/jb.168.3.1466-1467.1986 · DOI
  70. 10.1038/nmeth.1955 · DOI
  71. 2016, tCRISPRi: tunable and reversible, one-step control of gene expression, Scientific Reports, 6, 1
  72. 10.1021/nn500553z · DOI
  73. 10.1016/j.cell.2021.10.001 · DOI
  74. 2021, From Prokaryotes to Eukaryotes: Insights Into the Molecular Structure of Glycogen Particles, Front Mol Biosci, 8, 1
  75. 10.1128/AEM.64.2.688-694.1998 · DOI
  76. 2008, Statistically enhanced promiscuity of structurally correlated patterns, Phys Rev E, 77, 020901, 10.1103/PhysRevE.77.020901 · DOI
  77. 10.1007/978-0-387-09794-7_4 · DOI
  78. 1996, Molecular film assembly via layer-by-layer adsorption of oppositely charged macromolecules (linear polymer, protein and clay) and concanavalin A and glycogen, Thin Solid Films, 284–285, 797
  79. 1963, The biological control of glycogen metabolism in Agrobacterium tumefaciens, Can J Biochem Physiol, 41, 561, 10.1139/y63-067 · DOI
  80. 2018, Functional mapping of the E. coli translational machinery using single-molecule tracking, Mol Microbiol, 110, 262, 10.1111/mmi.14103 · DOI
  81. 10.1016/j.bpj.2011.04.030 · DOI · Paper page
  82. 10.1016/S1090-7807(03)00082-X · DOI
  83. 10.1007/BF01935530 · DOI
  84. 1962, Polysaccharides, lipids and poly-β-hydroxybutyrate in microorganisms, Recueil des Travaux Chimiques des Pays-Bas, 81, 797, 10.1002/recl.19620810911 · DOI
  85. 10.1002/(SICI)1097-0290(19970605)54:5<461::AID-BIT6>3.0.CO;2-C · DOI
  86. 10.1146/annurev.micro.58.030603.123818 · DOI
  87. 10.1099/00221287-135-6-1599 · DOI
  88. 2025, Wnt signaling modulates mechanotransduction in the epidermis to drive hair follicle regeneration, Sci Adv, 11, eadq0638, 10.1126/sciadv.adq0638 · DOI
  89. 10.1111/mmi.13264 · DOI
  90. Papagiannakis A , Yu Q , Govers SK , Lin W-H , Wingreen NS & Jacobs-Wagner C (2025) Nonequilibrium polysome dynamics promote chromosome segregation and its coupling to cell growth in Escherichia coli. Elife · DOI
  91. Pelletier JF , Field CM , Coughlin M , Ryazanova L , Sonnett M , Wühr M & Mitchison TJ (2021) Glycogen-dependent demixing of frog egg cytoplasm at increased crowding. 1–21 · DOI
  92. 2021, Visualizing intracellular nanostructures of living cells by nanoendoscopy-AFM, Sci Adv, 7, eabj4990, 10.1126/sciadv.abj4990 · DOI
  93. 10.1016/j.cell.2020.10.017 · DOI
  94. 10.1016/0022-2836(69)90207-1 · DOI
  95. Pogliano J , Pogliano K , Weiss DS , Losick R & Beckwith J (1997) Inactivation of FtsI inhibits constriction of the FtsZ cytokinetic ring and delays the assembly of FtsZ rings at potential division sites · DOI
  96. 10.1016/S0006-3495(01)75851-1 · DOI
  97. 10.1146/annurev.mi.38.100184.002223 · DOI
  98. Preiss J & Romeo T (1990) Physiology, Biochemistry and Genetics of Bacterial Glycogen Synthesis. In pp 183–238. · DOI
  99. 10.1016/S0079-6603(08)60255-X · DOI
  100. 10.1073/pnas.1615575114 · DOI
  101. 10.1016/j.bpj.2009.05.010 · DOI
  102. 10.1099/00221287-120-2-317 · DOI
  103. 10.1038/s41592-023-01831-0 · DOI
  104. 10.1073/pnas.1411558111 · DOI
  105. 10.1021/ja00420a036 · DOI
  106. 10.7554/eLife.20010 · DOI
  107. 10.1038/nmeth.2019 · DOI · Paper page
  108. 10.1085/jgp.46.1.159 · DOI · Paper page
  109. Sekar K , Linker SM , Nguyen J , Grünhagen A , Stocker R & Sauer U (2020) Bacterial Glycogen Provides Short-Term Benefits in Changing Environments. Appl Environ Microbiol 86 · DOI
  110. 10.1073/pnas.1505396112 · DOI
  111. 10.1126/science.1084780 · DOI
  112. 2021, Starvation induces shrinkage of the bacterial cytoplasm, Proc Natl Acad Sci U S A, 118, 2104686118, 10.1073/pnas.2104686118 · DOI
  113. 10.1111/1462-2920.12119 · DOI
  114. 10.1146/annurev.mi.28.100174.001123 · DOI
  115. 10.1016/0003-9861(64)90425-4 · DOI
  116. 2017, Novel method for detection of glycogen in cells, Glycobiology, 27, 416
  117. Smith WC , Qu H , Zheng K , Baek JH , Gao Y , Buehler PW , Feng X & Xu X (2023) Determining critical overlap concentration of polyethylene oxide to support excipient safety assessment of opioid products. Int J Pharm 632 · DOI
  118. 10.1371/journal.pgen.1004961 · DOI
  119. 10.1099/00221287-25-1-61 · DOI
  120. 10.1111/mmi.13486 · DOI
  121. 10.1016/j.cell.2018.01.014 · DOI
  122. 10.1016/S0006-3495(97)78835-0 · DOI
  123. 10.1038/s41598-020-68960-w · DOI
  124. Thomason LC , Costantino N & Court DL (2007) E. coli Genome Manipulation by P1 Transduction. Curr Protoc Mol Biol 79 · DOI
  125. 2020, Mechanically Induced Bacterial Death Imaged in Real Time: A Simultaneous Nanoindentation and Fluorescence Microscopy Study, ACS Appl Mater Interfaces, 12, 31235, 10.1021/acsami.0c08184 · DOI
  126. 2019, Molecular Structure of Glycogen in Escherichia coli, Biomacromolecules, 20, 2821, 10.1021/acs.biomac.9b00586 · DOI
  127. 10.1007/s00114-011-0832-x · DOI
  128. 10.3389/fmicb.2020.00665 · DOI
  129. 2021, The dynamic changes of glycogen molecular structure in Escherichia coli BL21(DE3), Carbohydr Polym, 259, 117773, 10.1016/j.carbpol.2021.117773 · DOI
  130. 10.1016/j.cub.2010.04.045 · DOI · Paper page
  131. 2019, Protocol for analyzing protein liquid–liquid phase separation, Biophys Rep, 5, 1, 10.1007/s41048-018-0078-7 · DOI
  132. 10.1111/j.1574-6976.2010.00220.x · DOI
  133. 10.1016/0923-2508(90)90096-9 · DOI
  134. 10.1038/nnano.2015.126 · DOI
  135. 10.1271/bbb.60.1899 · DOI
  136. 1996, A novel fluorescent derivative of glucose applicable to the assessment of glucose uptake activity of Escherichia coli, Biochimica et Biophysica Acta (BBA) - General Subjects, 1289, 5, 10.1016/0304-4165(95)00153-0 · DOI
  137. 10.1007/BF02097485 · DOI
  138. 2020, Single-Cell Analysis for Glycogen Localization and Metabolism in Cultured Astrocytes, Cell Mol Neurobiol, 40, 801, 10.1007/s10571-019-00775-4 · DOI

Metadata

Authors
Thappeta, Y., Cañas-Duarte, S. J., Wang, H., Kallem, T., Fragasso, A., Xiang, Y., Gray, W., Lee, C., Hardo, G., Cegelski, L., & Jacobs-Wagner, C.
Affiliations
  • Stanford University (US)
  • Howard Hughes Medical Institute (US)
  • Yale University (US)
  • Duke University (US)
  • United Arab Emirates University (AE)
Corresponding author
  • Thappeta, Yashna
  • Cañas-Duarte, Silvia J.
Venue
The EMBO Journal
Publisher
openRxiv
Published
2024-04-20
Volume
44
Issue
24
Pages
7434-7476
ISSN
0261-4189 (ISSN-L)
OpenAlex
W4415805323
Cited by
17
References
1
Citations by year
2026: 6 · 2025: 10 · 2024: 1
FWCI
9.36
Type
journal article
Language
en
Open access
Locations
  • The EMBO Journal (publishedVersion, cc-by)
  • bioRxiv (Cold Spring Harbor Laboratory) (acceptedVersion, cc-by-nc-nd)
  • Europe PMC (PubMed Central) (publishedVersion, cc-by)
  • PubMed (publishedVersion)
  • PubMed Central (publishedVersion, cc-by-nc-nd)
  • PubMed Central (publishedVersion, cc-by)
Funders
  • Netherlands Organization for Scientific Research (Rubicon 2022-2 Science programme, 019.222EN.001)
  • Biotechnology and Biological Sciences Research Council (BB/M011194/1)
  • National Institutes of Health (R01GM117278)
Topics
  • Life Sciences › Biochemistry, Genetics and Molecular Biology › Genetics › Bacterial Genetics and Biotechnology
  • Life Sciences › Biochemistry, Genetics and Molecular Biology › Molecular Biology › Gene Regulatory Network Analysis
  • Life Sciences › Biochemistry, Genetics and Molecular Biology › Molecular Biology › Redox biology and oxidative stress
Keywords
glycogen, phase separation, asymmetric cell division, Escherichia coli, nutrient limitation, stationary phase, cell division site, cytoplasmic crowding, cell size, glucose storage

About these checks

Registry, retraction, Cites and statistics results are computed, not judged, with one exception: a printed reference that no index lists is read once by a model before it counts as a citation error. Claims are extracted by a model and kept only when their quote appears verbatim in the text; each cited source is then checked, with a model’s help, for whether it says what the claim relies on. Those verdicts can be wrong — read the claim’s quote and the cited source before relying on one.

Statistics and arithmetic are recomputed, not judged.

Confidence bands are shown only for fields calibrated on our annotated test set. None is calibrated yet, so no band is shown.

What counts as a claim ›How we measure confidence ›How we check this ›

Are you an author, or do you see a problem with this page? Request a review