PreprintCited by 7Toxoplasma gondii Research StudiesBiochemical and Molecular ResearchTrypanosoma species research and implications

The DOI matches its Crossref record; 1 of the 1 references it cites were found in a registry or an index.

Impact of Equilibrative Nucleoside Transporters on Toxoplasma gondii Infection and Differentiation

Open access
Messina, Gabriel, Goerner, Amber, Bennett, Charlotte, Brennan, Euwen, Carruthers, Vern B., Di Genova, Bruno Martorelli·2024·mBio

Preprint — published as 10.1128/mbio.02207-25

Abstract

Toxoplasma gondii cannot synthesize purines de novo and must import them; yet, the functional interplay among its four equilibrative nucleoside transporters (ENTs) homologs remains unclear. We systematically deconstructed this network by combining CRISPR-Cas9 knockouts with an auxin-inducible degron. Across all phenotypic assays, tachyzoite replication, nucleoside-analogue sensitivity, alkaline-stress–induced differentiation, and murine cyst formation, the Δ TgENT2 strain was indistinguishable from the parental line, indicating that TgENT2 is dispensable under the conditions tested. In contrast, the double mutant Δ TgAT1ΔTgENT3 exhibited delayed bradyzoite differentiation in vitro and produced smaller brain cysts in vivo. This double deletion triggered a ∼3-fold transcriptional up-regulation of TgENT1 , whose product we partially localized to the plant-like vacuolar compartment (PLVAC). Conditional depletion of TgENT1 caused complete intracellular growth arrest, PLVAC swelling, and a purine-starvation-like transcriptomic program enriched for nucleoside phosphatases and cyclic-nucleotide phosphodiesterases. These findings reveal a compensatory salvage pathway in which the parasite reroutes purine acquisition through a vacuolar route when plasma-membrane import is compromised. Although this adaptation sustains tachyzoite proliferation, it fails during the energetically demanding transition to bradyzoites, creating a metabolic bottleneck that impairs chronic infection. Our work reveals an adaptable yet ultimately limited purine-import network and identifies TgENT1, along with the vacuolar salvage axis it mediates, as a promising therapeutic target for blocking lifelong toxoplasmosis.

Overview

The claims and statistics of this paper haven’t been checked yet.

Run the check — free, no account needed. It reads the open-access text and checks the sources it cites.

A few free checks a day · papers already verified open instantly · results are public

Integrity signals

Registry

Crossref · 10.1101/2024.07.10.601519

Cites

1 of 1 references verified0 citation errors · 0 not checkable

Statistics

Figures

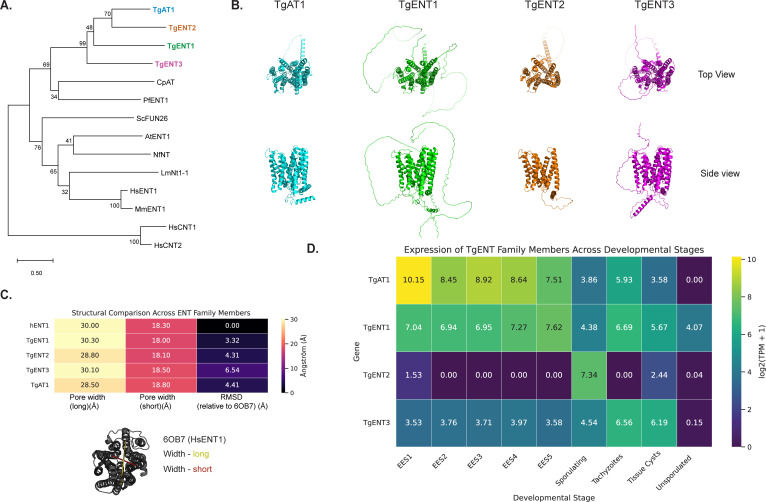
Fig 1 Evolutionary, structural, and transcriptional overview of the TgENT family. (A) Phylogenetic relationships: full-length protein sequences of the four T. gondii ENTs (TgAT1 and TgENT1–3) were aligned with representative ENT homologs from apicomplexan, fungal, plant, trypanosomatid, and mammalian lineages (CpAT, Cryptosporidium parvum; PfENT1, Plasmodium falciparum; ScFUN26, Saccharomyces cerevisiae; AtENT1, Arabidopsis thaliana; NNT, Naegleria sp.; LmNnt1-1, Leishmania major; HsENT1/2, MmENT1, human and mouse ENT1/2; HsCNT1/2, human concentrative nucleoside transporters—used as the out-group). MUSCLE-aligned sequences were subjected to neighbor-joining analysis; node labels give bootstrap support from 1,000 replicates (values <30% omitted). Scale bar, 0.5 substitutions per site. (B) Predicted tertiary structures: AlphaFold models of the four TgENT paralogs are shown in ribbon representation (top-view, upper row; side-view, lower row). Each adopts the canonical 11–13 trans-membrane helix bundle typical of ENT family members, with the central permeation pore clearly visible in the side view. Colors match the gene names in panel A. (C) Quantitative structural comparison to human ENT1 (PDB 6OB7). Pore dimensions were measured along the long and short axes (Å) for each TgENT model and for HsENT1, and Cα root mean square deviations (RMSDs) were calculated after SuperPose alignment to 6OB7. Heat-map shading reflects magnitude (scale bar, right). The cartoon underneath illustrates the pore-width measurements on the HsENT1 template. (D) Stage-specific expression of TgENT transcripts. Heat map of log2-transformed TPM values (+1) extracted from the ToxoDB developmental transcriptome. EES 1–5, enteroepithelial stages in cat epithelium; sporulating oocysts; tachyzoites; tissue cyst bradyzoites; unsporulated oocysts (19, 20). TgAT1 is highest in enteroepithelial and early tachyzoite stages, TgENT1 is broadly expressed, TgENT2 peaks during sporulation, and TgENT3 shows moderate expression throughout.
Fig 1 Evolutionary, structural, and transcriptional overview of the TgENT family. (A) Phylogenetic relationships: full-length protein sequences of the four T. gondii ENTs (TgAT1 and TgENT1–3) were aligned with representative ENT homologs from apicomplexan, fungal, plant, trypanosomatid, and mammalian lineages (CpAT, Cryptosporidium parvum; PfENT1, Plasmodium falciparum; ScFUN26, Saccharomyces cerevisiae; AtENT1, Arabidopsis thaliana; NNT, Naegleria sp.; LmNnt1-1, Leishmania major; HsENT1/2, MmENT1, human and mouse ENT1/2; HsCNT1/2, human concentrative nucleoside transporters—used as the out-group). MUSCLE-aligned sequences were subjected to neighbor-joining analysis; node labels give bootstrap support from 1,000 replicates (values <30% omitted). Scale bar, 0.5 substitutions per site. (B) Predicted tertiary structures: AlphaFold models of the four TgENT paralogs are shown in ribbon representation (top-view, upper row; side-view, lower row). Each adopts the canonical 11–13 trans-membrane helix bundle typical of ENT family members, with the central permeation pore clearly visible in the side view. Colors match the gene names in panel A. (C) Quantitative structural comparison to human ENT1 (PDB 6OB7). Pore dimensions were measured along the long and short axes (Å) for each TgENT model and for HsENT1, and Cα root mean square deviations (RMSDs) were calculated after SuperPose alignment to 6OB7. Heat-map shading reflects magnitude (scale bar, right). The cartoon underneath illustrates the pore-width measurements on the HsENT1 template. (D) Stage-specific expression of TgENT transcripts. Heat map of log2-transformed TPM values (+1) extracted from the ToxoDB developmental transcriptome. EES 1–5, enteroepithelial stages in cat epithelium; sporulating oocysts; tachyzoites; tissue cyst bradyzoites; unsporulated oocysts (19, 20). TgAT1 is highest in enteroepithelial and early tachyzoite stages, TgENT1 is broadly expressed, TgENT2 peaks during sporulation, and TgENT3 shows moderate expression throughout.CC BY · PubMed Central
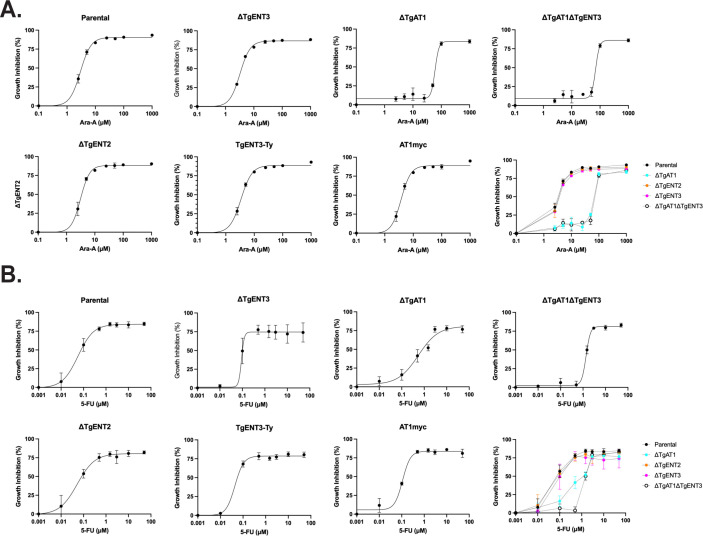
Fig 2 Deletion of TgAT1 and TgENT3 alters Toxoplasma sensitivity to toxic nucleoside analogs. Parental ME49 parasites and the indicated mutants were allowed to replicate for 72 h in Hs27 monolayers in the presence of increasing concentrations of (A) the adenosine analog Ara-A or (B) the pyrimidine analog 5-FU. Cultures were fixed and stained with anti-Toxoplasma (anti-Tg) antibody, and the mean area of ≥50 PVs per condition was measured by automated image analysis. Growth inhibition (% ±SEM) was calculated relative to drug-free controls and fitted to a four-parameter logistic curve (GraphPad Prism). Data are from three biological replicates, each performed in technical triplicate. Panel layout: for each drug, individual dose–response curves are shown for the parental line, single knockouts (ΔTgENT3, ΔTgENT2, and ΔTgAT1), the double knockout (ΔTgAT1ΔTgENT3), and the corresponding epitope-tagged complementation lines (ΔTgENT3::TgENT3-Ty1, ΔTgAT1::TgAT1-myc). The right-most graph in each row overlays all strains for direct comparison (color key, inset). IC50 values for each strain are shown in Table S1.
Fig 2 Deletion of TgAT1 and TgENT3 alters Toxoplasma sensitivity to toxic nucleoside analogs. Parental ME49 parasites and the indicated mutants were allowed to replicate for 72 h in Hs27 monolayers in the presence of increasing concentrations of (A) the adenosine analog Ara-A or (B) the pyrimidine analog 5-FU. Cultures were fixed and stained with anti-Toxoplasma (anti-Tg) antibody, and the mean area of ≥50 PVs per condition was measured by automated image analysis. Growth inhibition (% ±SEM) was calculated relative to drug-free controls and fitted to a four-parameter logistic curve (GraphPad Prism). Data are from three biological replicates, each performed in technical triplicate. Panel layout: for each drug, individual dose–response curves are shown for the parental line, single knockouts (ΔTgENT3, ΔTgENT2, and ΔTgAT1), the double knockout (ΔTgAT1ΔTgENT3), and the corresponding epitope-tagged complementation lines (ΔTgENT3::TgENT3-Ty1, ΔTgAT1::TgAT1-myc). The right-most graph in each row overlays all strains for direct comparison (color key, inset). IC50 values for each strain are shown in Table S1.CC BY · PubMed Central
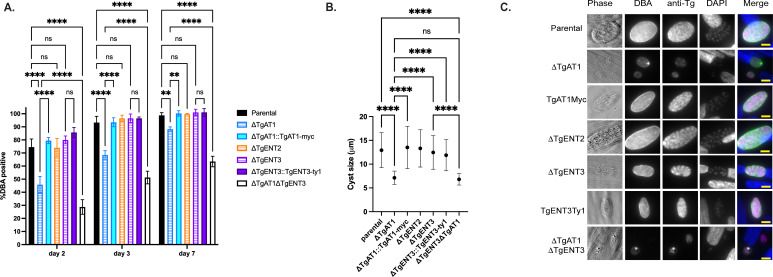
Fig 3 Simultaneous deletion of TgENT3 and TgAT1 delays differentiation. (A) Percentage of differentiation of the parental line, single knockouts (ΔTgENT3, ΔTgENT2, and ΔTgAT1), the double knockout (ΔTgAT1ΔTgENT3), and the corresponding epitope-tagged complementation lines TgENT3-Ty1 (ΔTgENT3::TgENT3-Ty1) and TgAT1-myc (ΔTgAT1::TgAT1-myc) at days 2, 3, and 7 post-invasion of Hs27 monolayers cultured in alkaline stress conditions (pH 8.1 and atmospheric CO2). Parasites were stained with immunofluorescent antibodies 4′,6-diamidino-2-phenylindole (DAPI), anti-Tg, and DBA. Bars show the percentage of DBA-positive vacuoles (thresholds set based on parental line intensity) over total vacuoles (anti-Tg). Slides were imaged with BioTEK Cytation 7 and quantified using Gen5 software (≥100 vacuoles were counted per replicate, n = 3 biological replicates). Statistical significance was assessed using one-way analysis of variance (ANOVA) (****P < 0.0001, ns = non-significant). (B) Average sizes of each cyst (DBA-positive vacuole) on day 7 postinvasion. (C) Representative images of vacuoles from each parasite line. Scale bar, 10 µm.
Fig 3 Simultaneous deletion of TgENT3 and TgAT1 delays differentiation. (A) Percentage of differentiation of the parental line, single knockouts (ΔTgENT3, ΔTgENT2, and ΔTgAT1), the double knockout (ΔTgAT1ΔTgENT3), and the corresponding epitope-tagged complementation lines TgENT3-Ty1 (ΔTgENT3::TgENT3-Ty1) and TgAT1-myc (ΔTgAT1::TgAT1-myc) at days 2, 3, and 7 post-invasion of Hs27 monolayers cultured in alkaline stress conditions (pH 8.1 and atmospheric CO2). Parasites were stained with immunofluorescent antibodies 4′,6-diamidino-2-phenylindole (DAPI), anti-Tg, and DBA. Bars show the percentage of DBA-positive vacuoles (thresholds set based on parental line intensity) over total vacuoles (anti-Tg). Slides were imaged with BioTEK Cytation 7 and quantified using Gen5 software (≥100 vacuoles were counted per replicate, n = 3 biological replicates). Statistical significance was assessed using one-way analysis of variance (ANOVA) (****P < 0.0001, ns = non-significant). (B) Average sizes of each cyst (DBA-positive vacuole) on day 7 postinvasion. (C) Representative images of vacuoles from each parasite line. Scale bar, 10 µm.CC BY · PubMed Central
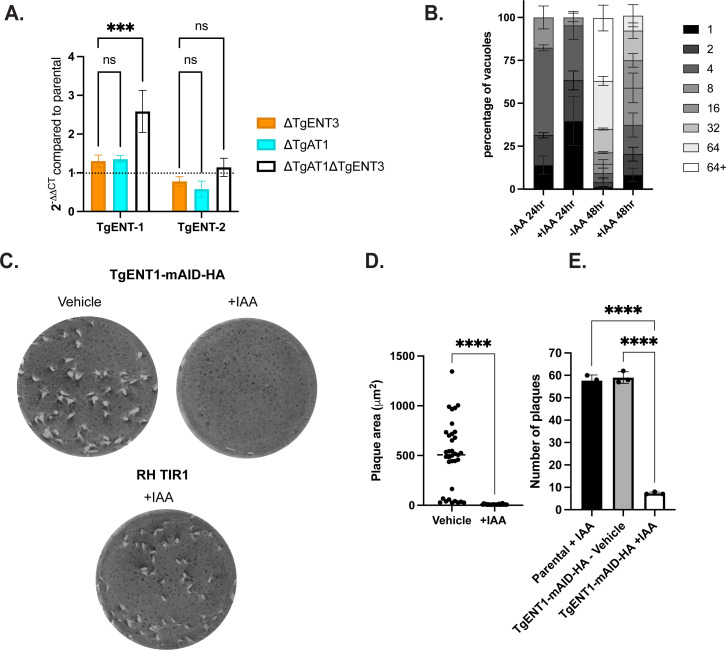
Fig 4 TgENT1 is transcriptionally upregulated in ΔTgAT1ΔTgENT3 parasites and is indispensable for intracellular replication and plaque formation. (A) qRT-PCR analysis of compensatory TgENT expression. Total RNA from tachyzoites of the indicated mutant lines was analyzed by qRT-PCR with primers specific for TgENT1 and TgENT2. Bars show 2ΔΔCt values (mean ± SEM, n = 3 biological replicates) normalized to the parental line (dotted line = 1). Only the double knockout (ΔTgAT1ΔTgENT3, open bars) exhibits approximately threefold induction of TgENT1 (one-way ANOVA with ***P < 0.001); TgENT2 is unchanged (ns). (B) Acute intracellular growth after TgENT1 depletion. TgENT1-mAID-HA parasites were pre-treated for 48 h with vehicle or 500 µM indole-3-acetic acid (+IAA) to trigger auxin-inducible degradation, then allowed to invade fresh Hs27 monolayers for a further 48 h under the same conditions. Stacked bars depict the distribution of vacuoles containing 1, 2, 4, 8, 16, 32, 64, or >64 parasites (≥50 vacuoles counted per replicate; three replicates). (C) Plaque-formation assay. Wells were inoculated with 50 tachyzoites of the indicated strains and cultured for 9 days ± 500 µM IAA before fixation and crystal-violet staining. Representative wells are shown. (D) Quantification of plaque area. Individual plaque areas from TgENT1-mAID-HA wells (vehicle vs +IAA) are plotted (median ± inter-quartile range; n = 15–20 plaques). Student t-test, ****P < 0.0001. (E) Quantification of plaque number. Mean ± SEM plaque counts per well from three independent experiments. t-test, ****, P < 0.0001.
Fig 4 TgENT1 is transcriptionally upregulated in ΔTgAT1ΔTgENT3 parasites and is indispensable for intracellular replication and plaque formation. (A) qRT-PCR analysis of compensatory TgENT expression. Total RNA from tachyzoites of the indicated mutant lines was analyzed by qRT-PCR with primers specific for TgENT1 and TgENT2. Bars show 2ΔΔCt values (mean ± SEM, n = 3 biological replicates) normalized to the parental line (dotted line = 1). Only the double knockout (ΔTgAT1ΔTgENT3, open bars) exhibits approximately threefold induction of TgENT1 (one-way ANOVA with ***P < 0.001); TgENT2 is unchanged (ns). (B) Acute intracellular growth after TgENT1 depletion. TgENT1-mAID-HA parasites were pre-treated for 48 h with vehicle or 500 µM indole-3-acetic acid (+IAA) to trigger auxin-inducible degradation, then allowed to invade fresh Hs27 monolayers for a further 48 h under the same conditions. Stacked bars depict the distribution of vacuoles containing 1, 2, 4, 8, 16, 32, 64, or >64 parasites (≥50 vacuoles counted per replicate; three replicates). (C) Plaque-formation assay. Wells were inoculated with 50 tachyzoites of the indicated strains and cultured for 9 days ± 500 µM IAA before fixation and crystal-violet staining. Representative wells are shown. (D) Quantification of plaque area. Individual plaque areas from TgENT1-mAID-HA wells (vehicle vs +IAA) are plotted (median ± inter-quartile range; n = 15–20 plaques). Student t-test, ****P < 0.0001. (E) Quantification of plaque number. Mean ± SEM plaque counts per well from three independent experiments. t-test, ****, P < 0.0001.CC BY · PubMed Central
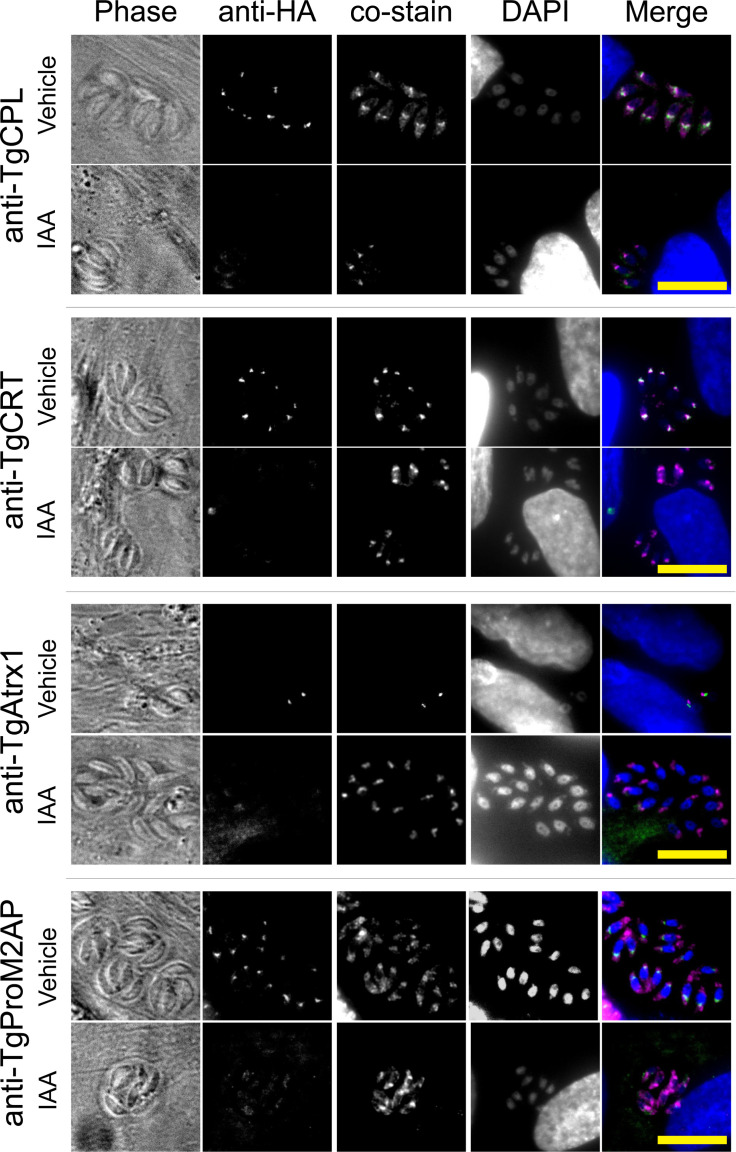
Fig 5 TgENT1 resides in the plant-like vacuolar compartment (PLVAC) and is eliminated by auxin-induced degradation. Representative immunofluorescence images of TgENT1-mAID-HA tachyzoites pre-treated for 48 h with vehicle or 500 µM +IAA, then grown in fresh Hs27 monolayers for a further 48 h under the same conditions. Parasites were fixed and stained with anti-HA (second column) plus one of the indicated compartment markers (third column): T. gondii cathepsin protease L (TgCPL) or T. gondii chloroquine-resistance transporter (TgCRT) for the PLVAC, TgAtrx1 for the apicoplast, and TgProM2AP for the endosome-like/microneme compartment. Columns show (left to right) phase-contrast, anti-HA, co-stain, DAPI, and the merged overlay (anti-HA = green, co-stain = magenta, and DAPI = blue). Under vehicle conditions, TgENT1-HA displays a punctate pattern that co-localizes with PLVAC markers TgCPL and TgCRT, but only weakly with TgProM2AP and not with TgAtrx1, consistent with predominant residence in PLVAC. Upon IAA treatment, the HA signal is virtually abolished, confirming efficient auxin-inducible degradation. Scale bar, 10 µm.
Fig 5 TgENT1 resides in the plant-like vacuolar compartment (PLVAC) and is eliminated by auxin-induced degradation. Representative immunofluorescence images of TgENT1-mAID-HA tachyzoites pre-treated for 48 h with vehicle or 500 µM +IAA, then grown in fresh Hs27 monolayers for a further 48 h under the same conditions. Parasites were fixed and stained with anti-HA (second column) plus one of the indicated compartment markers (third column): T. gondii cathepsin protease L (TgCPL) or T. gondii chloroquine-resistance transporter (TgCRT) for the PLVAC, TgAtrx1 for the apicoplast, and TgProM2AP for the endosome-like/microneme compartment. Columns show (left to right) phase-contrast, anti-HA, co-stain, DAPI, and the merged overlay (anti-HA = green, co-stain = magenta, and DAPI = blue). Under vehicle conditions, TgENT1-HA displays a punctate pattern that co-localizes with PLVAC markers TgCPL and TgCRT, but only weakly with TgProM2AP and not with TgAtrx1, consistent with predominant residence in PLVAC. Upon IAA treatment, the HA signal is virtually abolished, confirming efficient auxin-inducible degradation. Scale bar, 10 µm.CC BY · PubMed Central
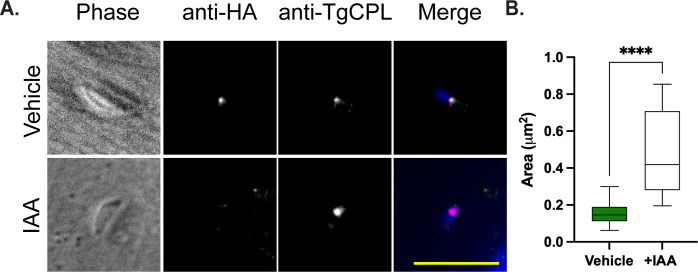
Fig 6 Loss of TgENT1 causes swelling of the PLVAC. (A) TgENT1-mAID-HA parasites were grown for 48 h post-infection, mechanically released, and allowed to reinvade new Hs27 monolayers for 30 minutes in the continued presence of vehicle or 500 µM IAA. Cells were fixed and co-stained with anti-HA (TgENT1, green) and anti-TgCPL (PLVAC marker, magenta); nuclei were counter-stained with DAPI (blue). TgENT1 is readily detected in the central PLVAC punctum under vehicle conditions but is efficiently depleted after auxin treatment, coincident with an enlarged TgCPL-positive compartment. Scale bar, 10 µm. (B) Quantification of PLVAC size. The area of 50 individual CPL-positive structures per condition (three independent experiments) was measured in FIJI. Box-and-whisker plots show median, interquartile range, and 5th–95th percentiles. Auxin-induced TgENT1 depletion increased PLVAC area nearly fivefold, Student t-test, ****P < 0.0001, suggesting that TgENT1 activity is required to maintain normal vacuolar homeostasis.
Fig 6 Loss of TgENT1 causes swelling of the PLVAC. (A) TgENT1-mAID-HA parasites were grown for 48 h post-infection, mechanically released, and allowed to reinvade new Hs27 monolayers for 30 minutes in the continued presence of vehicle or 500 µM IAA. Cells were fixed and co-stained with anti-HA (TgENT1, green) and anti-TgCPL (PLVAC marker, magenta); nuclei were counter-stained with DAPI (blue). TgENT1 is readily detected in the central PLVAC punctum under vehicle conditions but is efficiently depleted after auxin treatment, coincident with an enlarged TgCPL-positive compartment. Scale bar, 10 µm. (B) Quantification of PLVAC size. The area of 50 individual CPL-positive structures per condition (three independent experiments) was measured in FIJI. Box-and-whisker plots show median, interquartile range, and 5th–95th percentiles. Auxin-induced TgENT1 depletion increased PLVAC area nearly fivefold, Student t-test, ****P < 0.0001, suggesting that TgENT1 activity is required to maintain normal vacuolar homeostasis.CC BY · PubMed Central
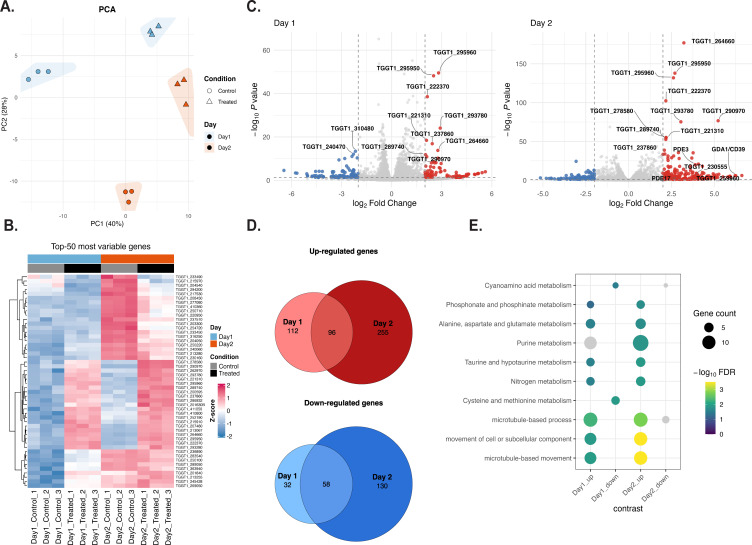
Fig 7 Transcriptomic response to acute TgENT1 depletion reveals a progressive, purine-centric stress program. TgENT1-mAID-HA tachyzoites (three biological replicates) were pre-treated for 48 h with vehicle or 500 µM IAA, then allowed to invade fresh Hs27 monolayers under the same conditions and harvested 24 h (day 1) or 48 h (day 2) after invasion. Poly(A) RNA was sequenced (Illumina NovaSeq; 150 bp PE), reads were mapped to the GT1 genome, and differential expression was analyzed with DESeq2 (|log₂FC| ≥ 1; false discovery rate [FDR] < 0.01). (A) Principal-component analysis (PCA). PC1 (40%) cleanly separates treated from control samples, whereas PC2 (28%) differentiates time points, indicating a robust, time-dependent transcriptional shift upon TgENT1 knockdown. (B) Heat map of the 50 most variable genes. Z-scored expression values highlight a concerted upregulation of purine- and nitrogen-metabolism genes (reds) and downregulation of cytoskeletal/motility genes (blues) that intensifies from day 1 to day 2. (C) Volcano plots of differentially expressed genes. Pink, upregulated; blue, downregulated; gray, non-significant. The magnitude and number of responsive genes expand markedly by day 2. The complete list of genes and fold change is presented in Table S4. (D) Overlap of DE genes between time points. Venn diagrams show 96 genes upregulated at both day 1 and day 2, and 58 genes consistently downregulated, underscoring a core TgENT1-dependent regulon that is sustained and amplified over time. (E) Functional enrichment analysis. Dot plot of the top gene ontology/KEGG terms (size = gene count; color = –log₁₀FDR). Upregulated sets are dominated by purine metabolism, nitrogen-compound metabolism, and cyano-/taurine-derivative pathways, whereas downregulated sets are enriched for microtubule-based movement and related processes, consistent with a shift from proliferation to metabolic stress response.
Fig 7 Transcriptomic response to acute TgENT1 depletion reveals a progressive, purine-centric stress program. TgENT1-mAID-HA tachyzoites (three biological replicates) were pre-treated for 48 h with vehicle or 500 µM IAA, then allowed to invade fresh Hs27 monolayers under the same conditions and harvested 24 h (day 1) or 48 h (day 2) after invasion. Poly(A) RNA was sequenced (Illumina NovaSeq; 150 bp PE), reads were mapped to the GT1 genome, and differential expression was analyzed with DESeq2 (|log₂FC| ≥ 1; false discovery rate [FDR] < 0.01). (A) Principal-component analysis (PCA). PC1 (40%) cleanly separates treated from control samples, whereas PC2 (28%) differentiates time points, indicating a robust, time-dependent transcriptional shift upon TgENT1 knockdown. (B) Heat map of the 50 most variable genes. Z-scored expression values highlight a concerted upregulation of purine- and nitrogen-metabolism genes (reds) and downregulation of cytoskeletal/motility genes (blues) that intensifies from day 1 to day 2. (C) Volcano plots of differentially expressed genes. Pink, upregulated; blue, downregulated; gray, non-significant. The magnitude and number of responsive genes expand markedly by day 2. The complete list of genes and fold change is presented in Table S4. (D) Overlap of DE genes between time points. Venn diagrams show 96 genes upregulated at both day 1 and day 2, and 58 genes consistently downregulated, underscoring a core TgENT1-dependent regulon that is sustained and amplified over time. (E) Functional enrichment analysis. Dot plot of the top gene ontology/KEGG terms (size = gene count; color = –log₁₀FDR). Upregulated sets are dominated by purine metabolism, nitrogen-compound metabolism, and cyano-/taurine-derivative pathways, whereas downregulated sets are enriched for microtubule-based movement and related processes, consistent with a shift from proliferation to metabolic stress response.CC BY · PubMed Central

Verification

Claims the paper makes

The claims and statistics of this paper haven’t been checked yet.

Run the check — free, no account needed. It reads the open-access text and checks the sources it cites.

A few free checks a day · papers already verified open instantly · results are public

Self-check

Percentages, sums and reported differences re-computed from the paper’s own numbers.

The self-check needs the paper’s full text.

Citations

Cites

Research works printed but not linked: 36

  1. 10.1016/j.ijpara.2008.03.007 · DOI
  2. 10.1016/j.chom.2020.01.002 · DOI
  3. 2019, Structures of human ENT1 in complex with adenosine reuptake inhibitors, Nature Structural & Molecular Biology, 26, 599, 10.1038/s41594-019-0245-7 · DOI
  4. 10.1080/10409238.2020.1832438 · DOI
  5. 10.1038/nchembio.690 · DOI
  6. 2021, From purines to purinergic signalling: molecular functions and human diseases, Signal Transduct Target Ther, 6, 162, 10.1038/s41392-021-00553-z · DOI
  7. 2011, Signaling for purines, Nature Structural & Molecular Biology, 18, 1322, 10.1038/nsmb.2200 · DOI
  8. 2021, Purinergic signaling in diabetes and metabolism, Biochem Pharmacol, 187, 114393, 10.1016/j.bcp.2020.114393 · DOI
  9. 10.1111/j.1365-2958.2010.07327.x · DOI
  10. Fox BA , Bzik DJ . Biochemistry and metabolism of Toxoplasma gondii: purine and pyrimidine acquisition in Toxoplasma gondii and other Apicomplexa. 2020 Jan 1;397–449. · DOI
  11. 2023, Structural basis of the substrate recognition and inhibition mechanism of Plasmodium falciparum nucleoside transporter PfENT1, Nat Commun. England, 14, 1727, 10.1038/s41467-023-37411-1 · DOI
  12. 2021, Metabolite salvage and restriction during infection — a tug of war between Toxoplasma gondii and its host, Current Opinion in Biotechnology, 68, 104, 10.1016/j.copbio.2020.09.015 · DOI
  13. 2001, The Role and Regulation of Adenosine in the Central Nervous System, Annu Rev Neurosci. Annual Reviews, 24, 31, 10.1146/annurev.neuro.24.1.31 · DOI
  14. 2022, A Toxoplasma gondii Oxopurine Transporter Binds Nucleobases and Nucleosides Using Different Binding Modes, International Journal of Molecular Sciences, 23, 710, 10.3390/ijms23020710 · DOI
  15. 10.1016/0166-6851(95)00005-L · DOI
  16. 10.1074/jbc.274.49.35255 · DOI
  17. 10.1016/S0020-7519(03)00091-2 · DOI
  18. 2015, Asexual expansion of Toxoplasma gondii merozoites is distinct from tachyzoites and entails expression of non-overlapping gene families to attach, invade, and replicate within feline enterocytes, BMC Genomics. England, 16, 66, 10.1186/s12864-015-1225-x · DOI
  19. 2019, An experimental genetically attenuated live vaccine to prevent transmission of Toxoplasma gondii by cats, Sci Rep. England, 9, 1474, 10.1038/s41598-018-37671-8 · DOI
  20. 2023, Pyrimidine salvage in Toxoplasma gondii as a target for new treatment, Front Cell Infect Microbiol, 13, 1320160, 10.3389/fcimb.2023.1320160 · DOI
  21. 2001, Initial characterization of CST1, a Toxoplasma gondii cyst wall glycoprotein, Infect Immun. United States, 69, 501, 10.1128/IAI.69.1.501-507.2001 · DOI
  22. 2015, Novel Approaches Reveal that Toxoplasma gondii Bradyzoites within Tissue Cysts Are Dynamic and Replicating Entities In Vivo, mBio. United States, 6, e01155
  23. 10.1016/j.cell.2016.08.019 · DOI
  24. 2018, Conditional Knockdown of Proteins Using Auxin-inducible Degron (AID) Fusions in Toxoplasma gondii, Bio Protoc, 8, e2728
  25. 2022, The Toxoplasma plant-like vacuolar compartment (PLVAC), J Eukaryot Microbiol. United States, 69, e12951, 10.1111/jeu.12951 · DOI
  26. 2011, Forward targeting of Toxoplasma gondii proproteins to the micronemes involves conserved aliphatic amino acids, Traffic. England, 12, 840, 10.1111/j.1600-0854.2011.01192.x · DOI
  27. 2008, A thioredoxin family protein of the apicoplast periphery identifies abundant candidate transport vesicles in Toxoplasma gondii, Eukaryot Cell. United States, 7, 1518, 10.1128/EC.00081-08 · DOI
  28. 2022, Functional Analysis of the Expanded Phosphodiesterase Gene Family in Toxoplasma gondii Tachyzoites, mSphere. United States, 7, e0079321
  29. 2018, Essential cGMP Signaling in Toxoplasma Is Initiated by a Hybrid P-Type ATPase-Guanylate Cyclase, Cell Host Microbe. United States, 24, 804, 10.1016/j.chom.2018.10.015 · DOI
  30. 2020, A single Na+-Pi cotransporter in Toxoplasma plays key roles in phosphate import and control of parasite osmoregulation, PLoS Pathog. United States, 16, e1009067, 10.1371/journal.ppat.1009067 · DOI
  31. 10.1016/0014-4894(82)90094-7 · DOI
  32. 2013, A nucleotide sugar transporter involved in glycosylation of the Toxoplasma tissue cyst wall is required for efficient persistence of bradyzoites, PLoS Pathog. United States, 9, e1003331, 10.1371/journal.ppat.1003331 · DOI
  33. 10.1128/mbio.00755-16 · DOI
  34. 2025, Metabolic adaptability and nutrient scavenging in Toxoplasma gondii: insights from ingestion pathway-deficient mutants, mSphere. United States, 10, e0101124
  35. 10.1016/j.chom.2020.09.011 · DOI
  36. 2014, A toxoplasma patatin-like protein changes localization and alters the cytokine response during toxoplasmic encephalitis, Infect Immun. United States, 82, 618, 10.1128/IAI.00444-13 · DOI

Metadata

Authors
Messina, G., Goerner, A., Bennett, C., Brennan, E., Carruthers, V. B., & Di Genova, B. M.
Affiliations
  • University of Vermont (US)
  • University of Michigan (US)
Venue
mBio
Publisher
openRxiv
Published
2024-07-10
Volume
16
Issue
11
Pages
e0220725-e0220725
ISSN
2150-7511 (ISSN-L)
OpenAlex
W4414660301
Cited by
7
References
1
Citations by year
2026: 6 · 2025: 1
FWCI
6.23
Type
journal article
Language
en
Open access
Locations
  • mBio (publishedVersion, cc-by)
  • bioRxiv (Cold Spring Harbor Laboratory) (acceptedVersion, cc-by-nc)
  • Europe PMC (PubMed Central) (publishedVersion, cc-by)
  • PubMed (publishedVersion)
  • DOAJ (DOAJ: Directory of Open Access Journals) (submittedVersion, cc-by-sa)
Funders
  • National Institute of General Medical Sciences (P20GM125498)
  • National Institute of Allergy and Infectious Diseases (R21AI180278)
Topics
  • Life Sciences › Immunology and Microbiology › Parasitology › Toxoplasma gondii Research Studies
  • Life Sciences › Biochemistry, Genetics and Molecular Biology › Molecular Biology › Biochemical and Molecular Research
  • Health Sciences › Medicine › Epidemiology › Trypanosoma species research and implications
Keywords
Toxoplasma gondii, equilibrative nucleoside transporter, purine salvage pathway, bradyzoite differentiation, alkaline stress, CRISPR/Cas9 knockout, auxin-inducible degron, antiparasitic drug targets
MeSH terms
Animals, Toxoplasma, Toxoplasmosis, Protozoan Proteins, Nucleoside Transport Proteins, Equilibrative Nucleoside Transport Proteins, Mice, CRISPR-Cas Systems

About these checks

Registry, retraction, Cites and statistics results are computed, not judged, with one exception: a printed reference that no index lists is read once by a model before it counts as a citation error. Claims are extracted by a model and kept only when their quote appears verbatim in the text; each cited source is then checked, with a model’s help, for whether it says what the claim relies on. Those verdicts can be wrong — read the claim’s quote and the cited source before relying on one.

Statistics and arithmetic are recomputed, not judged.

Confidence bands are shown only for fields calibrated on our annotated test set. None is calibrated yet, so no band is shown.

What counts as a claim ›How we measure confidence ›How we check this ›

Are you an author, or do you see a problem with this page? Request a review