

The DOI matches its Crossref record; 2 of the 2 references it cites were found in a registry or an index.
Chromatin Structures from Integrated AI and Polymer Physics Model
Open accessPreprint — published as 10.1371/journal.pcbi.1012912 · Paper page
Abstract
The physical organization of the genome in three-dimensional space regulates many biological processes, including gene expression and cell differentiation. Three-dimensional characterization of genome structure is critical to understanding these biological processes. Direct experimental measurements of genome structure are challenging; computational models of chromatin structure are therefore necessary. We develop an approach that combines a particle-based chromatin polymer model, molecular simulation, and machine learning to efficiently and accurately estimate chromatin structure from indirect measures of genome structure. More specifically, we introduce a new approach where the interaction parameters of the polymer model are extracted from experimental Hi-C data using a graph neural network (GNN). We train the GNN on simulated data from the underlying polymer model, avoiding the need for large quantities of experimental data. The resulting approach accurately estimates chromatin structures across all chromosomes and across several experimental cell lines despite being trained almost exclusively on simulated data. The proposed approach can be viewed as a general framework for combining physical modeling with machine learning, and it could be extended to integrate additional biological data modalities. Ultimately, we achieve accurate and high-throughput estimations of chromatin structure from Hi-C data, which will be necessary as experimental methodologies, such as single-cell Hi-C, improve.
Overview
The claims and statistics of this paper haven’t been checked yet.
Run the check — free, no account needed. It reads the open-access text and checks the sources it cites.
Integrity signals
Registry
Cites
Statistics
Figures

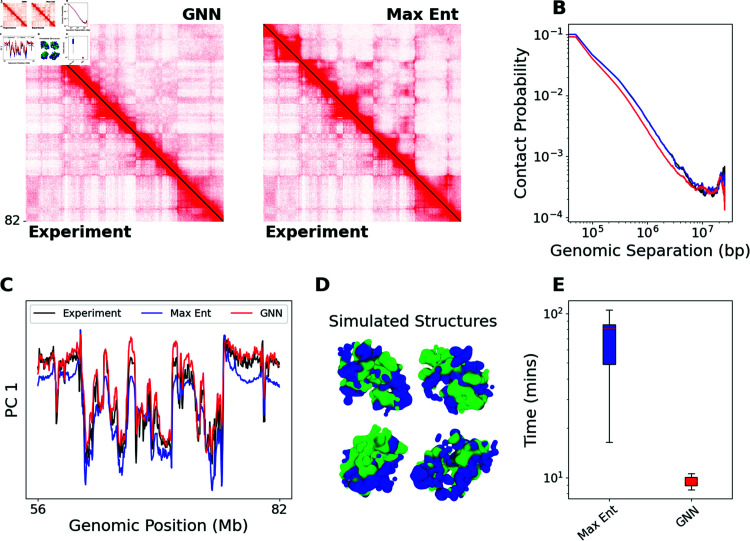
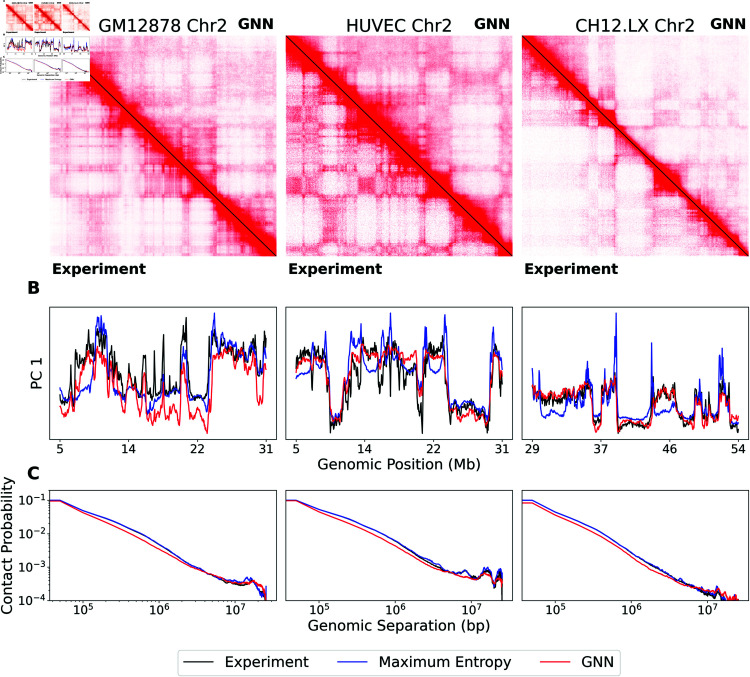
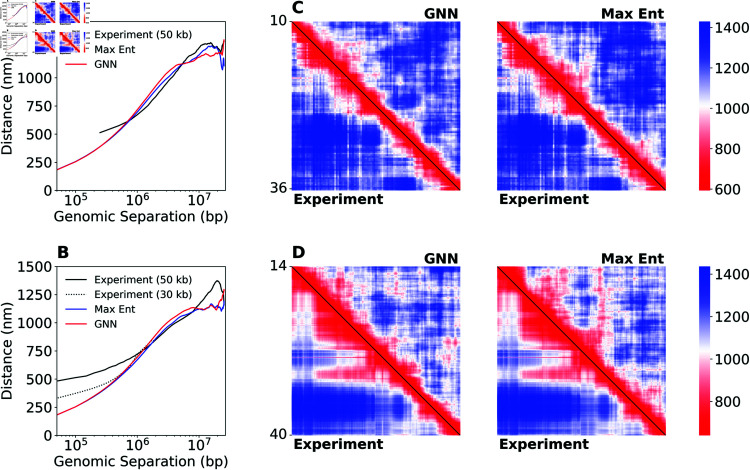
Verification
Claims the paper makes
The claims and statistics of this paper haven’t been checked yet.
Run the check — free, no account needed. It reads the open-access text and checks the sources it cites.
Self-check
Percentages, sums and reported differences re-computed from the paper’s own numbers.
The self-check needs the paper’s full text.
Citations
Cites
Highly accurate protein structure prediction with AlphaFold
Jumper, J., Evans, R., Pritzel, A., Green, T., Figurnov, M., Ronneberger, O., Tunyasuvunakool, K., Bates, R., Žídek, A., Potapenko, A., et al. (2021) · Nature · doi:10.1038/s41586-021-03819-2 · Cited by 43,764
A structural biology community assessment of AlphaFold2 applications
Akdel, M., Pires, D. E. V., Pardo, E. P., Jänes, J., Zalevsky, A. O., Mészáros, B., Bryant, P., Good, L. L., Laskowski, R. A., Pozzati, G., et al. (2022) · Nature Structural & Molecular Biology · doi:10.1038/s41594-022-00849-w · Cited by 675
Research works printed but not linked: 58
- 10.1038/s41467-020-15053-x · DOI
- 10.1093/nar/28.1.235 · DOI · Paper page
- 10.1126/science.aau6020 · DOI · Paper page
- Shaked Brody , Uri Alon , and Eran Yahav . How Attentive are Graph Attention Networks? arXiv, 2022.
- 2020, Language Models are Few-Shot Learners, Advances in neural information processing systems, 33, 1877
- 10.1039/b911646j · DOI
- 10.1021/ma702514v · DOI
- 10.1073/pnas.1613607113 · DOI
- 10.1038/nature11082 · DOI · Paper page
- 10.1016/j.cels.2015.07.012 · DOI
- Aleksander E.P. Durumeric , Nicholas E. Charron , Clark Templeton , Félix Musil , Klara Bonneau , Aldo S. Pasos-Trejo , Yaoyi Chen , Atharva Kelkar , Frank Noé , and Cecilia Clementi . Machine learned coarsegrained protein force-fields: Are we there yet? Current Opinion in Structural Biology, 79, 4 2023. · DOI
- Matthias Fey and Jan Eric Lenssen . Fast Graph Representation Learning with PyTorch Geometric. arXiv, pages 1–9, 3 2019.
- 10.1093/BIB/BBAA290 · DOI
- 10.1021/acs.jctc.0c00355 · DOI
- 10.1038/s41467-022-34464-6 · DOI · Paper page
- Benjamin C Hitz , Jin-Wook Lee , Otto Jolanki , Meenakshi S Kagda , Keenan Graham , Paul Sud , Idan Gabdank , J Seth Strattan , Cricket A Sloan , Timothy Dreszer , Laurence D Rowe , Nikhil R Podduturi , Venkat S Malladi , Esther T Chan , Jean M Davidson , Marcus Ho , Stuart Miyasato , Matt Simison , Forrest Tanaka , Yunhai Luo , Ian Whaling , Eurie L Hong , Brian T Lee , Richard Sandstrom , Eric Rynes , Jemma Nelson , Andrew Nishida , Alyssa Ingersoll , Michael Buckley , Mark Frerker , Daniel S Kim , Nathan Boley , Diane Trout , Alex Dobin , Sorena Rahmanian , Dana Wyman , Gabriela Balderrama-Gutierrez , Fairlie Reese , Neva C Durand , Olga Dudchenko , David Weisz , Suhas S P Rao , Alyssa Blackburn , Dimos Gkountaroulis , Mahdi Sadr , Moshe Olshansky , Yossi Eliaz , Dat Nguyen , Ivan Bochkov , Muhammad Saad Shamim , Ragini Mahajan , Erez Aiden , Tom Gingeras , Simon Heath , Martin Hirst , W James Kent , Anshul Kundaje , Ali Mortazavi , Barbara Wold , and J Michael Cherry . The ENCODE Uniform Analysis Pipelines. bioRxiv, 2023.
- 10.1103/PhysRev.106.620 · DOI · Paper page
- 10.1038/s41580-021-00362-w · DOI
- 10.1038/s41467-022-34464-6 · DOI · Paper page
- Meenakshi S Kagda , Bonita Lam , Casey Litton , Corinn Small , Cricket A Sloan , Emma Spragins , Forrest Tanaka , Ian Whaling , Idan Gabdank , Ingrid Youngworth , J Seth Strattan , Jason Hilton , Jennifer Jou , Jessica Au , Jin-Wook Lee , Kalina Andreeva , Keenan Graham , Khine Lin , Matt Simison , Otto Jolanki , Paul Sud , Pedro Assis , Philip Adenekan , Stuart Miyasato , Weiwei Zhong , Yunhai Luo , Zachary Myers , J Michael Cherry , and Benjamin C Hitz . Data navigation on the ENCODE portal Introduction. arXiv, pages 1–39, 2023.
- 10.1007/s10577-007-1172-8 · DOI
- 10.1002/prot.26237 · DOI · Paper page
- 10.1016/j.bpj.2018.10.032 · DOI
- 10.1126/science.1181369 · DOI · Paper page
- Derek Lim , Joshua Robinson , Lingxiao Zhao , Tess Smidt , Suvrit Sra , Haggai Maron , and Stefanie Jegelka . Sign and Basis Invariant Networks for Spectral Graph Representation Learning. arXiv, pages 1–42, 2022.
- 2021, Multiscale modeling of genome organization with maximum entropy optimization, Journal of Chemical Physics, 155, 1
- 10.1093/nar/gkz1062 · DOI
- 10.1073/pnas.1812268115 · DOI
- 10.1016/j.cell.2020.09.014 · DOI
- 10.1016/j.bpj.2020.03.014 · DOI
- 10.1038/nature12593 · DOI · Paper page
- 2013, Perspective: Coarse-grained models for biomolecular systems, Journal of Chemical Physics, 139, 1
- 10.1038/nature11049 · DOI · Paper page
- 10.1186/s12575-018-0089-2 · DOI
- OpenAI. GPT-4 Technical Report. arXiv, pages 2303–08774, 3 2023.
- Adam Paszke , Sam Gross , Francisco Massa , Adam Lerer , James Bradbury , Gregory Chanan , Trevor Killeen , Zeming Lin , Natalia Gimelshein , Luca Antiga , Alban Desmaison , Andreas Köpf, Edward Yang , Zach DeVito , Martin Raison , Alykhan Tejani , Sasank Chilamkurthy , Benoit Steiner , Lu Fang , Junjie Bai , and Soumith Chintala . PyTorch: An Imperative Style, High-Performance Deep Learning Library. arXiv, pages 1–12, 12 2019.
- 2011, Scikit-learn: Machine Learning in Python, Journal of Machine Learning Research, 12, 2825
- 2009, Theoretically informed coarse grain simulations of polymeric systems, Journal of Chemical Physics, 131, 1
- 2019, Predicting three-dimensional genome organization with chromatin states, PLoS Computational Biology, 15, 1
- 10.1016/j.cell.2017.09.026 · DOI · Paper page
- 10.1016/j.cell.2014.11.021 · DOI · Paper page
- Michael Rubinstein and Ralph H. Colby . Polymer Physics. Oxford University Press, 2003. · DOI · Paper page
- 10.1016/j.bpj.2023.07.017 · DOI
- Ahsan Shehzad , Feng Xia , Senior Member , Shagufta Abid , Ciyuan Peng , Graduate Student Member, Shuo Yu , Dongyu Zhang , and Karin Verspoor . Graph Transformers: A Survey. arXiv, pages 1–23, 2024.
- 10.1038/s41467-023-36412-4 · DOI
- 2023, From Effective Interactions Extracted Using Hi-C Data to Chromosome Structures in Conventional and Inverted Nuclei, PRX Life, 1, 1
- 10.1016/j.cell.2020.07.032 · DOI · Paper page
- 2021, Bottom-Up Coarse-Grained Modeling of DNA, Frontiers in Molecular Biosciences, 8, 1
- Stephan Thaler and Julija Zavadlav . Learning neural network potentials from experimental data via Differentiable Trajectory Reweighting. Nature Communications, 12(1), 12 2021. · DOI
- 10.1038/nature11247 · DOI · Paper page
- Ashish Vaswani , Noam Shazeer , Niki Parmar , Jakob Uszkoreit , Llion Jones , Aidan N. Gomez , Lukasz Kaiser , and Illia Polosukhin . Attention Is All You Need. arXiv, pages 1–15, 6 2017.
- 10.1093/bioinformatics/btx152 · DOI
- 10.1101/gr.220640.117 · DOI · Paper page
- 10.1186/s13059-019-1727-y · DOI · Paper page
- 10.1073/pnas.1506257112 · DOI
- 10.1038/s41587-021-01034-y · DOI
- 10.1016/j.aiopen.2021.01.001 · DOI · Paper page
- 10.1073/pnas.1901423116 · DOI · Paper page
Metadata
- Authors
- Schultz, E. R., Kyhl, S., Willett, R., & de Pablo, J. J.
- Affiliations
- University of Chicago (US)
- Venue
- PLoS Computational Biology
- Publisher
- openRxiv
- Published
- 2024-11-29
- Volume
- 21
- Issue
- 4
- Pages
- e1012912-e1012912
- ISSN
- 1553-734X (ISSN-L)
- PMC
- PMC12005555
- OpenAlex
- W4409311852
- Cited by
- 6
- References
- 2
- Citations by year
- 2026: 4 · 2025: 2
- FWCI
- 1.80
- Type
- journal article
- Language
- en
- Open access
- gold
- doi.org
- Licence
- Locations
- PLoS Computational Biology (publishedVersion, cc-by)
- bioRxiv (Cold Spring Harbor Laboratory) (acceptedVersion, cc-by-nc)
- PubMed Central (publishedVersion, cc-by)
- PubMed (publishedVersion)
- DOAJ (DOAJ: Directory of Open Access Journals) (submittedVersion)
- Knowledge@UChicago (University of Chicago) (submittedVersion)
- University of Chicago (cc-by)
- Funders
- National Science Foundation (2023109)
- Simons Foundation (MP-TMPS- 00005320)
- Division of Physics (PHY2317138)
- Division of Mathematical Sciences (DMS-AWD00000326, DMS-2023109)
- Topics
- Life Sciences › Biochemistry, Genetics and Molecular Biology › Molecular Biology › Genomics and Chromatin Dynamics
- Life Sciences › Biochemistry, Genetics and Molecular Biology › Molecular Biology › Protein Structure and Dynamics
- Life Sciences › Biochemistry, Genetics and Molecular Biology › Molecular Biology › Gene Regulatory Network Analysis
- Keywords
- chromatin structure, 3D genome organization, Hi-C data, graph neural networks, single-cell Hi-C
- MeSH terms
- Machine Learning, Chromatin, Computer Simulation, Humans, Models, Molecular, Polymers, Neural Networks, Computer, Computational Biology
About these checks
Registry, retraction, Cites and statistics results are computed, not judged, with one exception: a printed reference that no index lists is read once by a model before it counts as a citation error. Claims are extracted by a model and kept only when their quote appears verbatim in the text; each cited source is then checked, with a model’s help, for whether it says what the claim relies on. Those verdicts can be wrong — read the claim’s quote and the cited source before relying on one.
Statistics and arithmetic are recomputed, not judged.
Confidence bands are shown only for fields calibrated on our annotated test set. None is calibrated yet, so no band is shown.
What counts as a claim ›How we measure confidence ›How we check this ›
Are you an author, or do you see a problem with this page? Request a review
