

The DOI matches its Crossref record; 1 of the 1 references it cites were found in a registry or an index.
From phenotype to receptor: validating physiological clustering of Escherichia coli phages through comprehensive receptor analysis
Open accessPreprint — published as 10.1128/jvi.01061-25
Abstract
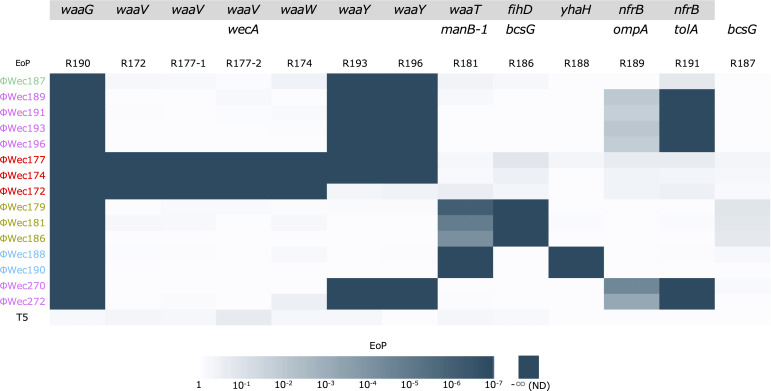
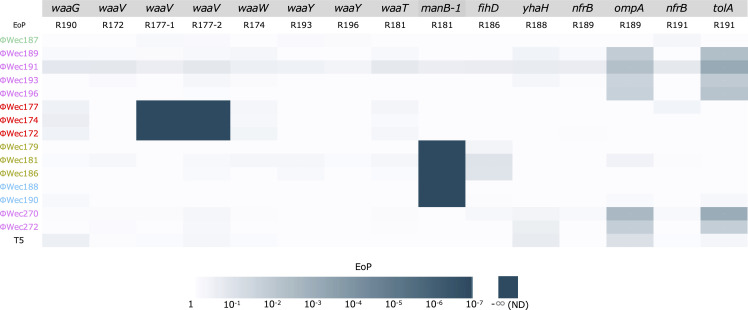
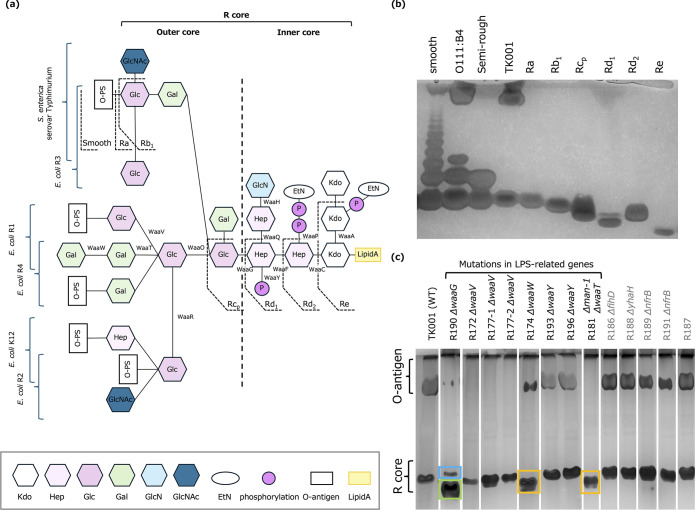
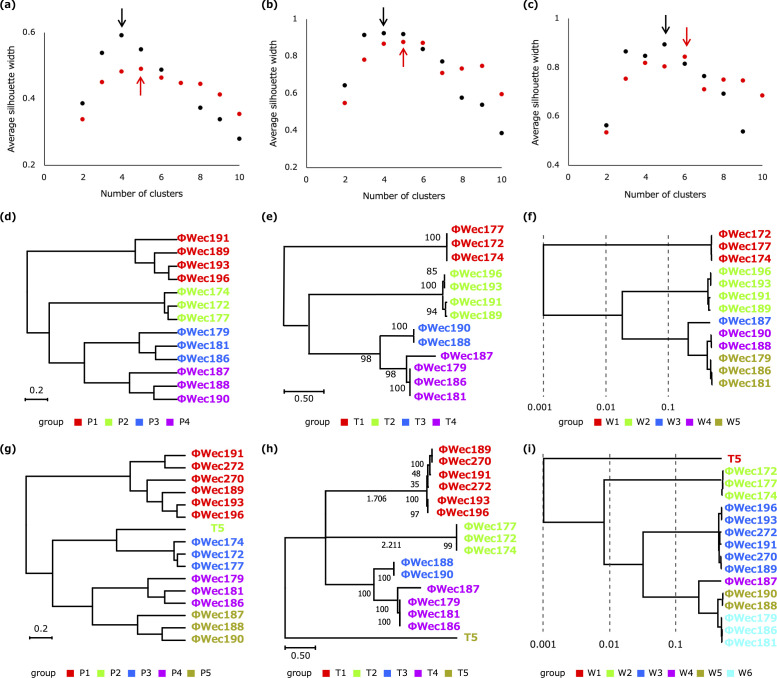
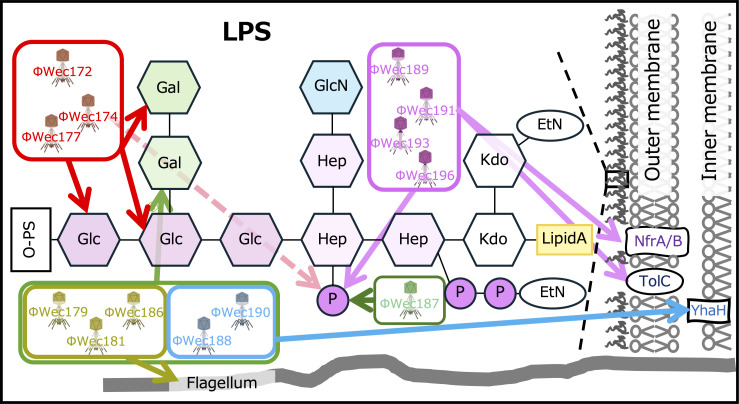
Understanding the relationship between bacteriophage (phage) classification and target receptors is crucial for phage ecology and applied research. In this study, we compared 13 previously isolated Escherichia coli phages based on physiological characteristics, whole-genome sequences, and tail fiber protein phylogenetics. We improved our previously proposed physiological clustering method by optimizing the bacterial panel for host range assessment, implementing appropriate distance metrics for mixed data types, and applying silhouette coefficient analysis for objective determination of optimal cluster numbers. We combined genomic analysis and lipopolysaccharide (LPS) structural analysis of phage-resistant E. coli strains to identify target receptors of the phages. Complementation experiments further confirmed the direct involvement of identified genes in phage reception. The results revealed that phylogenetically distinct E. coli phages target different sites in the LPS R-core region (modified by WaaV, WaaW, WaaT, and WaaY), membrane proteins (NfrB, TolA, YhaH), or flagella. Our analysis revealed that, subtle chemical modifications of LPS (such as Heptose phosphorylation) were shown to be important for E. coli phage recognition. Furthermore, physiological characteristics, tail fiber phylogenetics, and whole genome analysis independently classified the phages with high correlation to target receptor specificity. The addition of three phages with known receptors further validated our approach. Our results suggest that grouping based on physiological characteristics (such as lysis dynamics and host range) and genotypes (tail fiber phylogenetics or whole genome analysis) independently classified phages with high correlation to target receptor specificity. Here, we elucidated the diversity and specificity of E. coli phage target receptors, providing new insights into the classification of E. coli phages and phage-host interactions. Importance: Phage therapy is gaining attention as an alternative treatment for antibiotic-resistant bacteria. Developing effective phage cocktails requires combining phages with different target receptors, but traditional methods for identifying target receptors are labor-intensive. This study demonstrates that E. coli phages targeting the TK001 strain with different target receptors can be grouped based on their physiological characteristics, tail fiber sequences, or whole genomes. Our approach was enhanced through systematic bacterial panel selection for host range assessment, optimized distance metrics for physiological characteristics, and objective cluster determination using silhouette coefficient analysis for all three classifications. This insight can be used to more efficiently create diverse phage cocktails. Additionally, we identified phages targeting diverse sites, including different regions of LPS, membrane proteins, and flagella. These findings deepen our understanding of phage host recognition mechanisms, enabling the rapid preparation of effective phage cocktails and contributing to new advancements in bacterial infection treatment.
Overview
The claims and statistics of this paper haven’t been checked yet.
Run the check — free, no account needed. It reads the open-access text and checks the sources it cites.
Integrity signals
Registry
Cites
Statistics
Figures
Verification
Claims the paper makes
The claims and statistics of this paper haven’t been checked yet.
Run the check — free, no account needed. It reads the open-access text and checks the sources it cites.
Self-check
Percentages, sums and reported differences re-computed from the paper’s own numbers.
The self-check needs the paper’s full text.
Citations
Cites
Highly accurate protein structure prediction with AlphaFold
Jumper, J., Evans, R., Pritzel, A., Green, T., Figurnov, M., Ronneberger, O., Tunyasuvunakool, K., Bates, R., Žídek, A., Potapenko, A., et al. (2021) · Nature · doi:10.1038/s41586-021-03819-2 · Cited by 43,764
Research works printed but not linked: 43
- 10.1128/jvi.01861-19 · DOI
- 10.1007/s00253-003-1438-9 · DOI
- 10.3389/fmicb.2020.00327 · DOI
- 10.1263/jbb.100.280 · DOI
- 10.1016/j.fm.2018.08.011 · DOI
- 2017, Development and use of personalized bacteriophage-based therapeutic cocktails to treat a patient with a disseminated resistant Acinetobacter baumannii infection, Antimicrob Agents Chemother, 61, e00954
- 10.1016/j.virusres.2021.198596 · DOI
- 10.1038/s41598-016-0001-8 · DOI · Paper page
- Gröschel MI , Meehan CJ , Barilar I , Diricks M , Gonzaga A , Steglich M , Conchillo-Solé O , Scherer IC , Mamat U , Luz CF , De Bruyne K , Utpatel C , Yero D , Gibert I , Daura X , Kampmeier S , Rahman NA , Kresken M , van der Werf TS , Alio I , Streit WR , Zhou K , Schwartz T , Rossen JWA , Farhat MR , Schaible UE , Nübel U , Rupp J , Steinmann J , Niemann S , Kohl TA. 2020. The phylogenetic landscape and nosocomial spread of the multidrug-resistant opportunist Stenotrophomonas maltophilia . Nat Commun 11. · DOI
- 10.1089/phage.2023.0016 · DOI
- Kaneko T , Uchiyama J , Osaka T , Tsuneda S . 2025. Novel Escherichia coli Phages Representing a Distinct Genus within Stephanstirmvirinae: Genome and Host Range Characteristics. bioRxiv 2025.02.05.636633. · DOI
- 10.1128/jb.135.1.190-197.1978 · DOI
- 10.1128/JB.00106-09 · DOI
- 1999, The structures of the carbohydrate backbones of the lipopolysaccharides from Escherichia coli rough mutants F470 (R1 core type) and F576 (R2 core type), Eur J Biochem, 261, 629, 10.1046/j.1432-1327.1999.00280.x · DOI
- 10.1089/phage.2024.0023 · DOI
- 10.1074/jbc.M111.291799 · DOI
- 2014, The Molecular Architecture of the Bacteriophage T4 Neck, J Mol Biol, 23, 1
- 2021, A Novel Locally c-di-GMP-Controlled Exopolysaccharide Synthase Required for Bacteriophage N4 Infection of Escherichia coli, MBio, 12, e03249
- 10.1093/gigascience/gix120 · DOI
- 10.1089/cmb.2012.0021 · DOI
- 10.1093/bioinformatics/btu153 · DOI
- 10.1371/journal.pone.0162755 · DOI
- Walker BJ , Abeel T , Shea T , Priest M , Abouelliel A , Sakthikumar S , Cuomo CA , Zeng Q , Wortman J , Young SK , Earl AM . 2014. Pilon: An integrated tool for comprehensive microbial variant detection and genome assembly improvement. PLoS One 9. · DOI
- 10.1186/s12859-016-1452-4 · DOI
- 10.1038/S41592-022-01488-1 · DOI · Paper page
- 10.1038/S41586-024-07487-W · DOI · Paper page
- 10.1002/jcc.21256 · DOI
- 10.1016/j.jmb.2015.11.006 · DOI
- 10.1002/PRO.3711 · DOI
- 10.1002/pro.4172 · DOI
- 1983, Chemistry and immunochemistry of bacterial lipopolysaccharides as cell wall antigens and endotoxins, Prog Allergy, 33, 9
- 10.1016/S0021-9673(01)83593-7 · DOI
- 1990, Modification of the silver staining technique to detect lipopolysaccharide in polyacrylamide gels, J Clin Microbiol, 28, 2627, 10.1128/jcm.28.12.2627-2631.1990 · DOI
- 10.3389/fmicb.2015.00001 · DOI
- 2006, Construction of Escherichia coli K-12 in-frame, single-gene knockout mutants[: the Keio collection, Mol Syst Biol, 2006, 0008
- Yamamoto N , Nakahigashi K , Nakamichi T , Yoshino M , Takai Y , Touda Y , Furubayashi A , Kinjyo S , Dose H , Hasegawa M , Datsenko KA , Nakayashiki T , Tomita M , Wanner BL , Mor H. 2009. Update on the Keio collection of Escherichia coli single-gene deletion mutants. Mol Syst Biol 5. · DOI
- 10.1101/gr.074492.107 · DOI
- 10.1186/1471-2164-9-1 · DOI
- 10.1093/molbev/msy096 · DOI
- 10.1093/bioinformatics/btx157 · DOI
- Bolduc B , Jang H Bin , Doulcier G , You Z , Roux S , Sullivan MB . 2017. vConTACT[: an iVirus tool to classify double-stranded DNA viruses that infect Archaea and Bacteria 1–26. · DOI
- 1971, Cytoscape: A Software Environment for Integrated Models, Genome Res, 13, 426
- 10.1039/C5AY02550H · DOI
Metadata
- Authors
- Kaneko, T., Osaka, T., Inagaki, M., Habe, K., Okabe, T., & Tsuneda, S.
- Affiliations
- Waseda University (JP)
- Tokyo Women's Medical University (JP)
- Mie University (JP)
- Corresponding author
- Tsuneda, Satoshi
- Venue
- Journal of Virology
- Publisher
- openRxiv
- Published
- 2024-11-29
- Volume
- 99
- Issue
- 10
- Pages
- e0106125-e0106125
- ISSN
- 0022-538X (ISSN-L)
- PMC
- PMC12548472
- OpenAlex
- W4414125546
- Cited by
- 5
- References
- 1
- Citations by year
- 2026: 3 · 2025: 2
- FWCI
- 2.63
- Type
- journal article
- Language
- en
- Open access
- diamond
- doi.org
- Licence
- Locations
- Journal of Virology (publishedVersion, cc-by)
- bioRxiv (Cold Spring Harbor Laboratory) (acceptedVersion, cc-by-nc-nd)
- Europe PMC (PubMed Central) (publishedVersion, cc-by)
- PubMed (publishedVersion)
- DOAJ (DOAJ: Directory of Open Access Journals) (submittedVersion, cc-by-sa)
- Funders
- Waseda University (2022C-160)
- Topics
- Life Sciences › Immunology and Microbiology › Virology › Bacteriophages and microbial interactions
- Life Sciences › Biochemistry, Genetics and Molecular Biology › Genetics › Bacterial Genetics and Biotechnology
- Life Sciences › Biochemistry, Genetics and Molecular Biology › Genetics › Evolution and Genetic Dynamics
- Keywords
- Escherichia coli bacteriophages, phage-host interactions, phage classification, host range, TolA, flagella, phage therapy
- MeSH terms
- Coliphages, Escherichia coli, Lipopolysaccharides, Phenotype, Phylogeny, Receptors, Virus, Genome, Viral, Escherichia coli Proteins, Host Specificity
About these checks
Registry, retraction, Cites and statistics results are computed, not judged, with one exception: a printed reference that no index lists is read once by a model before it counts as a citation error. Claims are extracted by a model and kept only when their quote appears verbatim in the text; each cited source is then checked, with a model’s help, for whether it says what the claim relies on. Those verdicts can be wrong — read the claim’s quote and the cited source before relying on one.
Statistics and arithmetic are recomputed, not judged.
Confidence bands are shown only for fields calibrated on our annotated test set. None is calibrated yet, so no band is shown.
What counts as a claim ›How we measure confidence ›How we check this ›
Are you an author, or do you see a problem with this page? Request a review
How to cite
Cite CoChat for the checks on this page, and the paper for its own findings.
- This page
- CoChat. (2026). Citation check: From phenotype to receptor: validating physiological clustering of Escherichia coli phages through comprehensive receptor analysis. https://app.cochat.ai/papers/10.1101/2024.11.29.626071
- The paper
- Kaneko, T., Osaka, T., Inagaki, M., Habe, K., Okabe, T., & Tsuneda, S. (2024). From phenotype to receptor: validating physiological clustering of Escherichia coli phages through comprehensive receptor analysis. Journal of Virology. https://doi.org/10.1101/2024.11.29.626071
