PreprintCited by 6vaccines and immunoinformatics approachesProtein Structure and DynamicsMachine Learning in Bioinformatics

The DOI matches its Crossref record; 1 of the 1 references it cites were found in a registry or an index.

A novel decoding strategy for ProteinMPNN to design with less MHC Class I immune-visibility

Open access
Gasser, Hans-Christof, Rajan, Ajitha, Alfaro, Javier A.·2025·Computational and Structural Biotechnology Journal

Preprint — published as 10.1016/j.csbj.2025.07.055

Abstract

Due to their versatility and diverse production methods, proteins have attracted a lot of interest for industrial as well as therapeutic applications. Designing new therapeutics requires careful consideration of immune responses, particularly the cytotoxic T-lymphocyte (CTL) reaction to intra-cellular proteins. In this study, we introduce CAPE-Beam , a novel decoding strategy for the established ProteinMPNN protein design model. Our approach minimizes CTL immunogenicity risk by limiting designs to only consist of kmers that are either predicted not to be presented to CTLs or are subject to central tolerance. We compare CAPE-Beam to greedily sampling from ProteinMPNN and CAPE-MPNN . We find that our novel decoding strategy can produce structurally similar proteins while incorporating more human like kmers. This significantly lowers CTL immunogenicity risk in precision medicine, and represents a key step towards reducing this risk in protein therapeutics targeting a wider patient population.

Overview

The claims and statistics of this paper haven’t been checked yet.

Run the check — free, no account needed. It reads the open-access text and checks the sources it cites.

A few free checks a day · papers already verified open instantly · results are public

Integrity signals

Registry

Crossref · 10.1101/2025.04.14.648837

Cites

1 of 1 references verified0 citation errors · 0 not checkable

Statistics

Figures

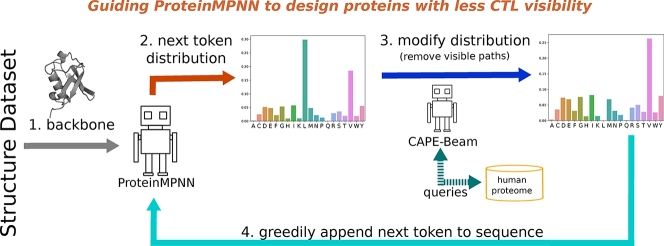
Graphical abstract
Graphical abstract CC BY · PubMed Central
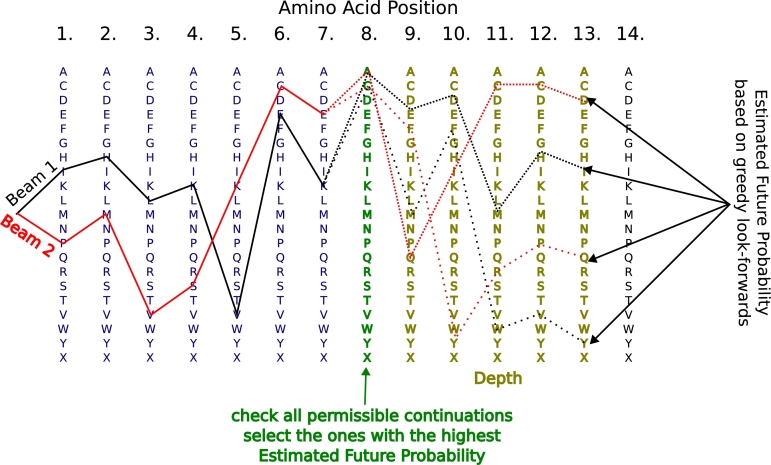
Fig. 1 Protein sampling: AAs are added to the protein sequence one after the other. At each newly sampled position (green), all possible extensions are checked for permissibility. For each permissible extensions, a single permissible forward-looking continuation (illustrated as dashed lines) is greedily sampled for up to depth steps to estimate its future probability. For every beam (e.g., Beam 1 in black and Beam 2 in red), there will be up to 21 of those. The width candidate extensions with the highest estimated future probability are retained and expanded in the next step. This process continues iteratively until all residues have been determined.
Fig. 1 Protein sampling: AAs are added to the protein sequence one after the other. At each newly sampled position (green), all possible extensions are checked for permissibility. For each permissible extensions, a single permissible forward-looking continuation (illustrated as dashed lines) is greedily sampled for up to depth steps to estimate its future probability. For every beam (e.g., Beam 1 in black and Beam 2 in red), there will be up to 21 of those. The width candidate extensions with the highest estimated future probability are retained and expanded in the next step. This process continues iteratively until all residues have been determined.CC BY · PubMed Central
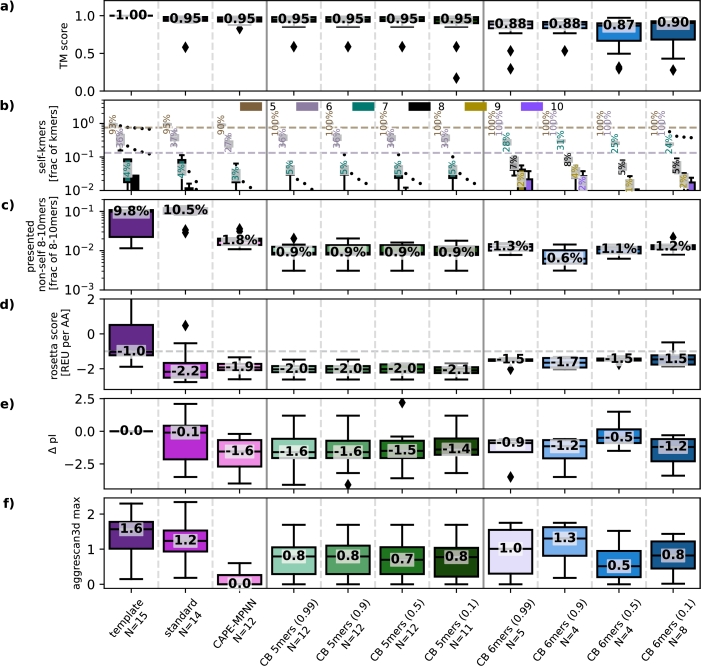
Fig. 2 Structural similarity, CTL reaction risk and molecular properties (validation set): These boxplots show metrics based on the PDB validation set template structures as well as the corresponding predicted structures of generated designs (see Section 4.4.1). The numbers on the plots show the median values. Except for a), all the charts only consider designs that have a TM-score above 0.9. The number of qualifying designs per source can be found as N under its name. a) shows the TM-score between predicted structures and the corresponding template proteins. We see that enforcing longer self-kmers or (less so) applying stronger penalties for non-self kmers (i.e., lower non_self_prob_factor) tends to reduce structural fidelity. b) Only for non-human proteins, this plot shows the proportion of 5-10mers found in the human genome. The dashed background lines represent expected frequencies if kmers were uniformly sampled from standard AAs. While ProteinMPNN or CAPE-MPNN designs introduce a significant number of non-self 5mers, CAPE-Beam was able to enforce self-5mers in most designs while still achieving predicted TM-scores above 0.9. In many cases, CAPE-Beam succeeds in meeting this criterion even when enforcing self-6mers. c) Presented non-self peptides will potentially be immunogenic. CAPE-Beam consistently generates the fewest such peptides. With regards to stability d), the best designs seem to be generated by the standard way of sampling from ProteinMPNN. However, most of the considered designs were well within the typical range for refined structures. Plot e) shows that both deimmunization methods produced designs that tend to have lower pIs than their templates. With regards to the aggregation scores f) all designs seem to be in the range or better than the original templates.
Fig. 2 Structural similarity, CTL reaction risk and molecular properties (validation set): These boxplots show metrics based on the PDB validation set template structures as well as the corresponding predicted structures of generated designs (see Section 4.4.1). The numbers on the plots show the median values. Except for a), all the charts only consider designs that have a TM-score above 0.9. The number of qualifying designs per source can be found as N under its name. a) shows the TM-score between predicted structures and the corresponding template proteins. We see that enforcing longer self-kmers or (less so) applying stronger penalties for non-self kmers (i.e., lower non_self_prob_factor) tends to reduce structural fidelity. b) Only for non-human proteins, this plot shows the proportion of 5-10mers found in the human genome. The dashed background lines represent expected frequencies if kmers were uniformly sampled from standard AAs. While ProteinMPNN or CAPE-MPNN designs introduce a significant number of non-self 5mers, CAPE-Beam was able to enforce self-5mers in most designs while still achieving predicted TM-scores above 0.9. In many cases, CAPE-Beam succeeds in meeting this criterion even when enforcing self-6mers. c) Presented non-self peptides will potentially be immunogenic. CAPE-Beam consistently generates the fewest such peptides. With regards to stability d), the best designs seem to be generated by the standard way of sampling from ProteinMPNN. However, most of the considered designs were well within the typical range for refined structures. Plot e) shows that both deimmunization methods produced designs that tend to have lower pIs than their templates. With regards to the aggregation scores f) all designs seem to be in the range or better than the original templates.CC BY · PubMed Central
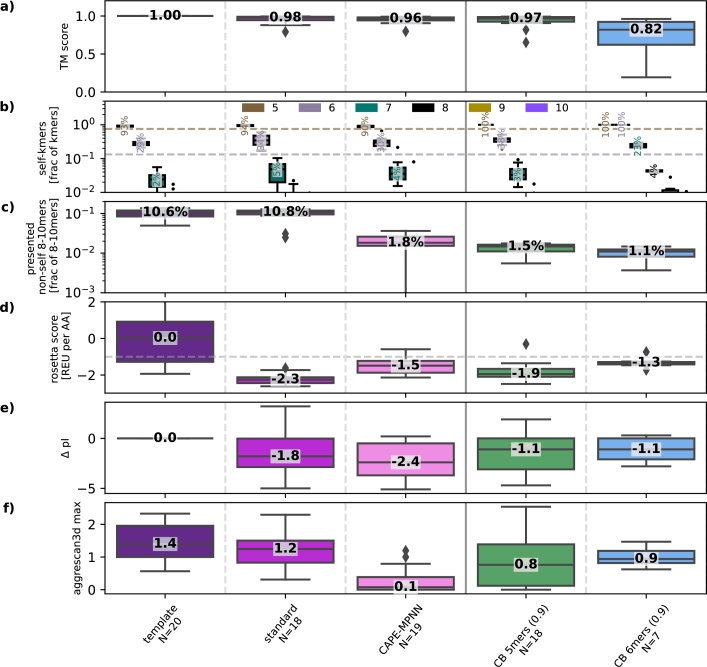
Fig. 3 Structural similarity, CTL reaction risk and molecular properties (test set): This figure shows the same information as Fig. 2 - only for the test set.
Fig. 3 Structural similarity, CTL reaction risk and molecular properties (test set): This figure shows the same information as Fig. 2 - only for the test set.CC BY · PubMed Central
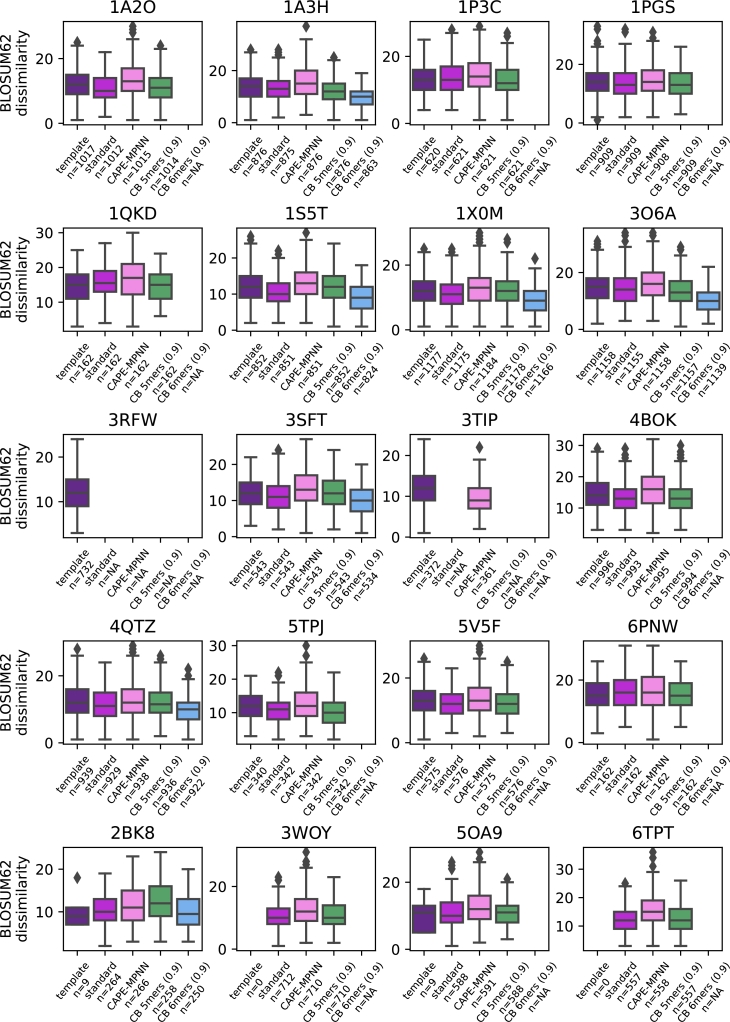
Fig. 4 CB 6mers (0.9) generated 8-10mers most similar to the self-proteome for non-human proteins in the test set: Dissimilarity to the human proteome has been shown to be linked to immunogenicity [7], [8], [9]. This figure shows the distribution of our BLOSUM62 dissimilarity scores (see Section 4.4.2) for non-self 8-10mers in the 20 test set proteins. The number n shown below each source label indicates how many 8-10mers are non-self. Only designs with a predicted TM-score above 0.9 are included; sources without any such designs are marked with n = NA. We find that enforcing all 6mers to come from the human proteome results in the lowest dissimilarity scores for non-human proteins — indicating increased mimicry of self-peptides. An exception is observed for human proteins or their homologs (e.g., 2BK8, 3WOY, 5OA9, 6TPT), where the original templates naturally contain few non-self kmers, and those that exist tend to be more similar by definition. Still, CAPE-Beam 6mers consistently generate less dissimilar kmers than both the 5mer constraint and the standard decoding approach.
Fig. 4 CB 6mers (0.9) generated 8-10mers most similar to the self-proteome for non-human proteins in the test set: Dissimilarity to the human proteome has been shown to be linked to immunogenicity [7], [8], [9]. This figure shows the distribution of our BLOSUM62 dissimilarity scores (see Section 4.4.2) for non-self 8-10mers in the 20 test set proteins. The number n shown below each source label indicates how many 8-10mers are non-self. Only designs with a predicted TM-score above 0.9 are included; sources without any such designs are marked with n = NA. We find that enforcing all 6mers to come from the human proteome results in the lowest dissimilarity scores for non-human proteins — indicating increased mimicry of self-peptides. An exception is observed for human proteins or their homologs (e.g., 2BK8, 3WOY, 5OA9, 6TPT), where the original templates naturally contain few non-self kmers, and those that exist tend to be more similar by definition. Still, CAPE-Beam 6mers consistently generate less dissimilar kmers than both the 5mer constraint and the standard decoding approach.CC BY · PubMed Central
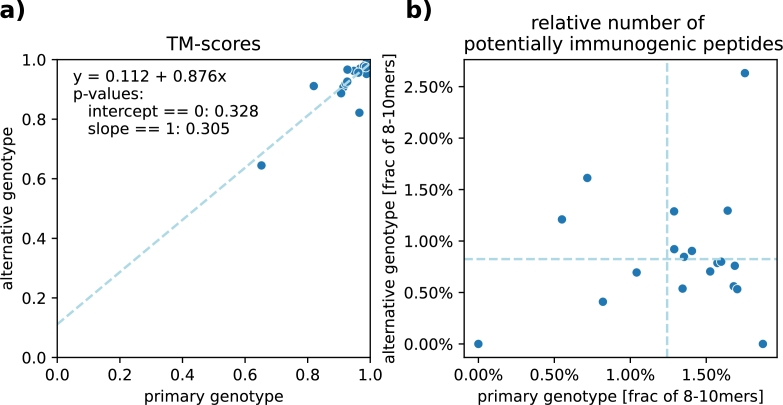
Fig. 5 Comparing structural similarity and reduction of potentially immunogenic peptides in CAPE-Beam designs across two MHC-I genotypes: Every dot in this figure represents two designs generated for the same test set template – one using the primary genotype and one using the alternative genotype. The x-axis displays the metric's value for the primary genotype design, while the y-axis shows the value for the alternative genotype design. a) compares the predicted TM-scores (see Fig. 3a). The strong correlation indicates that structural quality is largely preserved across genotypes. The dotted line shows the linear regression. b) compares the fraction of presented non-self 8-10mers (see Fig. 3c). The two dotted lines show the mean values. We observe that this fraction is similarly reduced for both genotypes, suggesting that CAPE-Beam effectively lowers immunogenic risk regardless of genotype.
Fig. 5 Comparing structural similarity and reduction of potentially immunogenic peptides in CAPE-Beam designs across two MHC-I genotypes: Every dot in this figure represents two designs generated for the same test set template – one using the primary genotype and one using the alternative genotype. The x-axis displays the metric's value for the primary genotype design, while the y-axis shows the value for the alternative genotype design. a) compares the predicted TM-scores (see Fig. 3a). The strong correlation indicates that structural quality is largely preserved across genotypes. The dotted line shows the linear regression. b) compares the fraction of presented non-self 8-10mers (see Fig. 3c). The two dotted lines show the mean values. We observe that this fraction is similarly reduced for both genotypes, suggesting that CAPE-Beam effectively lowers immunogenic risk regardless of genotype.CC BY · PubMed Central

Verification

Claims the paper makes

The claims and statistics of this paper haven’t been checked yet.

Run the check — free, no account needed. It reads the open-access text and checks the sources it cites.

A few free checks a day · papers already verified open instantly · results are public

Self-check

Percentages, sums and reported differences re-computed from the paper’s own numbers.

The self-check needs the paper’s full text.

Citations

Cites

Research works printed but not linked: 26

  1. 10.1021/acs.jctc.7b00125 · DOI · Paper page
  2. Bootwala, A. , An, H. H. , Franklin, M. W. , Manning, B. J. , Xu, L. Y. , Panchal, S. , Garlick, J. D. , Baral, R. , Hudson, M. E. , Grigoryan, G. , Murakami, M. A. , Hopson, K. , and Leventhal, D. S. (2022). Protein re-surfacing of E. coli L-Asparaginase to evade pre-existing anti-drug antibodies and hypersensitivity responses. Frontiers in Immunology, 13. · DOI
  3. 10.1038/mt.2014.235 · DOI
  4. 10.4049/jimmunol.178.9.5727 · DOI
  5. 10.1126/science.add2187 · DOI · Paper page
  6. Evans, R. , O’Neill, M. , Pritzel, A. , Antropova, N. , Senior, A. , Green, T. , Žídek, A. , Bates, R. , Blackwell, S. , Yim, J. , Ronneberger, O. , Bodenstein, S. , Zielinski, M. , Bridgland, A. , Potapenko, A. , Cowie, A. , Tunyasuvunakool, K. , Jain, R. , Clancy, E. , Kohli, P. , Jumper, J. , and Hassabis, D. (2021). Protein complex prediction with AlphaFold-Multimer. · DOI · Paper page
  7. 10.1371/journal.pone.0020161 · DOI
  8. 10.1093/protein/gzaf003 · DOI
  9. 10.1016/j.immuno.2024.100035 · DOI
  10. Hsu, C. , Verkuil, R. , Liu, J. , Lin, Z. , Hie, B. , Sercu, T. , Lerer, A. , and Rives, A. (2022). Learning inverse folding from millions of predicted structures. In Proceedings of the 39th International Conference on Machine Learning, pages 8946–8970. PMLR. · DOI
  11. 10.1093/BIOINFORMATICS/BTZ143 · DOI
  12. 10.1016/B978-0-12-381270-4.00019-6 · DOI
  13. Lowerre, B. T. (1976). The Harpy Speech Recognition System. PhD thesis, Carnegie Mellon University, Pennsyl-vania. · DOI
  14. 10.1038/s42256-023-00787-2 · DOI
  15. 10.1056/NEJMoa1000228 · DOI · Paper page
  16. 10.1038/s41592-022-01488-1 · DOI · Paper page
  17. Murphy, K. and Weaver, C. (2017). Janeway’s Immunobiology. Garland Science, 9th edition. · DOI
  18. 10.1093/nar/gkaa379 · DOI · Paper page
  19. 10.1016/j.cels.2019.08.009 · DOI
  20. Shi, C. , Yang, H. , Cai, D. , Zhang, Z. , Wang, Y. , Yang, Y. , and Lam, W. (2024). A Thorough Examination of Decoding Methods in the Era of LLMs. · DOI
  21. 10.1093/protein/gzab029 · DOI
  22. 10.1038/s41586-023-06415-8 · DOI · Paper page
  23. Wu, K. E. , Yang, K. K. , van den Berg, R. , Zou, J. , Lu, A. X. , and Amini, A. P. (2023). Protein structure generation via folding diffusion. · DOI
  24. 10.1021/acs.jcim.1c00056 · DOI
  25. 10.1093/nar/gki524 · DOI · Paper page
  26. 10.1073/pnas.1908723117 · DOI

Metadata

Authors
Gasser, H.-C., Rajan, A., & Alfaro, J. A.
Affiliations
  • University of Edinburgh (GB)
  • University of Calgary (CA)
Corresponding author
  • Gasser, Hans-Christof
  • Rajan, Ajitha
  • Alfaro, Javier A.
Venue
Computational and Structural Biotechnology Journal
Publisher
openRxiv
Published
2025-04-18
Volume
27
Pages
3693-3703
ISSN
2001-0370 (ISSN-L)
OpenAlex
W4413148564
Cited by
6
References
1
Citations by year
2026: 6
FWCI
1.80
Type
journal article
Language
en
Open access
Locations
  • Computational and Structural Biotechnology Journal (publishedVersion, cc-by)
  • bioRxiv (Cold Spring Harbor Laboratory) (acceptedVersion, cc-by)
  • Europe PMC (PubMed Central) (publishedVersion, cc-by)
  • PubMed Central (publishedVersion, cc-by)
  • PubMed (publishedVersion)
  • Edinburgh Research Explorer (University of Edinburgh) (submittedVersion, cc-by)
  • DOAJ (DOAJ: Directory of Open Access Journals) (submittedVersion, cc-by-sa)
Funders
  • UK Research and Innovation (EP/S02431X/1)
  • Royal Academy of Engineering (ICRF2122-5-133)
  • Royal Society
  • University of Edinburgh
  • Horizon 2020 Framework Programme
  • HORIZON EUROPE Framework Programme
  • Engineering and Physical Sciences Research Council (EP/S02431X/1)
Topics
  • Life Sciences › Biochemistry, Genetics and Molecular Biology › Molecular Biology › vaccines and immunoinformatics approaches
  • Life Sciences › Biochemistry, Genetics and Molecular Biology › Molecular Biology › Protein Structure and Dynamics
  • Life Sciences › Biochemistry, Genetics and Molecular Biology › Molecular Biology › Machine Learning in Bioinformatics
Keywords
protein design, ProteinMPNN, decoding strategies, cytotoxic T lymphocytes, central tolerance, self-peptides, therapeutic proteins, immune evasion

About these checks

Registry, retraction, Cites and statistics results are computed, not judged, with one exception: a printed reference that no index lists is read once by a model before it counts as a citation error. Claims are extracted by a model and kept only when their quote appears verbatim in the text; each cited source is then checked, with a model’s help, for whether it says what the claim relies on. Those verdicts can be wrong — read the claim’s quote and the cited source before relying on one.

Statistics and arithmetic are recomputed, not judged.

Confidence bands are shown only for fields calibrated on our annotated test set. None is calibrated yet, so no band is shown.

What counts as a claim ›How we measure confidence ›How we check this ›

Are you an author, or do you see a problem with this page? Request a review