Student or educator? Sign up with your school email and get 6 months of Pro free.
PreprintCited by 1Chemokine receptors and signalingReceptor Mechanisms and SignalingCytokine Signaling Pathways and Interactions

The DOI matches its Crossref record; 1 of the 1 references it cites were found in a registry or an index.

Rules of engagement: determinants of chemokine receptor activation and selectivity by CCL27 and CCL28

Open access

Preprint — published as 10.1016/j.jbc.2025.110736 · Paper page

Abstract

The distinct functional roles of chemokines CCL27 and CCL28 in epithelial immunity of skin and mucosal tissues, respectively, are coordinated by their shared receptor, CCR10 and the CCL28-specific receptor, CCR3. In this study, we conducted structure-function studies focused on the N-termini of these two chemokines to identify determinants of receptor activation, internalization and binding specificity. Deletion of two N-terminal residues of CCL27 resulted in a CCR10 antagonist, highlighting the critical roles of these residues in driving receptor pharmacology. Extension with a Phe produced a superagonist by occupying an available subpocket in the receptor binding site. Swapping the N-terminus of CCL28 onto the CCL27 globular domain (NT28-CCL27) also resulted in a superagonist of CCR10, but the opposite swap (NT27-CCL28) showed equivalent or reduced activity compared to WT CCL28, indicating that the CCL28 N-terminus is a stronger driver of CCR10 signaling. The effect of these and other mutations were rationalized by AlphaFold models of the CCR10 complexes. AlphaFold modeling also revealed that the reduced size of the binding pocket, and more basic nature of the N-terminus and extracellular loops of CCR3 compared to CCR10, contribute to its specificity for CCL28 while CCR10 accommodates both ligands. The overall basic nature of CCL28 also contributes to its high affinity for glycosaminoglycans, which is likely important for its retention in mucosal tissues. These data illustrate the modular compositions of these chemokines that has evolved to achieve overlapping but non-redundant functions, and the exploitation of this modular nature to produce engineered chemokines for probing or targeting CCR10 in disease contexts.

Overview

The claims and statistics of this paper haven’t been checked yet.

Run the check — free, no account needed. It reads the open-access text and checks the sources it cites.

A few free checks a day · papers already verified open instantly · results are public

Integrity signals

Registry

Crossref · 10.1101/2025.05.27.656466

Cites

1 of 1 references verified0 citation errors · 0 not checkable

Statistics

Figures

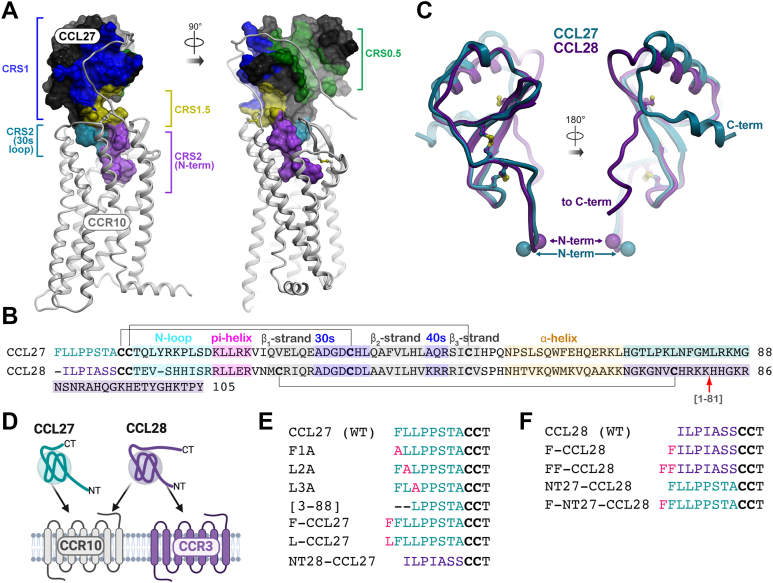
Figure 1 Study rationale for the CCL27/CCL28 structure-function investigation.A, general architecture of receptor–chemokine complexes, illustrated by a complex of CCR10 and CCL27. The complex is shown in two orientations; the receptor is shown as white ribbons and the chemokine as a surface mesh, with key interaction epitopes color-coded and labeled. B, sequence alignment of CCL27 and CCL28 where the N-terminal residues are colored teal and purple, respectively, and characteristic chemokine features labeled accordingly. Disulfide bonds are indicated by black lines, the CCL28 C-terminal truncation mutant is indicated by a red arrow (residue 81 of CCL28) and the extended C-terminal domains are highlighted. C, overlay of structural models of CCL27 (teal) and CCL28 (purple). Chemokines are shown as ribbons, in two orientations, disulfide bonds as sticks, and the N and C termini are labeled. D, cartoon depicting CCL27 specificity for CCR10 and CCL28 for CCR3 and CCR10. E, sequences of WT and N terminally modified mutants of CCL27 and (F) CCL28. Disulfide bonded Cys residues are bolded. CCR, CC chemokine receptor.
Figure 1 Study rationale for the CCL27/CCL28 structure-function investigation.A, general architecture of receptor–chemokine complexes, illustrated by a complex of CCR10 and CCL27. The complex is shown in two orientations; the receptor is shown as white ribbons and the chemokine as a surface mesh, with key interaction epitopes color-coded and labeled. B, sequence alignment of CCL27 and CCL28 where the N-terminal residues are colored teal and purple, respectively, and characteristic chemokine features labeled accordingly. Disulfide bonds are indicated by black lines, the CCL28 C-terminal truncation mutant is indicated by a red arrow (residue 81 of CCL28) and the extended C-terminal domains are highlighted. C, overlay of structural models of CCL27 (teal) and CCL28 (purple). Chemokines are shown as ribbons, in two orientations, disulfide bonds as sticks, and the N and C termini are labeled. D, cartoon depicting CCL27 specificity for CCR10 and CCL28 for CCR3 and CCR10. E, sequences of WT and N terminally modified mutants of CCL27 and (F) CCL28. Disulfide bonded Cys residues are bolded. CCR, CC chemokine receptor.CC BY · PubMed Central
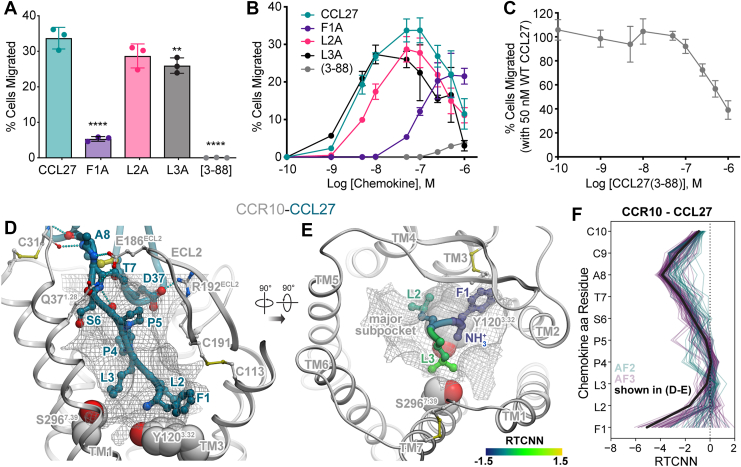
Figure 2 Identification of N terminally modified CCL27 mutants that function as CCR10 antagonists.A, cell migration of WT CCL27 and N-terminal mutants with CCR10-expressing L1.2 cells at 50 nM (average concentration for maximal migration of WT CCL27); data shown are representative (mean ± SD) of three independent experiments performed in technical triplicates. Statistical analysis was performed by ordinary one-way ANOVA with post hoc Dunnett’s multiple comparisons test (∗∗∗∗p < 0.0001; ∗∗p < 0.01; CCL27: L2A, p = 0.0673). B, migration across a broad chemokine concentration range (0.1 nM to 1 μM), plotted as the percent of cells migrated relative to maximal migration (i.e., no filter). Shown are representative data (mean ± SD) of three independent experiments performed in technical triplicates. C, competition chemotaxis binding assay of CCL27 with the N-terminal truncation mutant [3-88]. WT CCL27 (50 nM) was incubated with increasing amounts of [3-88]-CCL27 and the percent cell migration was compared after a 2 h incubation period at 37 °C. Shown are representative data (mean ± SD) of three independent experiments performed in technical triplicates. D, structural model of WT CCL27 (teal ribbon and sticks) in complex with CCR10 (gray ribbon). The optimal ligand atom placement surface in the orthosteric pocket of the receptor is shown as a gray mesh. The complex is viewed along the plane of the membrane in the TM2-to-TM5 direction; TM2 is hidden for clarity. Receptor residues Tyr120(3.32) and Ser296(7.39) are shown in gray spheres. E, the model from (D) is viewed perpendicular to the plane of the membrane from the extracellular side; chemokine residues 1 to 3 are shown as ribbon and sticks; color represents per-atom RTCNN scores aggregated to residue backbones (for ribbons and backbone sticks); and side chains (for side chain sticks). F, RTCNN scores of N-terminal residues of CCL27 across the ensembles of AF2 and AF3 structural models of the CCR10–CCL27 complex. AF, AlphaFold; CCR, CC chemokine receptor; RTCNN, Radial and Topological Neural Network; TM, transmembrane.
Figure 2 Identification of N terminally modified CCL27 mutants that function as CCR10 antagonists.A, cell migration of WT CCL27 and N-terminal mutants with CCR10-expressing L1.2 cells at 50 nM (average concentration for maximal migration of WT CCL27); data shown are representative (mean ± SD) of three independent experiments performed in technical triplicates. Statistical analysis was performed by ordinary one-way ANOVA with post hoc Dunnett’s multiple comparisons test (∗∗∗∗p < 0.0001; ∗∗p < 0.01; CCL27: L2A, p = 0.0673). B, migration across a broad chemokine concentration range (0.1 nM to 1 μM), plotted as the percent of cells migrated relative to maximal migration (i.e., no filter). Shown are representative data (mean ± SD) of three independent experiments performed in technical triplicates. C, competition chemotaxis binding assay of CCL27 with the N-terminal truncation mutant [3-88]. WT CCL27 (50 nM) was incubated with increasing amounts of [3-88]-CCL27 and the percent cell migration was compared after a 2 h incubation period at 37 °C. Shown are representative data (mean ± SD) of three independent experiments performed in technical triplicates. D, structural model of WT CCL27 (teal ribbon and sticks) in complex with CCR10 (gray ribbon). The optimal ligand atom placement surface in the orthosteric pocket of the receptor is shown as a gray mesh. The complex is viewed along the plane of the membrane in the TM2-to-TM5 direction; TM2 is hidden for clarity. Receptor residues Tyr120(3.32) and Ser296(7.39) are shown in gray spheres. E, the model from (D) is viewed perpendicular to the plane of the membrane from the extracellular side; chemokine residues 1 to 3 are shown as ribbon and sticks; color represents per-atom RTCNN scores aggregated to residue backbones (for ribbons and backbone sticks); and side chains (for side chain sticks). F, RTCNN scores of N-terminal residues of CCL27 across the ensembles of AF2 and AF3 structural models of the CCR10–CCL27 complex. AF, AlphaFold; CCR, CC chemokine receptor; RTCNN, Radial and Topological Neural Network; TM, transmembrane.CC BY · PubMed Central
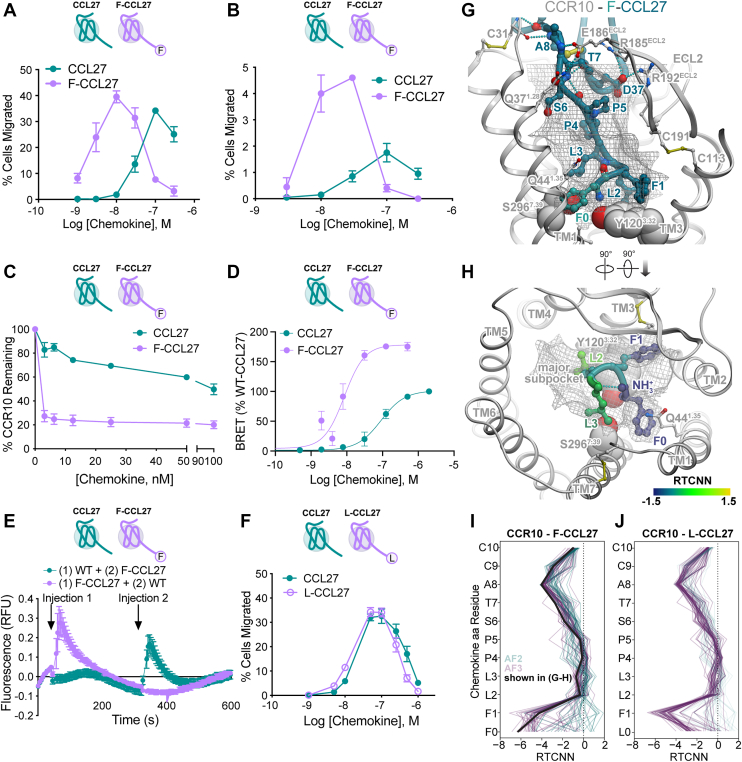
Figure 3 Discovery of the CCR10 superagonist, F-CCL27.A, cell migration analysis of CCL27 WT and F-CCL27 with L1.2/CCR10 cells across varying chemokine concentrations. Results shown are representative data (mean ± SD) of independent experiments (n = 6) performed in technical duplicates or triplicates. B, transendothelial cell migration of WT CCL27 and F-CCL27 with L1.2/CCR10 cells across varying chemokine concentrations with data plotted as the percent of cells migrated after a 2 h incubation at 37 °C. Shown are representative data (mean ± SD) of independent experiments (n = 3) performed in technical duplicates. C, WT or F-CCL27–mediated internalization of L1.2/CCR10 cells. Cells were treated with varying concentrations of chemokine, incubated at 37 °C for 45 min, and then receptor levels were detected and plotted as the percent of receptor remaining compared to cells treated with no chemokine. Results shown are the mean ± SEM of single measurements obtained for each concentration combined from at least three independent experiments (n = 3–4). D, β-arrestin recruitment by BRET. Cells were transiently transfected with CCR10-RlucII and βarr2-GFP10 and then stimulated with varying concentrations of chemokine. The BRET ratios are shown as percentage of WT-CCL27. Results shown are the mean ± SD of independent experiments (n = 4) performed in technical duplicates or triplicates. E, the higher potency of F-CCL27 than WT CCL27 as measured by calcium flux using L1.2/CCR10 cells. Cells were treated with an initial dose of 20 nM WT or F-CCL27 (injection 1), followed by a second addition of 20 nM F-CCL27 and WT CCL27 (injection 2), respectively, after the 75th reading cycle (at approximately 320 s). Note that WT CCL27 produces a calcium response at higher concentrations, consistent with a prior study (13), 50 nM in our hands), but 20 nM was chosen in order to observe a signal in response to a second injection of chemokine. Shown are representative data (mean ± SD) of independently performed experiments (n = 3) performed in technical triplicates. F, cell migration analysis of CCL27 WT and L-CCL27 with L1.2/CCR10 cells across varying chemokine concentrations plotted as the percent of cells migrated after a 2 h incubation at 37 °C. Shown are representative data (mean ± SD) of independent experiments (n = 3) performed in technical triplicates. G, structural model of F-CCL27 (teal ribbon and sticks) in complex with CCR10 (gray ribbon). The optimal ligand atom placement surface in the orthosteric pocket of the receptor is shown as gray mesh. The complex is viewed along the plane of the membrane in the TM2-to-TM5 direction; TM2 is hidden for clarity. Receptor residues Tyr120(3.32), F216(5.47), Y263(6.51), L267(6.55), and Ser296(7.39) are shown as gray spheres. H, the model from (G) is viewed perpendicular to the plane of the membrane from the extracellular side; chemokine residues 0 to 3 are shown as ribbon and sticks; color represents per-atom RTCNN scores aggregated to residue backbones (for ribbons and backbone sticks) and side chains (for side chain sticks). I-J, RTCNN scores of N-terminal residues of F-CCL27 (I) and L-CCL27 (J) across the ensembles of AF2 and AF3 structural models of CCR10 complexes with these two chemokines. BRET, bioluminescence resonance energy transfer; CCR, CC chemokine receptor; RTCNN, Radial and Topological Neural Network; TM, transmembrane.
Figure 3 Discovery of the CCR10 superagonist, F-CCL27.A, cell migration analysis of CCL27 WT and F-CCL27 with L1.2/CCR10 cells across varying chemokine concentrations. Results shown are representative data (mean ± SD) of independent experiments (n = 6) performed in technical duplicates or triplicates. B, transendothelial cell migration of WT CCL27 and F-CCL27 with L1.2/CCR10 cells across varying chemokine concentrations with data plotted as the percent of cells migrated after a 2 h incubation at 37 °C. Shown are representative data (mean ± SD) of independent experiments (n = 3) performed in technical duplicates. C, WT or F-CCL27–mediated internalization of L1.2/CCR10 cells. Cells were treated with varying concentrations of chemokine, incubated at 37 °C for 45 min, and then receptor levels were detected and plotted as the percent of receptor remaining compared to cells treated with no chemokine. Results shown are the mean ± SEM of single measurements obtained for each concentration combined from at least three independent experiments (n = 3–4). D, β-arrestin recruitment by BRET. Cells were transiently transfected with CCR10-RlucII and βarr2-GFP10 and then stimulated with varying concentrations of chemokine. The BRET ratios are shown as percentage of WT-CCL27. Results shown are the mean ± SD of independent experiments (n = 4) performed in technical duplicates or triplicates. E, the higher potency of F-CCL27 than WT CCL27 as measured by calcium flux using L1.2/CCR10 cells. Cells were treated with an initial dose of 20 nM WT or F-CCL27 (injection 1), followed by a second addition of 20 nM F-CCL27 and WT CCL27 (injection 2), respectively, after the 75th reading cycle (at approximately 320 s). Note that WT CCL27 produces a calcium response at higher concentrations, consistent with a prior study (13), 50 nM in our hands), but 20 nM was chosen in order to observe a signal in response to a second injection of chemokine. Shown are representative data (mean ± SD) of independently performed experiments (n = 3) performed in technical triplicates. F, cell migration analysis of CCL27 WT and L-CCL27 with L1.2/CCR10 cells across varying chemokine concentrations plotted as the percent of cells migrated after a 2 h incubation at 37 °C. Shown are representative data (mean ± SD) of independent experiments (n = 3) performed in technical triplicates. G, structural model of F-CCL27 (teal ribbon and sticks) in complex with CCR10 (gray ribbon). The optimal ligand atom placement surface in the orthosteric pocket of the receptor is shown as gray mesh. The complex is viewed along the plane of the membrane in the TM2-to-TM5 direction; TM2 is hidden for clarity. Receptor residues Tyr120(3.32), F216(5.47), Y263(6.51), L267(6.55), and Ser296(7.39) are shown as gray spheres. H, the model from (G) is viewed perpendicular to the plane of the membrane from the extracellular side; chemokine residues 0 to 3 are shown as ribbon and sticks; color represents per-atom RTCNN scores aggregated to residue backbones (for ribbons and backbone sticks) and side chains (for side chain sticks). I-J, RTCNN scores of N-terminal residues of F-CCL27 (I) and L-CCL27 (J) across the ensembles of AF2 and AF3 structural models of CCR10 complexes with these two chemokines. BRET, bioluminescence resonance energy transfer; CCR, CC chemokine receptor; RTCNN, Radial and Topological Neural Network; TM, transmembrane.CC BY · PubMed Central
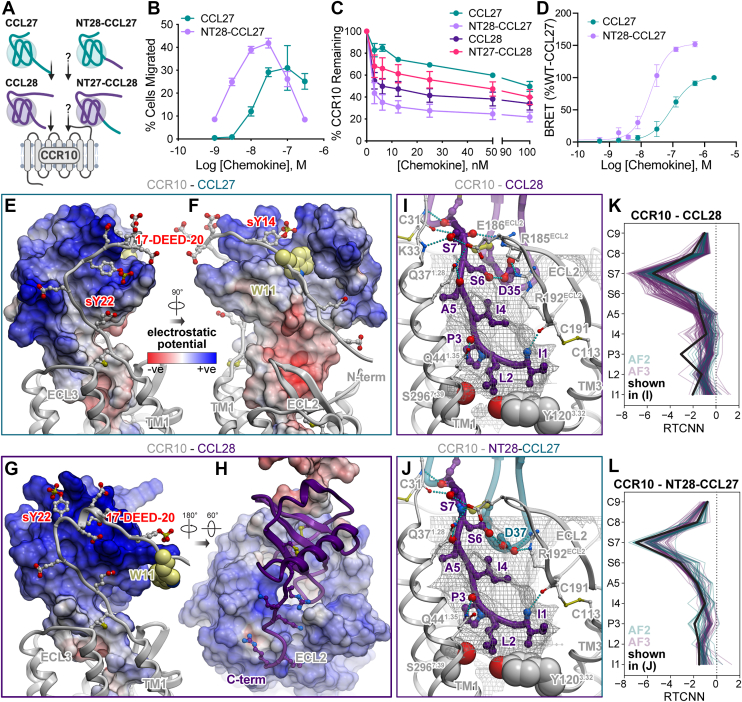
Figure 4 Pharmacological and structural characterization of N terminally swapped chimeras of CCL27 and CCL28.A, cartoon depicting CCL27 and CCL28 specificity for CCR10 and unknown activity of N-terminal chimeras. B, cell migration analysis of WT CCL27 and NT28-CCL27 with L1.2/CCR10 cells across varying chemokine concentrations. Shown are representative data (mean ± SD) of independent experiments (n = 5) performed in technical duplicates or triplicates and plotted as the percent of cells migrated after a 2 h incubation at 37 °C. C, comparison of WT or mutant chemokine-mediated internalization of L1.2/CCR10 cells. Cells were treated with varying concentrations of chemokine, incubated at 37 °C for 45 min and then receptor levels were detected and plotted as the percent of receptor remaining compared to cells treated with no chemokine. Results shown are the mean ± SEM of single measurements obtained for each concentration combined from at least three independent experiments (n = 3–4). D, β-arrestin recruitment by BRET. Cells were transiently transfected with CCR10-RlucII and βarr2-GFP10 and then stimulated with varying concentrations of CCL27 or NT28-CCL27. The BRET ratios are shown as a % of WT-CCL27. Results shown are the mean ± SD of at least three independent experiments performed in technical duplicates or triplicates. E and F, interactions of the receptor N terminus with the globular core of the chemokine in the model of the CCR10–CCL27 complex. The complex is shown in two orientations; the chemokine is represented as a surface mesh colored by the electrostatic potential; the receptor is shown as a ribbon and sticks. Receptor residue W11 is shown in light yellow spheres. G and H, interactions of the receptor N terminus and extracellular loops with the globular core in the chemokine in the structural model of the CCR10–CCL28 complex. The complex is shown in two orientations. In (G), the chemokine is represented as a surface mesh colored by the electrostatic potential, while the receptor is shown as ribbon and sticks. In (H), the receptor is shown as the electrostatic potential mesh, while the chemokine is in purple ribbon. I and J, CRS2 interactions in the structural models of CCR10 (white ribbon and spheres) bound to CCL28 (I) and NT28-CCL27 (J). Chemokine segments originating from CCL28 are shown in purple ribbon and sticks; teal ribbon and sticks are segments from CCL27. The optimal ligand atom placement surface in the orthosteric pocket of the receptor is shown as gray mesh. The complexes are viewed along the plane of the membrane in the TM2-to-TM5 direction, TM2 is hidden for clarity. Residues Tyr120(3.32) and Ser296(7.39) of the receptor are shown in gray spheres. Hydrogen bonds are shown as cyan dotted lines. K and L, RTCNN scores of N-terminal residues of CCL28 (K) and NT28-CCL27 (L) across the ensembles of AF2 and AF3 structural models of CCR10 complexes with these two chemokine variants. AF, AlphaFold; BRET, bioluminescence resonance energy transfer; CCR, CC chemokine receptor; RTCNN, Radial and Topological Neural Network; TM, transmembrane.
Figure 4 Pharmacological and structural characterization of N terminally swapped chimeras of CCL27 and CCL28.A, cartoon depicting CCL27 and CCL28 specificity for CCR10 and unknown activity of N-terminal chimeras. B, cell migration analysis of WT CCL27 and NT28-CCL27 with L1.2/CCR10 cells across varying chemokine concentrations. Shown are representative data (mean ± SD) of independent experiments (n = 5) performed in technical duplicates or triplicates and plotted as the percent of cells migrated after a 2 h incubation at 37 °C. C, comparison of WT or mutant chemokine-mediated internalization of L1.2/CCR10 cells. Cells were treated with varying concentrations of chemokine, incubated at 37 °C for 45 min and then receptor levels were detected and plotted as the percent of receptor remaining compared to cells treated with no chemokine. Results shown are the mean ± SEM of single measurements obtained for each concentration combined from at least three independent experiments (n = 3–4). D, β-arrestin recruitment by BRET. Cells were transiently transfected with CCR10-RlucII and βarr2-GFP10 and then stimulated with varying concentrations of CCL27 or NT28-CCL27. The BRET ratios are shown as a % of WT-CCL27. Results shown are the mean ± SD of at least three independent experiments performed in technical duplicates or triplicates. E and F, interactions of the receptor N terminus with the globular core of the chemokine in the model of the CCR10–CCL27 complex. The complex is shown in two orientations; the chemokine is represented as a surface mesh colored by the electrostatic potential; the receptor is shown as a ribbon and sticks. Receptor residue W11 is shown in light yellow spheres. G and H, interactions of the receptor N terminus and extracellular loops with the globular core in the chemokine in the structural model of the CCR10–CCL28 complex. The complex is shown in two orientations. In (G), the chemokine is represented as a surface mesh colored by the electrostatic potential, while the receptor is shown as ribbon and sticks. In (H), the receptor is shown as the electrostatic potential mesh, while the chemokine is in purple ribbon. I and J, CRS2 interactions in the structural models of CCR10 (white ribbon and spheres) bound to CCL28 (I) and NT28-CCL27 (J). Chemokine segments originating from CCL28 are shown in purple ribbon and sticks; teal ribbon and sticks are segments from CCL27. The optimal ligand atom placement surface in the orthosteric pocket of the receptor is shown as gray mesh. The complexes are viewed along the plane of the membrane in the TM2-to-TM5 direction, TM2 is hidden for clarity. Residues Tyr120(3.32) and Ser296(7.39) of the receptor are shown in gray spheres. Hydrogen bonds are shown as cyan dotted lines. K and L, RTCNN scores of N-terminal residues of CCL28 (K) and NT28-CCL27 (L) across the ensembles of AF2 and AF3 structural models of CCR10 complexes with these two chemokine variants. AF, AlphaFold; BRET, bioluminescence resonance energy transfer; CCR, CC chemokine receptor; RTCNN, Radial and Topological Neural Network; TM, transmembrane.CC BY · PubMed Central
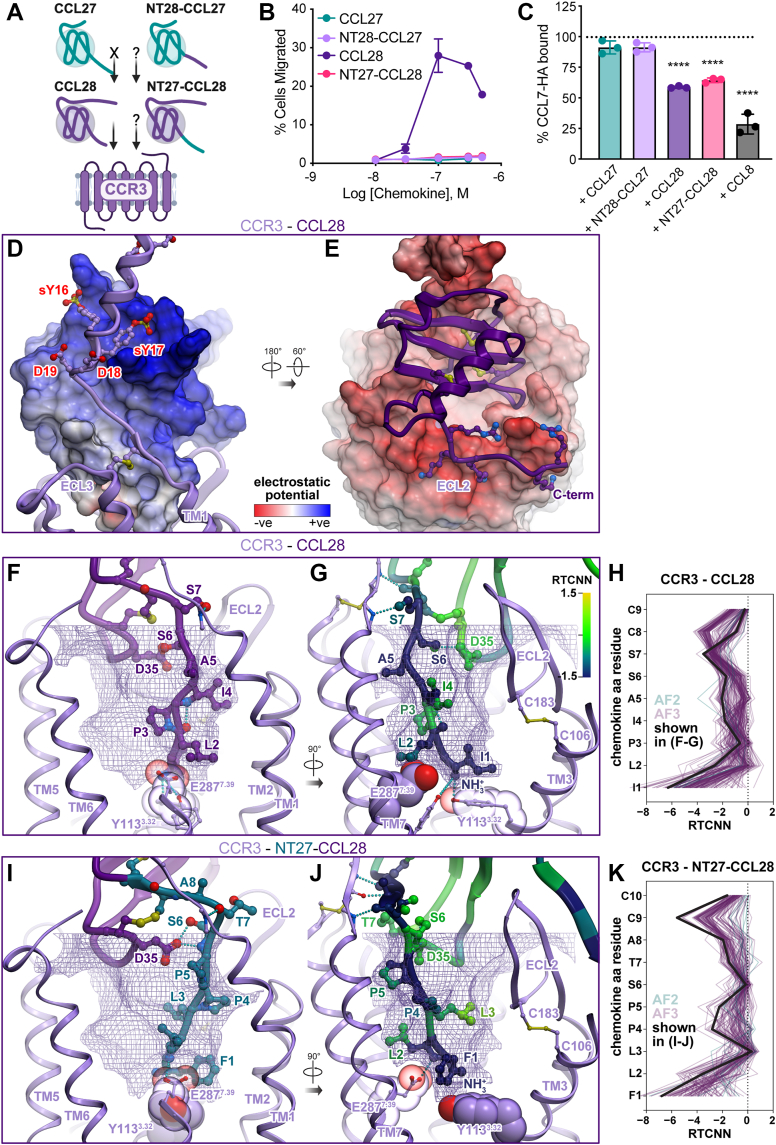
Figure 5 Functional and structural analysis of N-terminal chimeras of CCL27 and CCL28 with CCR3.A, cartoon depicting CCL28 specificity for CCR3, lack of activity by CCL27, and unknown activity of N-terminal chimeras. B, cell migration analysis of WT CCL27, WT CCL28, and N-terminal chimera mutants (NT28-CCL27 and NT27-CCL28) with L1.2/CCR3 cells across varying chemokine concentrations. Shown are representative data (mean ± SD) of independent experiments (n = 3) performed in technical duplicates, plotted as the percent of cells migrated after 2 h incubation at 37 °C. C, competition binding experiments were performed on L1.2/CCR3 cells using C terminally HA-tagged CCL7 (CCL7-HA). Cells were incubated with 250 nM of CCL7-HA alone or in combination with a 4-fold excess of competing ligand (1000 nM) for 30 min on ice, cells were washed and then CCL7 levels were determined by flow cytometry using an anti-HA antibody. Results shown are the mean ± SEM of single measurements obtained for each concentration combined from independent experiments (n = 3); the dotted line depicts 100% retention of bound CCL7-HA. Statistical analysis was performed by ordinary one-way ANOVA with post hoc Dunnett’s multiple comparisons test. (∗∗∗∗p < 0.0001; CCL7-HA + CCL27, p = 0.1026; CCL7-HA + NT28-CCL27, p = 0.1026). D and E, the interactions between the globular domain of CCL28 and the N terminus (D) or extracellular loops (E) of CCR3. The complex is shown in two orientations. In (D), chemokine is represented as a surface mesh colored by the electrostatic potential, while the receptor is shown as ribbon and sticks. In (E), the receptor is shown as the electrostatic potential mesh while the chemokine is in purple ribbon. F-G and I-J, CRS2 interactions in the structural models of CCR3 (violet ribbon and spheres) bound to CCL28 (F-G) or NT27-CCL28 (I-J). The optimal ligand atom placement surface is shown as violet mesh; CCR3 residues Tyr113(3.32) and Glu287(7.39) as spheres. In (F) and (I), complexes are viewed parallel to the plane of the membrane in the TM7-to-TM3 direction; TM7 is partially hidden for clarity; chemokine segments originated from CCL28 are shown in purple sticks and ribbons; those from CCL27 are teal sticks and ribbons. In (G) and (J), complexes are viewed parallel to the plane of the membrane in the TM2-to-TM5 direction; TM2 is partially hidden for clarity; color represents per-atom RTCNN scores aggregated to residue backbones (for ribbons and backbone sticks) and side chains (for side chain sticks). H and K, RTCNN scores of N-terminal residues of CCL28 (H) and NT27-CCL28 (K) across the ensembles of AF2 and AF3 structural models of CCR3 complexes with these two chemokine variants. AF, AlphaFold; CCR, CC chemokine receptor; RTCNN, Radial and Topological Neural Network; TM, transmembrane.
Figure 5 Functional and structural analysis of N-terminal chimeras of CCL27 and CCL28 with CCR3.A, cartoon depicting CCL28 specificity for CCR3, lack of activity by CCL27, and unknown activity of N-terminal chimeras. B, cell migration analysis of WT CCL27, WT CCL28, and N-terminal chimera mutants (NT28-CCL27 and NT27-CCL28) with L1.2/CCR3 cells across varying chemokine concentrations. Shown are representative data (mean ± SD) of independent experiments (n = 3) performed in technical duplicates, plotted as the percent of cells migrated after 2 h incubation at 37 °C. C, competition binding experiments were performed on L1.2/CCR3 cells using C terminally HA-tagged CCL7 (CCL7-HA). Cells were incubated with 250 nM of CCL7-HA alone or in combination with a 4-fold excess of competing ligand (1000 nM) for 30 min on ice, cells were washed and then CCL7 levels were determined by flow cytometry using an anti-HA antibody. Results shown are the mean ± SEM of single measurements obtained for each concentration combined from independent experiments (n = 3); the dotted line depicts 100% retention of bound CCL7-HA. Statistical analysis was performed by ordinary one-way ANOVA with post hoc Dunnett’s multiple comparisons test. (∗∗∗∗p < 0.0001; CCL7-HA + CCL27, p = 0.1026; CCL7-HA + NT28-CCL27, p = 0.1026). D and E, the interactions between the globular domain of CCL28 and the N terminus (D) or extracellular loops (E) of CCR3. The complex is shown in two orientations. In (D), chemokine is represented as a surface mesh colored by the electrostatic potential, while the receptor is shown as ribbon and sticks. In (E), the receptor is shown as the electrostatic potential mesh while the chemokine is in purple ribbon. F-G and I-J, CRS2 interactions in the structural models of CCR3 (violet ribbon and spheres) bound to CCL28 (F-G) or NT27-CCL28 (I-J). The optimal ligand atom placement surface is shown as violet mesh; CCR3 residues Tyr113(3.32) and Glu287(7.39) as spheres. In (F) and (I), complexes are viewed parallel to the plane of the membrane in the TM7-to-TM3 direction; TM7 is partially hidden for clarity; chemokine segments originated from CCL28 are shown in purple sticks and ribbons; those from CCL27 are teal sticks and ribbons. In (G) and (J), complexes are viewed parallel to the plane of the membrane in the TM2-to-TM5 direction; TM2 is partially hidden for clarity; color represents per-atom RTCNN scores aggregated to residue backbones (for ribbons and backbone sticks) and side chains (for side chain sticks). H and K, RTCNN scores of N-terminal residues of CCL28 (H) and NT27-CCL28 (K) across the ensembles of AF2 and AF3 structural models of CCR3 complexes with these two chemokine variants. AF, AlphaFold; CCR, CC chemokine receptor; RTCNN, Radial and Topological Neural Network; TM, transmembrane.CC BY · PubMed Central
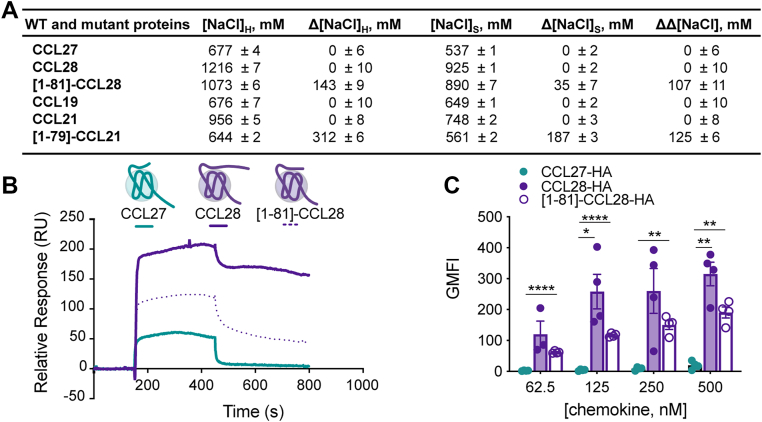
Figure 6 GAG binding characterization of WT and mutant proteins.A, GAG binding characterization of CCL27, CCL28, CCL19, CCL21, and mutants by heparin sepharose chromatography. The concentration of NaCl (mM) required to elute protein from a heparin or a SP sepharose affinity column is reported as [NaCl]H and [NaCl]S, respectively. Δ[NaCl] values represent the difference in [NaCl] required to elute mutant versus WT protein (Δ[NaCl] = [NaCl]WT − [NaCl]mutant) from either heparin sepharose (Δ[NaCl]H) or SP-sepharose (Δ[NaCl]S). ΔΔ[NaCl] is a measure of the specificity of interaction, where ΔΔ[NaCl] = Δ[NaCl]H –Δ[NaCl]S. A positive specificity index for a mutant means that the difference between the amount of NaCl required to elute the mutant from the heparin-sepharose column as compared to WT was greater than the same difference for the SP-sepharose column, suggesting specificity for heparin beyond electrostatic interactions generally associated with affinity for SP-sepharose. All data represent the mean ± SD of three independent experiments. B, SPR sensorgrams of CCL27, CCL28, and [1-81]-CCL28 showing the resulting signals (relative response in RU) for interaction with immobilized HS with the same concentration of injected chemokine (1000 nM concentration). C, CCL27, CCL28 and [1-81]-CCL28 binding of CHO-K1 cells expressing endogenous HS. C terminally HA-tagged CCL27, CCL28, or [1-81]-CCL28 was used to determine the extent of chemokine binding to CHO-K1 cells. Cells were incubated with varying concentrations of HA-tagged chemokine for 30 min on ice, washed and the geometric mean fluorescence intensity (GMFI) detected by flow cytometry using an anti-HA antibody normalized to an isotype control. Data shown is the mean ± SEM from single measurements obtained for each concentration combined from independent experiments (n = 3–4). Statistical analysis was performed by mixed-effects analysis with post hoc Tukey’s multiple comparisons test. (∗∗∗∗p < 0.0001; ∗∗p < 0.01; ∗p < 0.05; CCL27-HA: CCL28-HA at 62.5 nM, p = 0.1915; CCL28-HA: [1-81]-CCL28-HA at 62.5 nM, p = 0.4916; CCL28-HA: [1-81]-CCL28-HA at 125 nM, p = 0.1659; CCL27-HA: CCL28-HA at 250 nM, p = 0.0798; CCL28-HA: [1-81]-CCL28-HA at 250 nM, p = 0.4024; CCL28-HA: [1-81]-CCL28-HA at 500 nM, p = 0.0812). BRET, bioluminescence resonance energy transfer; CCR, CC chemokine receptor; GAG, glycosaminoglycan; HS, heparan sulfate; SPR, surface plasmon resonance.
Figure 6 GAG binding characterization of WT and mutant proteins.A, GAG binding characterization of CCL27, CCL28, CCL19, CCL21, and mutants by heparin sepharose chromatography. The concentration of NaCl (mM) required to elute protein from a heparin or a SP sepharose affinity column is reported as [NaCl]H and [NaCl]S, respectively. Δ[NaCl] values represent the difference in [NaCl] required to elute mutant versus WT protein (Δ[NaCl] = [NaCl]WT − [NaCl]mutant) from either heparin sepharose (Δ[NaCl]H) or SP-sepharose (Δ[NaCl]S). ΔΔ[NaCl] is a measure of the specificity of interaction, where ΔΔ[NaCl] = Δ[NaCl]H –Δ[NaCl]S. A positive specificity index for a mutant means that the difference between the amount of NaCl required to elute the mutant from the heparin-sepharose column as compared to WT was greater than the same difference for the SP-sepharose column, suggesting specificity for heparin beyond electrostatic interactions generally associated with affinity for SP-sepharose. All data represent the mean ± SD of three independent experiments. B, SPR sensorgrams of CCL27, CCL28, and [1-81]-CCL28 showing the resulting signals (relative response in RU) for interaction with immobilized HS with the same concentration of injected chemokine (1000 nM concentration). C, CCL27, CCL28 and [1-81]-CCL28 binding of CHO-K1 cells expressing endogenous HS. C terminally HA-tagged CCL27, CCL28, or [1-81]-CCL28 was used to determine the extent of chemokine binding to CHO-K1 cells. Cells were incubated with varying concentrations of HA-tagged chemokine for 30 min on ice, washed and the geometric mean fluorescence intensity (GMFI) detected by flow cytometry using an anti-HA antibody normalized to an isotype control. Data shown is the mean ± SEM from single measurements obtained for each concentration combined from independent experiments (n = 3–4). Statistical analysis was performed by mixed-effects analysis with post hoc Tukey’s multiple comparisons test. (∗∗∗∗p < 0.0001; ∗∗p < 0.01; ∗p < 0.05; CCL27-HA: CCL28-HA at 62.5 nM, p = 0.1915; CCL28-HA: [1-81]-CCL28-HA at 62.5 nM, p = 0.4916; CCL28-HA: [1-81]-CCL28-HA at 125 nM, p = 0.1659; CCL27-HA: CCL28-HA at 250 nM, p = 0.0798; CCL28-HA: [1-81]-CCL28-HA at 250 nM, p = 0.4024; CCL28-HA: [1-81]-CCL28-HA at 500 nM, p = 0.0812). BRET, bioluminescence resonance energy transfer; CCR, CC chemokine receptor; GAG, glycosaminoglycan; HS, heparan sulfate; SPR, surface plasmon resonance.CC BY · PubMed Central

Verification

Claims the paper makes

The claims and statistics of this paper haven’t been checked yet.

Run the check — free, no account needed. It reads the open-access text and checks the sources it cites.

A few free checks a day · papers already verified open instantly · results are public

Self-check

Percentages, sums and reported differences re-computed from the paper’s own numbers.

The self-check needs the paper’s full text.

Citations

Cites

Show all 1 references

Research works printed but not linked: 95

  1. 10.1038/ni.f.214 · DOI
  2. 10.1146/annurev-immunol-032713-120145 · DOI
  3. 10.1016/j.jmb.2018.06.027 · DOI
  4. 10.1038/84214 · DOI
  5. 10.1016/j.yexcr.2010.12.021 · DOI
  6. 10.1073/pnas.96.25.14470 · DOI
  7. 10.1016/j.cellimm.2016.02.001 · DOI
  8. 10.4049/jimmunol.165.6.2943 · DOI · Paper page
  9. 10.1074/jbc.M001461200 · DOI
  10. 10.1038/nm0202-157 · DOI
  11. 10.4049/jimmunol.180.10.6462 · DOI
  12. 10.1016/j.jaci.2014.03.010 · DOI · Paper page
  13. 10.4049/jimmunol.164.7.3465 · DOI
  14. 10.1172/JCI200317244 · DOI
  15. 10.1093/intimm/dxl054 · DOI
  16. 10.1172/jci.insight.122211 · DOI
  17. 10.1084/jem.20030593 · DOI
  18. 10.1038/nature10169 · DOI · Paper page
  19. 10.18632/oncotarget.12409 · DOI · Paper page
  20. 10.1038/s41467-022-31810-6 · DOI
  21. 10.1038/s41419-018-0267-9 · DOI
  22. 10.1038/mi.2014.46 · DOI
  23. 10.1042/BJ20101132 · DOI
  24. 10.7554/eLife.78206 · DOI
  25. 10.1016/j.immuni.2012.05.008 · DOI
  26. 10.1016/j.jaci.2018.10.052 · DOI
  27. 10.1517/17460441.2014.897324 · DOI
  28. 10.1074/jbc.M109.091108 · DOI
  29. 10.1016/j.jmb.2018.06.001 · DOI
  30. 10.1016/j.vaccine.2009.10.095 · DOI
  31. 10.1038/gt.2009.112 · DOI
  32. 10.1021/bi971125s · DOI
  33. 10.1021/bi990711d · DOI
  34. 10.1073/pnas.0334864100 · DOI
  35. 10.1038/ncomms14135 · DOI
  36. 10.1073/pnas.1417037111 · DOI
  37. 10.1016/j.immuni.2017.05.002 · DOI
  38. 10.1016/S0021-9258(18)54472-0 · DOI · Paper page
  39. 10.1021/bi9912239 · DOI
  40. 10.1074/jbc.273.32.19972 · DOI
  41. 10.1084/jem.181.2.631 · DOI
  42. 10.1074/jbc.271.5.2599 · DOI
  43. 10.1074/jbc.M605584200 · DOI
  44. 10.1016/j.bcp.2011.07.091 · DOI
  45. 10.1016/j.biocel.2007.12.009 · DOI
  46. 10.1189/jlb.0607338 · DOI
  47. 10.1016/j.imlet.2012.04.015 · DOI
  48. 1995, Methods in neurosciences, 10, S1043
  49. 10.1126/sciadv.abg8685 · DOI
  50. 10.1126/scisignal.aah5756 · DOI
  51. 10.1126/sciadv.adj7500 · DOI
  52. 10.1038/s41594-023-01175-5 · DOI
  53. 10.1038/s41467-021-24438-5 · DOI
  54. 10.1016/S0022-2836(02)00470-9 · DOI
  55. 10.1002/prot.10613 · DOI
  56. 10.1126/science.276.5310.276 · DOI · Paper page
  57. 10.1146/annurev.physiol.69.022405.154712 · DOI · Paper page
  58. 10.1073/pnas.1508836112 · DOI
  59. 10.1002/eji.1830230150 · DOI
  60. 10.1016/j.celrep.2022.111930 · DOI
  61. 10.1021/cb700159m · DOI
  62. 10.1016/S0076-6879(09)05404-4 · DOI
  63. 10.1016/S0304-4165(02)00232-5 · DOI
  64. 10.1371/journal.pone.0001110 · DOI
  65. 10.1016/j.immuni.2010.04.017 · DOI · Paper page
  66. 10.1016/j.bbrc.2016.06.098 · DOI
  67. 10.1093/glycob/cwv100 · DOI
  68. 10.1074/jbc.M114.547737 · DOI
  69. 10.1007/s13238-012-2927-3 · DOI
  70. 10.4049/jimmunol.170.7.3799 · DOI
  71. 10.3390/ijms22084232 · DOI
  72. 10.1074/jbc.M113.479113 · DOI
  73. 10.1136/annrheumdis-2013-204530 · DOI
  74. 10.1017/erm.2022.28 · DOI
  75. 10.1111/cas.14069 · DOI
  76. 10.2174/138161209787582165 · DOI
  77. 10.1038/jid.2009.45 · DOI
  78. 10.1016/j.xcrm.2022.100693 · DOI
  79. 10.1016/j.vaccine.2020.01.023 · DOI
  80. 10.1158/0008-5472.CAN-05-2001 · DOI
  81. 10.1084/jem.187.8.1215 · DOI
  82. 10.1016/j.molpha.2025.100020 · DOI
  83. 10.1073/pnas.0404802101 · DOI
  84. 10.1038/s41467-025-56698-w · DOI
  85. 10.1101/2024.05.21.595098 · DOI
  86. 10.1002/eji.200939819 · DOI
  87. 10.4049/jimmunol.170.3.1452 · DOI
  88. 10.1016/S0076-6879(09)05216-1 · DOI
  89. 10.1074/jbc.M116.720953 · DOI
  90. 10.1074/jbc.M115.675108 · DOI
  91. Evans, R. , O’Neill, M. , Pritzel, A. , Antropova, N. , Senior, A. , Green, T. , et al. (2022) Protein complex prediction with AlphaFold-Multimer bioRxiv, https://www.biorxiv.org/content/10.1101/2021.10.04.463034v2 · DOI · Paper page
  92. 10.1006/jmbi.1994.1052 · DOI
  93. 10.1016/S1367-5931(00)00217-9 · DOI
  94. 10.1007/s10822-012-9547-0 · DOI
  95. 10.1002/prot.23106 · DOI · Paper page

Metadata

Authors
Huang, M., Celniker, A. F., Chitsazi, R., Dyer, D. P., Jansma, A. L., Kufareva, I., Salanga, C. L., & Handel, T. M.
Affiliations
  • University of California San Diego (US)
  • Manchester Academic Health Science Centre (GB)
Corresponding author
  • Kufareva, Irina
  • Salanga, Catherina L.
  • Handel, Tracy M.
Venue
Journal of Biological Chemistry
Publisher
openRxiv
Published
2025-06-01
Volume
301
Issue
11
Pages
110736-110736
ISSN
0021-9258 (ISSN-L)
OpenAlex
W4414366111
Cited by
1
References
1
Citations by year
2026: 1
FWCI
0.41
Type
journal article
Language
en
Open access
Locations
  • Journal of Biological Chemistry (publishedVersion, cc-by)
  • bioRxiv (Cold Spring Harbor Laboratory) (acceptedVersion)
  • Europe PMC (PubMed Central) (publishedVersion, cc-by)
  • PubMed (publishedVersion)
  • Research Explorer (The University of Manchester) (publishedVersion, other-oa)
  • PubMed Central (submittedVersion)
  • Research Explorer (The University of Manchester) (submittedVersion)
Funders
National Institute of Health (R01 AI37113, R21 AI121918, R01 GM136202, R01 AI161880, R01 AI118985, R21 AI149369)
Topics
  • Health Sciences › Medicine › Oncology › Chemokine receptors and signaling
  • Life Sciences › Biochemistry, Genetics and Molecular Biology › Molecular Biology › Receptor Mechanisms and Signaling
  • Life Sciences › Immunology and Microbiology › Immunology › Cytokine Signaling Pathways and Interactions
Keywords
CCL27, CCL28, CCR10, CCR3, receptor activation, N-terminal residues, receptor internalization, binding specificity, glycosaminoglycan binding, epithelial immunity, mucosal immunity, structure functions

About these checks

Registry, retraction, Cites and statistics results are computed, not judged, with one exception: a printed reference that no index lists is read once by a model before it counts as a citation error. Claims are extracted by a model and kept only when their quote appears verbatim in the text; each cited source is then checked, with a model’s help, for whether it says what the claim relies on. Those verdicts can be wrong — read the claim’s quote and the cited source before relying on one.

Statistics and arithmetic are recomputed, not judged.

Confidence bands are shown only for fields calibrated on our annotated test set. None is calibrated yet, so no band is shown.

What counts as a claim ›How we measure confidence ›How we check this ›

Are you an author, or do you see a problem with this page? Request a review

How to cite

Cite CoChat for the checks on this page, and the paper for its own findings.

This page
CoChat. (2026). Citation check: Rules of engagement: determinants of chemokine receptor activation and selectivity by CCL27 and CCL28. https://app.cochat.ai/papers/10.1101/2025.05.27.656466
The paper
Huang, M., Celniker, A. F., Chitsazi, R., Dyer, D. P., Jansma, A. L., Kufareva, I., Salanga, C. L., & Handel, T. M. (2025). Rules of engagement: determinants of chemokine receptor activation and selectivity by CCL27 and CCL28. Journal of Biological Chemistry. https://doi.org/10.1101/2025.05.27.656466

Data sources

Bibliographic data: Semantic Scholar, OpenAlex, Crossref.

Contains information from the Semantic Scholar Academic Graph Datasets, made available under the ODC Attribution License (ODC-BY 1.0).

Semantic Scholar’s data is described in: Kinney, R., et al. (2023). The Semantic Scholar Open Data Platform. arXiv:2301.10140.