

The DOI matches its Crossref record; 1 of the 1 references it cites were found in a registry or an index.
RiboFlow, RiboR and RiboPy: An ecosystem for analyzing ribosome profiling data at read length resolution
Open accessPreprint — published as 10.1093/bioinformatics/btaa028 · Paper page
Abstract
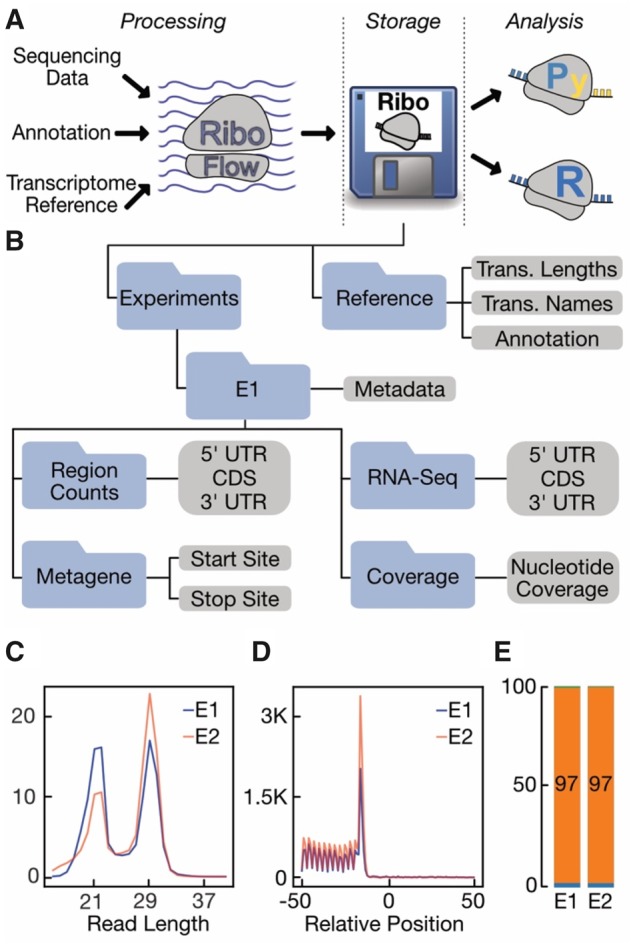
Summary: Ribosome occupancy measurements enable protein abundance estimation and infer mechanisms of translation. Recent studies have revealed that sequence read lengths in ribosome profiling data are highly variable and carry critical information. Consequently, data analyses require the computation and storage of multiple metrics for a wide range of ribosome footprint lengths. We developed a software ecosystem including a new efficient binary file format named ‘ribo’. Ribo files store all essential data grouped by ribosome footprint lengths. Users can assemble ribo files using our RiboFlow pipeline that processes raw ribosomal profiling sequencing data. RiboFlow is highly portable and customizable across a large number of computational environments with built-in capabilities for parallelization. We also developed interfaces for writing and reading ribo files in the R (RiboR) and Python (RiboPy) environments. Using RiboR and RiboPy, users can efficiently access ribosome profiling quality control metrics, generate essential plots, and carry out analyses. Altogether, these components create a complete software ecosystem for researchers to study translation through ribosome profiling. Availability and Implementation: For a quickstart, please see https://ribosomeprofiling.github.io . Source code, installation instructions and links to documentation are available on GitHub: https://github.com/ribosomeprofiling
Overview
The claims and statistics of this paper haven’t been checked yet.
Run the check — free, no account needed. It reads the open-access text and checks the sources it cites.
Integrity signals
Registry
Cites
Statistics
Figures
Verification
Claims the paper makes
The claims and statistics of this paper haven’t been checked yet.
Run the check — free, no account needed. It reads the open-access text and checks the sources it cites.
Self-check
Percentages, sums and reported differences re-computed from the paper’s own numbers.
The self-check needs the paper’s full text.
Citations
Cites
Global quantification of mammalian gene expression control
Schwanhäusser, B., Busse, D., Li, N., Dittmar, G., Schuchhardt, J., Wolf, J., Chen, W., & Selbach, M. (2011) · Nature · doi:10.1038/nature10098 · Cited by 6,566
Research works printed but not linked: 27
- Abdennur, N. and Mirny, L. (2019) Cooler: scalable storage for Hi-C data and other genomically-labeled arrays. Bioinformatics. · DOI
- Berg, J.A. et al. (2019) XPRESSyourself: Enhancing and Automating the Ribosome Profiling and RNA-Seq Analysis Toolkit. bioRxiv, 704320.
- 2018, Shoelaces: an interactive tool for ribosome profiling processing and visualization, BMC Genomics, 19, 543, 10.1186/s12864-018-4912-6 · DOI
- 2017, riboviz: analysis and visualization of ribosome profiling datasets, BMC Bioinformatics, 18, 461, 10.1186/s12859-017-1873-8 · DOI
- 10.1101/gr.193342.115 · DOI · Paper page
- 10.1261/rna.052548.115 · DOI
- 10.1038/nbt.3820 · DOI · Paper page
- 2016, Juicer Provides a One-Click System for Analyzing Loop-Resolution Hi-C Experiments, Cell Syst, 3, 95, 10.1016/j.cels.2016.07.002 · DOI
- 10.1016/j.cell.2014.02.006 · DOI
- 10.1261/rna.060418.116 · DOI
- 10.1126/science.1168978 · DOI · Paper page
- Ingolia, N.T. et al. (2019) Ribosome Profiling: Global Views of Translation. Cold Spring Harb. Perspect. Biol., 11. · DOI
- 10.1016/j.cell.2011.10.002 · DOI · Paper page
- 10.1038/msb.2013.47 · DOI · Paper page
- 10.7554/eLife.01257 · DOI
- 2018, An evolutionarily conserved ribosome-rescue pathway maintains epidermal homeostasis, Nature, 556, 376, 10.1038/s41586-018-0032-3 · DOI
- 10.1093/bioinformatics/btp352 · DOI · Paper page
- 10.7554/eLife.01630 · DOI
- 10.1016/j.cell.2012.09.019 · DOI · Paper page
- 2019, The barcode, UMI, set format and BUStools, Bioinformatics, 35, 4472, 10.1093/bioinformatics/btz279 · DOI
- 10.1093/nar/gku1310 · DOI
- 2019, RiboStreamR: a web application for quality control, analysis, and visualization of Ribo-seq data, BMC Genomics, 20, 422, 10.1186/s12864-019-5700-7 · DOI
- 2016, RiboProfiling: a Bioconductor package for standard Ribo-seq pipeline processing, F1000Res, 5, 1309, 10.12688/f1000research.8964.1 · DOI
- Sidrauski, C. et al. (2015) The small molecule ISRIB reverses the effects of eIF2α phosphorylation on translation and stress granule assembly. Elife, 4. · DOI
- 2019, Computational resources for ribosome profiling: from database to Web server and software, Brief. Bioinform, 20, 144, 10.1093/bib/bbx093 · DOI
- 10.1002/j.1460-2075.1988.tb03233.x · DOI
- 10.1016/j.molcel.2018.12.009 · DOI
Metadata
- Authors
- Ozadam, H., Geng, M., & Cenik, C.
- Affiliations
- The University of Texas at Austin (US)
- Corresponding author
- Cenik, Can
- Venue
- Bioinformatics
- Publisher
- openRxiv
- Published
- 2019-11-26
- Volume
- 36
- Issue
- 9
- Pages
- 2929-2931
- ISSN
- 1367-4803 (ISSN-L)
- PMC
- PMC7203755
- OpenAlex
- W3000621797
- Cited by
- 41
- References
- 1
- Citations by year
- 2026: 5 · 2025: 10 · 2024: 8 · 2023: 5 · 2022: 4 · 2021: 6 · 2020: 2
- FWCI
- 1.38
- Type
- journal article
- Language
- en
- Open access
- hybrid
- doi.org
- Licence
- cc-by-nc
- Locations
- Bioinformatics (publishedVersion, cc-by-nc)
- bioRxiv (Cold Spring Harbor Laboratory) (acceptedVersion, cc-by-nc)
- PubMed Central (publishedVersion, cc-by-nc)
- PubMed (publishedVersion)
- Funders
- Cancer Prevention and Research Institute of Texas (RR180042)
- University of Texas at Austin
- National Institutes of Health (CA204522)
- Department of Mechanical Engineering, University of Texas at Austin
- National Cancer Institute (R00CA204522, K99CA204522)
- Topics
- Life Sciences › Biochemistry, Genetics and Molecular Biology › Molecular Biology › RNA and protein synthesis mechanisms
- Life Sciences › Biochemistry, Genetics and Molecular Biology › Molecular Biology › Genomics and Phylogenetic Studies
- Life Sciences › Biochemistry, Genetics and Molecular Biology › Molecular Biology › RNA modifications and cancer
- Keywords
- ribosome profiling, ribosome occupancy, protein abundance estimation, translation mechanisms, parallel computing, quality control metrics
- MeSH terms
- Proteins, Ribosomes, Software, Sequence Analysis, Ecosystem
About these checks
Registry, retraction, Cites and statistics results are computed, not judged, with one exception: a printed reference that no index lists is read once by a model before it counts as a citation error. Claims are extracted by a model and kept only when their quote appears verbatim in the text; each cited source is then checked, with a model’s help, for whether it says what the claim relies on. Those verdicts can be wrong — read the claim’s quote and the cited source before relying on one.
Statistics and arithmetic are recomputed, not judged.
Confidence bands are shown only for fields calibrated on our annotated test set. None is calibrated yet, so no band is shown.
What counts as a claim ›How we measure confidence ›How we check this ›
Are you an author, or do you see a problem with this page? Request a review
