

The DOI matches its Crossref record; 42 of the 42 references it cites were found in a registry or an index.
HiCRep: assessing the reproducibility of Hi-C data using a stratum-adjusted correlation coefficient
Open accessPublished version of a preprint
Abstract
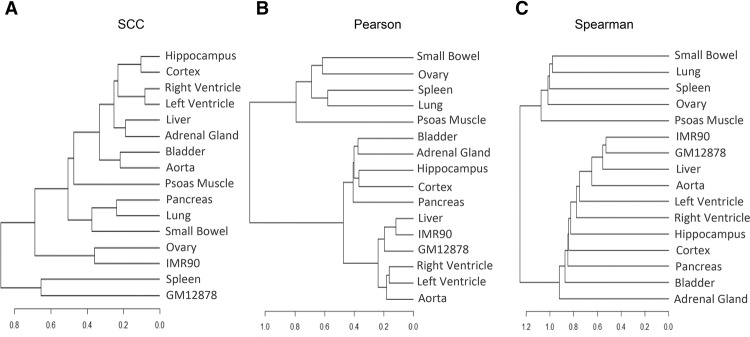
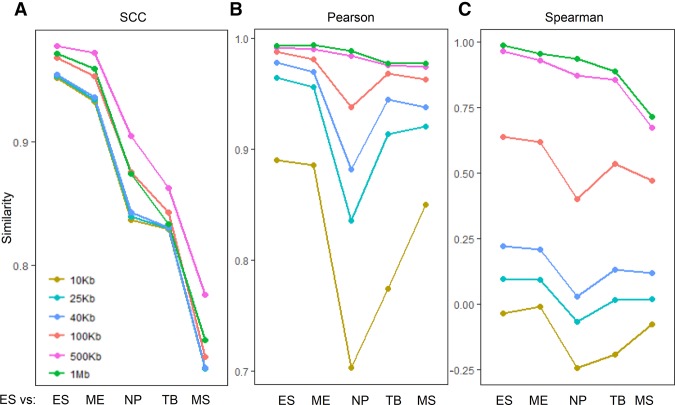
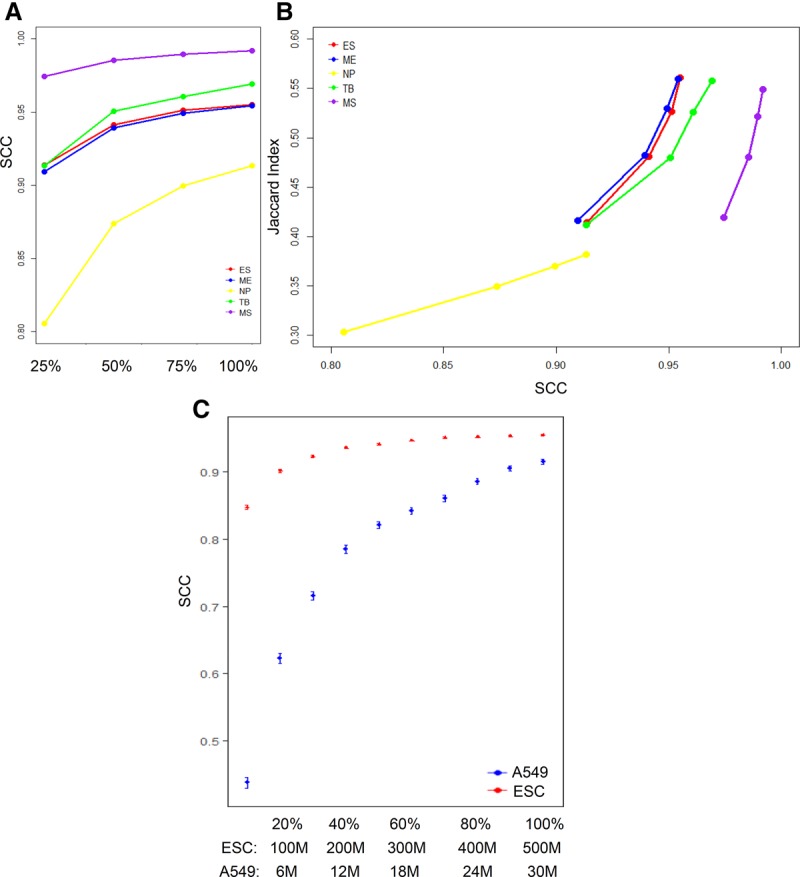
Hi-C is a powerful technology for studying genome-wide chromatin interactions. However, current methods for assessing Hi-C data reproducibility can produce misleading results because they ignore spatial features in Hi-C data, such as domain structure and distance dependence. We present HiCRep, a framework for assessing the reproducibility of Hi-C data that systematically accounts for these features. In particular, we introduce a novel similarity measure, the stratum adjusted correlation coefficient (SCC), for quantifying the similarity between Hi-C interaction matrices. Not only does it provide a statistically sound and reliable evaluation of reproducibility, SCC can also be used to quantify differences between Hi-C contact matrices and to determine the optimal sequencing depth for a desired resolution. The measure consistently shows higher accuracy than existing approaches in distinguishing subtle differences in reproducibility and depicting interrelationships of cell lineages. The proposed measure is straightforward to interpret and easy to compute, making it well-suited for providing standardized, interpretable, automatable, and scalable quality control. The freely available R package HiCRep implements our approach.
Overview
The claims and statistics of this paper haven’t been checked yet.
Run the check — free, no account needed. It reads the open-access text and checks the sources it cites.
Integrity signals
Registry
Cites
Statistics
Figures
Verification
Claims the paper makes
The claims and statistics of this paper haven’t been checked yet.
Run the check — free, no account needed. It reads the open-access text and checks the sources it cites.
Claims other papers make about this one
Each is checked against this paper’s own text: does it say what the citing paper says it does?
In the citing paper
“Notably, we found that samples were clustered by cell types, not individuals, and showed high correlation between the same cell types from different individuals (NeuN+ = 0.95–0.97; NeuN− = 0.86-0.91; Supplementary Fig. 3a), demonstrating the reproducibility across Hi–C libraries.”
From Neuronal and glial 3D chromatin architecture informs the cellular etiology of brain disorders (2021) · cites this paper as [19]
In the citing paper
“Clustering analysis by Hi-CRep49 showed that 5-AZA treated and DNMT TKD cells were more similar to each other than the DMSO treated cells (Fig. 6e).”
From Subtype-specific 3D genome alteration in acute myeloid leukaemia (2022) · cites this paper as [49]
Self-check
Percentages, sums and reported differences re-computed from the paper’s own numbers.
The self-check needs the paper’s full text.
Citations
Cites
R: A Language and Environment for Statistical Computing
R Core Team (2000) · doi:10.32614/r.manuals · Cited by 355,893
Fast and accurate short read alignment with Burrows-Wheeler transform
Li, H., & Durbin, R. (2009) · Bioinformatics · doi:10.1093/bioinformatics/btp324 · Cited by 58,607
An integrated encyclopedia of DNA elements in the human genome
The ENCODE Project Consortium (2012) · Nature · doi:10.1038/nature11247 · Cited by 18,072
Hapeman, D. E., & Agresti, A. (1991) · Technometrics · doi:10.1080/00401706.1991.10484817 · Cited by 9,407
A 3D Map of the Human Genome at Kilobase Resolution Reveals Principles of Chromatin Looping
Rao, S. S. P., Huntley, M. H., Durand, N. C., Stamenova, E. K., Bochkov, I. D., Robinson, J. T., Sanborn, A. L., Machol, I., Omer, A. D., Lander, E. S., et al. (2014) · Cell · doi:10.1016/j.cell.2014.11.021 · Cited by 9,212
Comprehensive Mapping of Long-Range Interactions Reveals Folding Principles of the Human Genome
Lieberman-Aiden, E., van Berkum, N. L., Williams, L., Imakaev, M., Ragoczy, T., Telling, A., Amit, I., Lajoie, B. R., Sabo, P. J., Dorschner, M. O., et al. (2009) · Science · doi:10.1126/science.1181369 · Cited by 8,898
Topological domains in mammalian genomes identified by analysis of chromatin interactions
Dixon, J. R., Selvaraj, S., Yue, F., Kim, A., Li, Y., Shen, Y., Hu, M., Liu, J. S., & Ren, B. (2012) · Nature · doi:10.1038/nature11082 · Cited by 6,829
Self-citationCapturing Chromosome Conformation
Dekker, J., Rippe, K., Dekker, M., & Kleckner, N. (2002) · Science · doi:10.1126/science.1067799 · Cited by 3,652
Chi-Square Tests with One Degree of Freedom; Extensions of the Mantel- Haenszel Procedure
Mantel, N. (1963) · Journal of the American Statistical Association · doi:10.1080/01621459.1963.10500879 · Cited by 2,899
HiC-Pro: an optimized and flexible pipeline for Hi-C data processing.
Servant, N., Varoquaux, N., Lajoie, B. R., Viara, E., Chen, C.-J., Vert, J.-P., Heard, E., Dekker, J., & Barillot, E. (2015) · Genome Biology · doi:10.1186/s13059-015-0831-x · Cited by 2,565 · cited 1×
“…replicates are available, it is a commonpracticetouseeitherPearsonorSpearmancorrelationco-efficients between the two Hi-C data matrices as a metric for data quality (Hu et al. 2012; Imakaev et al. 2012; Gorkin et al. 2014; Rao et al. 2014; Ay and Noble 2015; Dixon et al. 2015; Servant et al. 2015).”
Research works printed but not linked: 1
- Casella G , Berger GL . 2002. Statistical inference, 2nd ed. Duxbury Press, Pacific Grove, CA.
Cited by
Sorted by citations
Items 101–200 of 577
HiCRep.py: fast comparison of Hi-C contact matrices in Python
Lin, D., Sanders, J., & Noble, W. S. (2021) · Bioinformatics · doi:10.1093/bioinformatics/btab097 · Cited by 41
Self-citationA sustainable mouse karyotype created by programmed chromosome fusion
Wang, L.-B., Li, Z.-K., Wang, L.-Y., Xu, K., Ji, T.-T., Mao, Y.-H., Ma, S.-N., Liu, T., Tu, C., Zhao, Q.-Y., et al. (2022) · Science · doi:10.1126/science.abm1964 · Cited by 36
Analysis of the structural variability of topologically associated domains as revealed by Hi-C
Sauerwald, N., Singhal, A., & Kingsford, C. (2019) · NAR Genomics and Bioinformatics · doi:10.1093/nargab/lqz008 · Cited by 38
“This measure uses a stratum-adjusted correlation coe cient to reliably compute a statistical similarity score between two Hi-C matrices, explicitly accounting for both the strong distance dependence found in Hi-C and the known domain structure [45].”
Hilliard, W., & Lee, K. H. (2020) · Biotechnology and Bioengineering · doi:10.1002/bit.27599 · Cited by 41
“(SCC) for Chinese hamster chromosomes 1 through 10 and X at 100‐kb resolution using HiCRep (Yang et al., 2017).”
MethodInfluentialCHESS enables quantitative comparison of chromatin contact data and automatic feature extraction
Galan, S., Machnik, N., Kruse, K., Díaz, N., Martı́-Renom, M. A., & Vaquerizas, J. M. (2020) · Nature Genetics · doi:10.1038/s41588-020-00712-y · Cited by 38
Richart, L., Lapi, E., Pancaldi, V., Cuenca-Ardura, M., Pau, E. C. D. S., Madrid-Mencía, M., Neyret‐Kahn, H., Radvanyi, F., Rodríguez, J. A., Cuartero, Y., et al. (2021) · Nucleic Acids Research · doi:10.1093/nar/gkab864 · Cited by 38
“Reproducibility among Hi-C datasets, measured with a stratum-adjusted correlation coefficient (SCC) (45), was higher when comparing sh1 versus sh2 than when comparing each of the shRNAs with the control condition, suggesting that the changes in chromatin 3D configuration introduced by the two independent shRNAs are co…”
InfluentialQuASAR: Quality Assessment of Spatial Arrangement Reproducibility in Hi-C DataPreprint
Sauria, M. E. G., & Taylor, J. (2017) · bioRxiv (Cold Spring Harbor Laboratory) · doi:10.1101/204438 · Cited by 40
“Two recent publications describe tools to do just that [21, 22].”
BackgroundMethodSimultaneous profiling of chromatin architecture and transcription in single cells
Qu, J., Sun, J., Zhao, C., Liu, X., Zhang, X., Jiang, S., Wei, C., Yu, H., Zeng, X., Fan, L., et al. (2023) · Nature Structural & Molecular Biology · doi:10.1038/s41594-023-01066-9 · Cited by 39
Predicting Genome Architecture: Challenges and Solutions
Belokopytova, P. S., & Fishman, V. (2021) · Frontiers in Genetics · doi:10.3389/fgene.2020.617202 · Cited by 36
“However, replicates are not always available; in addition, Tao Yang et al. show that Pearson’s correlation between unrelated samples sometimes is equal to differences between replicates ( Figure 3 in Yang et al., 2017).”
BackgroundMethodInfluentialInter-chromosomal transcription hubs shape the 3D genome architecture of African trypanosomes
Rabuffo, C., Schmidt, M. R., Yadav, P., Tong, P., Carloni, R., Barcons-Simon, A., Cosentino, R. O., Krebs, S., Matthews, K. R., Allshire, R. C., et al. (2024) · Nature Communications · doi:10.1038/s41467-024-55285-9 · Cited by 38
Highsmith, M. R., & Cheng, J. J. (2021) · Scientific Reports · doi:10.1038/s41598-021-88115-9 · Cited by 37
Orchestrating chromosome conformation capture analysis with Bioconductor
Serizay, J., Matthey-Doret, C., Bignaud, A., Baudry, L., & Koszul, R. (2024) · Nature Communications · doi:10.1038/s41467-024-44761-x · Cited by 38
Xie, T., Danieli‐Mackay, A., Buccarelli, M., Barbieri, M., Papadionysiou, I., D’Alessandris, Q. G., Robens, C., Übelmesser, N., Vinchure, O. S., Lauretti, L., et al. (2024) · Nature Communications · doi:10.1038/s41467-024-48053-2 · Cited by 36
Generative modeling of multi-mapping reads with mHi-C advances analysis of Hi-C studies
Zheng, Y., Ay, F., & Keleş, S. (2019) · eLife · doi:10.7554/elife.38070 · Cited by 34
“To assess the recovery of the original contact matrix, we compared both the trimmed Uni-and Uni&Multi-settings with the gold standard Uni-setting at the full read length utilizing HiCRep ( Yang et al., 2017 ).”
MethodTAD fusion score: discovery and ranking the contribution of deletions to genome structure
Huynh, L. N., & Hormozdiari, F. (2019) · Genome biology · doi:10.1186/s13059-019-1666-7 · Cited by 35
“numbers on edges represent the SCC score (from HiCRep [50]).”
BackgroundMethodInfluentialRen, R., Fan, Y.-J., Peng, Z., Wang, S., Jiang, Y., Fu, L., Cao, J.-H., Zhao, S.-H., & Wang, H. (2022) · Cell Reports · doi:10.1016/j.celrep.2022.111206 · Cited by 27
Quantifying the similarity of topological domains across normal and cancer human cell types
Sauerwald, N., & Kingsford, C. (2018) · Bioinform. · doi:10.1093/bioinformatics/bty265 · Cited by 32
Computational methods for analyzing and modeling genome structure and organization
Lin, D., Bonora, G., Yardımcı, G. G., & Noble, W. S. (2018) · WIREs Systems Biology and Medicine · doi:10.1002/wsbm.1435 · Cited by 37
Self-citationLee, D.-I., & Roy, S. (2021) · Genome biology · doi:10.1186/s13059-021-02378-z · Cited by 34
“…of GRiNCH matrix completion as a smoothing method was compared to that of mean filter and Gaussian filter, two methods used in image blurring [86] and Hi-C data pre-processing [30, 42, 43], as well as HiCNN [32], a method based on convolutional neural network to impute interaction counts.”
InfluentialRahman, S., Dong, P., Apontes, P., Fernando, M. B., Kosoy, R., Townsley, K. G., Girdhar, K., Bendl, J. M., Shao, Z., Misir, R., et al. (2023) · Nucleic Acids Research · doi:10.1093/nar/gkad798 · Cited by 32
“Furthermore, as shown in our matrix reproducibility analysis with HiCRep ( 32 ), the early and late fetal samples cluster together, and the neuronal and glial samples from young and old adult brains cluster together (Supplementary Figure S1A).”
MethodInfluentialWu, H., Wu, Y., Jiang, Y., Zhou, B., Zhou, H., Chen, Z., Xiong, Y., Liu, Q., & Zhang, H. (2021) · Briefings in Bioinformatics · doi:10.1093/bib/bbab396 · Cited by 34
Nuclear morphology is shaped by loop-extrusion programs
Patta, I., Zand, M., Lee, L., Mishra, S. V., Bortnick, A., Lu, H., Prusty, A., McArdle, S., Mikulski, Z., Wang, H., et al. (2024) · Nature · doi:10.1038/s41586-024-07086-9 · Cited by 32
Chai, H., Huang, X., Xiong, G., Huang, J., Pels, K. K., Meng, L., Han, J., Tang, D., Pan, G., Deng, L., et al. (2025) · Nature Methods · doi:10.1038/s41592-025-02658-7 · Cited by 35
HIFI: estimating DNA-DNA interaction frequency from Hi-C data at restriction-fragment resolution
Cameron, C. J. F., Dostie, J., & Blanchette, M. (2020) · Genome biology · doi:10.1186/s13059-019-1913-y · Cited by 31
Ray-Jones, H., Duffus, K., McGovern, A., Martin, P., Shi, C., Hankinson, J., Gough, O., Yarwood, A., Morris, A. P., Adamson, A., et al. (2020) · BMC Biology · doi:10.1186/s12915-020-00779-3 · Cited by 31
Global chromatin conformation differences in the Drosophila dosage compensated chromosome X
Pal, K., Forcato, M., Jost, D., Sexton, T., Vaillant, C., Salviato, E., Mazza, E. M. C., Lugli, E., Cavalli, G., & Ferrari, F. (2019) · Nature Communications · doi:10.1038/s41467-019-13350-8 · Cited by 35
Duan, N., Hua, Y., Yan, X., He, Y., Zeng, T., Gong, J., Fu, Z., Li, W., & Yin, Y. (2024) · Advanced Science · doi:10.1002/advs.202309424 · Cited by 29
p53 rapidly restructures 3D chromatin organization to trigger a transcriptional response
Serra, F., Nieto-Aliseda, A., Fanlo, L., Rovirosa, L., Cabrera-Pasadas, M., Lazarenkov, A., Urmeneta, B., Alcalde-Merino, A., Nola, E., Okorokov, A. L., et al. (2024) · Nature Communications · doi:10.1038/s41467-024-46666-1 · Cited by 30
Niu, L., Shen, W., Huang, Y., He, N., Zhang, Y., Sun, J., Wan, J., Jiang, D., Yang, M., Tse, Y. C., et al. (2019) · Communications Biology · doi:10.1038/s42003-019-0519-y · Cited by 28
Comparison of Normalization Methods for Hi-C Data
Lyu, H., Liu, E., & Wu, Z. (2019) · BioTechniques · doi:10.2144/btn-2019-0105 · Cited by 30
Serna‐Pujol, N., Salinas‐Pena, M., Mugianesi, F., Dily, F. L., Martı́-Renom, M. A., & Jordan, A. (2022) · Nucleic Acids Research · doi:10.1093/nar/gkac226 · Cited by 28
“Replicates were compared and merged with TADbit merge that implements the HiCRep score (33).”
MethodHao, R.-H., Guo, Y., Wang, C., Chen, F., Di, C., Dong, S., Cao, Q.-L., Guo, J., Rong, Y., Yao, S., et al. (2022) · Cell Death and Differentiation · doi:10.1038/s41418-022-01035-7 · Cited by 34
Self-citationZhao, X., Peng, T., Cao, X., Hou, Y., Li, R., Han, T., Fan, Z., Zhao, M., Chang, Y., Chen, H., et al. (2022) · Cell Reports · doi:10.1016/j.celrep.2022.111342 · Cited by 30
Pre-mitotic genome re-organisation bookends the B cell differentiation process
Chan, W. F., Coughlan, H. D., Zhou, J. H. S., Keenan, C. R., Bediaga, N. G., Hodgkin, P. D., Smyth, G. K., Johanson, T. M., & Allan, R. S. (2021) · Nature Communications · doi:10.1038/s41467-021-21536-2 · Cited by 31
Erosion of the Epigenetic Landscape and Loss of Cellular Identity as a Cause of Aging in Mammals
Yang, J.-H., Griffin, P. T., Vera, D. L., Apostolides, J. K., Hayano, M., Meer, M. V., Salfati, E. L., Su, Q., Munding, E. M., Blanchette, M., et al. (2019) · doi:10.1101/808642 · Cited by 38
ProbC: joint modeling of epigenome and transcriptome effects in 3D genome
Sefer, E. (2022) · BMC Genomics · doi:10.1186/s12864-022-08498-5 · Cited by 32
“Additionally, both Spearman and Stratum-adjusted correlation coefficient [48] between P ROB C and HiC-Reg, EpiTensor, Rambutan performances is moderate, showing the impact of the difference between the nonlinear approaches these methods are based on.”
MethodDynamics of microcompartment formation at the mitosis-to-G1 transition
Goel, V. Y., Aboreden, N. G., Jusuf, J. M., Zhang, H., Mori, L., Mirny, L. A., Blobel, G. A., Banigan, E. J., & Hansen, A. S. (2025) · Nature Structural & Molecular Biology · doi:10.1038/s41594-025-01687-2 · Cited by 35
Wang, B., Ji, L., & Bian, Q. (2023) · Cell Reports · doi:10.1016/j.celrep.2023.112323 · Cited by 30
HiCSR: a Hi-C super-resolution framework for producing highly realistic contact mapsPreprint
Dimmick, M. C., Lee, L. J., & Frey, B. (2020) · bioRxiv · doi:10.1101/2020.02.24.961714 · Cited by 25
“Finally, we plan to improve upon this work by expanding the suite of similarity metrics used to compare performance to include Hi-C reproducibility methods such as HiCRep [26] and HiC-Spector [27] to gain further insight into both the strengths and weaknesses of the HiCSR framework.”
MethodRicher, S., Tian, Y., Schoenfelder, S., Hurst, L., Murrell, A., & Pisignano, G. (2022) · bioRxiv · doi:10.1186/s13059-023-02876-2 · Cited by 25
Measuring the reproducibility and quality of Hi-C dataPreprint
Yardımcı, G. G., Özadam, H., Sauria, M. E. G., Ursu, O., Yan, K., Yang, T., Chakraborty, A., Kaul, A., Lajoie, B. R., Song, F., et al. (2017) · bioRxiv (Cold Spring Harbor Laboratory) · doi:10.1101/188755 · Cited by 28
Self-citationWu, Y., Shi, Z., Zhou, X., Zhang, P., Yang, X., Ding, J., & Wu, H. (2024) · Communications Biology · doi:10.1038/s42003-024-06626-3 · Cited by 30
Olan, I., Ando‐Kuri, M., Parry, A., Handa, T., Schoenfelder, S., Fraser, P., Ohkawa, Y., Kimurâ, H., Narita, M., & Narita, M. (2024) · Nature Communications · doi:10.1038/s41467-024-51153-8 · Cited by 31
MATCHA: Probing Multi-way Chromatin Interaction with Hypergraph Representation Learning
Zhang, R., & Ma, J. (2020) · Cell Systems · doi:10.1016/j.cels.2020.04.004 · Cited by 28
Connecting high-resolution 3D chromatin organization with epigenomics
Feng, F., Yao, Y., Wang, X. Q. D., Zhang, X., & Liu, J. (2022) · Nature Communications · doi:10.1038/s41467-022-29695-6 · Cited by 28
“The mapping was validated by high SCCs with observed Micro-C contact maps and the accurate capture of fine-scale loops and stripes.”
MethodInfluentialNeguembor, M. V., Arcon, J. P., Buitrago, D., Lema, R., Walther, J., Garate, X., Martin, L., Romero-Marimon, P., Abed, J. A., Gut, M. O., et al. (2022) · Nature Structural & Molecular Biology · doi:10.1038/s41594-022-00839-y · Cited by 30
Evaluating the role of the nuclear microenvironment in gene function by population-based modeling
Yıldırım, A., Hua, N., Boninsegna, L., Zhan, Y., Polles, G., Gong, K. Q., Hao, S., Li, W., Zhou, X. J., & Alber, F. (2023) · Nature Structural & Molecular Biology · doi:10.1038/s41594-023-01036-1 · Cited by 28
Heterogeneous Loop Model to Infer 3D Chromosome Structures from Hi-C
Liu, L., Kim, M. H., & Hyeon, C. (2019) · Biophysical Journal · doi:10.1016/j.bpj.2019.06.032 · Cited by 26
SRHiC: A Deep Learning Model to Enhance the Resolution of Hi-C Data
Li, Z., & Dai, Z. (2020) · Frontiers in Genetics · doi:10.3389/fgene.2020.00353 · Cited by 26
Piwi–piRNA complexes induce stepwise changes in nuclear architecture at target loci
Iwasaki, Y. W., Sriswasdi, S., Kinugasa, Y., Adachi, J., Horikoshi, Y., Shibuya, A., Iwasaki, W., Tashiro, S., Tomonaga, T., & Siomi, H. (2021) · The EMBO Journal · doi:10.15252/embj.2021108345 · Cited by 27
HiCARN: resolution enhancement of Hi-C data using cascading residual networks
Hicks, P., & Oluwadare, O. (2022) · Bioinformatics · doi:10.1093/bioinformatics/btac156 · Cited by 26
Genome folding principles uncovered in condensin-depleted mitotic chromosomes
Zhao, H., Lin, Y., Lin, E., Liu, F., Shu, L., Jing, D., Wang, B., Wang, M., Shan, F., Zhang, L., et al. (2024) · Nature Genetics · doi:10.1038/s41588-024-01759-x · Cited by 26
Self-citationNicE-C efficiently reveals open chromatin–associated chromosome interactions at high resolutionPreprint
Luo, Z.-Y., Zhang, R., Hu, T.-F., Zhu, Y.-T., Wu, Y.-M., Li, W.-F., Zhang, Z., Yao, X.-B., Liang, H.-Y., & Song, X.-Y. (2022) · Genome Research · doi:10.1101/gr.275986.121 · Cited by 20
“The reproducibility of NicE-C and Hi-C valid pairs were evaluated by Hi-Rep (Yang et al. 2017).”
MethodDiffDomain enables identification of structurally reorganized topologically associating domains
Hua, D., Gu, M., Zhang, X., Du, Y., Xie, H., Qi, L., Du, X., Bai, Z., Zhu, X., & Tian, D. (2024) · Nature Communications · doi:10.1038/s41467-024-44782-6 · Cited by 24
SATB2 organizes the 3D genome architecture of cognition in cortical neurons
Wahl, N., Espeso‐Gil, S., Chietera, P., Nagel, A., Laighneach, A., Morris, D. W., Rajarajan, P., Akbarian, S., Dechant, G., & Apostolova, G. (2024) · Molecular Cell · doi:10.1016/j.molcel.2023.12.024 · Cited by 24
Exploring the roles of RNAs in chromatin architecture using deep learning
Kuang, S., & Pollard, K. S. (2024) · Nature Communications · doi:10.1038/s41467-024-50573-w · Cited by 26
“Here, SCC is the weighted sum of Pearson ’ s correlation for each stratum and shares the similar range as Pearson ’ s correlation coef fi cients 81 .”
Narducci, D. N., & Hansen, A. S. (2025) · Molecular Cell · doi:10.1016/j.molcel.2024.11.032 · Cited by 25
Auxin-inducible degron 2 system deciphers functions of CTCF domains in transcriptional regulation
Hyle, J. W., Djekidel, M. N., Williams, J. S., Wright, S., Shao, Y., Xu, B.-S., & Li, C.-L. (2023) · Genome Biology · doi:10.1186/s13059-022-02843-3 · Cited by 19
“After confirmation of reproducibility by HiC-Spector [58] and HiCRep [59], contacts from replicates were merged and call loops using FitHiChIP (Stringent mode using Coverage for normalization) [60] based on CTCF peaks from GSM3312803 [61].”
MethodInfluentialBarajas-Mora, E. M., Lee, L., Lu, H., Valderrama, J. A., Bjånes, E., Nizet, V., Feeney, A. J., Hu, M., & Murre, C. (2023) · Nature Immunology · doi:10.1038/s41590-022-01402-z · Cited by 26
Lamy-Besnier, Q., Bignaud, A., Garneau, J. R., Titécat, M., Conti, D. E., von Strempel, A., Monot, M., Stecher, B., Koszul, R., Debarbieux, L., et al. (2023) · Microbiome · doi:10.1186/s40168-023-01541-x · Cited by 28
Noack, F., Vangelisti, S., Ditzer, N., Chong, F., Albert, M., & Bonev, B. (2023) · Nature Cell Biology · doi:10.1038/s41556-023-01296-5 · Cited by 27
HiC-ACT: improved detection of chromatin interactions from Hi-C data via aggregated Cauchy test
Lagler, T. M., Abnousi, A., Hu, M., Yang, Y., & Li, Y. (2021) · The American Journal of Human Genetics · doi:10.1016/j.ajhg.2021.01.009 · Cited by 24
Li, D., Zhao, X., Zhou, S., Hu, Q., Wu, F., & Lee, H. (2023) · Nucleic Acids Research · doi:10.1093/nar/gkad468 · Cited by 24
SARS-CoV-2 Restructures the Host Chromatin ArchitecturePreprint
Wang, R.-Y., Lee, J.-H., Xiong, F., Kim, J., Hasani, L. A., Yuan, X.-Y., Shivshankar, P., Krakowiak, J., Qi, C.-Y., Wang, Y.-Y., et al. (2021) · bioRxiv · doi:10.1101/2021.07.20.453146 · Cited by 40
Elementary 3D organization of active and silenced E. coli genome
Gavrilov, A. A., Shamovsky, I., Zhegalova, I. V., Proshkin, S., Shamovsky, Y., Evko, G. S., Epshtein, V., Rasouly, A., Blavatnik, A., Lahiri, S., et al. (2025) · Nature · doi:10.1038/s41586-025-09396-y · Cited by 23
Taghbalout, A., Tung, C.-H., Clow, P. A., Tjong, H., Wang, P., Wong, C., Mao, D. D., Maurya, R., Huang, M., Ngan, C. Y., et al. (2025) · Cancer Cell · doi:10.1016/j.ccell.2025.08.008 · Cited by 28
Extracting multi-way chromatin contacts from Hi-C data
Liu, L., Zhang, B., & Hyeon, C. (2021) · PLoS Computational Biology · doi:10.1371/journal.pcbi.1009669 · Cited by 27
Zhu, X., Qi, C.-Y., Wang, R.-Y., Lee, J.-H., Shao, J., Bei, L.-X., Xiong, F., Nguyen, P. T., Li, G., Krakowiak, J., et al. (2022) · Cell Reports · doi:10.1016/j.celrep.2022.111576 · Cited by 20
“Triplicates of in situ Hi-C data were sequenced in total to ~570–660 millions of reads per condition (Table S1), and they are of high concordance (Yang et al., 2017; Figure S6A).”
TULIPs decorate the three-dimensional genome of PFA ependymoma
Johnston, M. J. G., Lee, J. J. Y., Hu, B., Nikolić, A., Hasheminasabgorji, E., Baguette, A., Paik, S., Chen, H., Kumar, S. A., Chen, C. C. L., et al. (2024) · Cell · doi:10.1016/j.cell.2024.06.023 · Cited by 22
scHiCTools: A computational toolbox for analyzing single-cell Hi-C data
Li, X., Feng, F., Pu, H., Leung, W. Y., & Liu, J. (2021) · PLoS Computational Biology · doi:10.1371/journal.pcbi.1008978 · Cited by 22
“In practice, although taking the median may make the matrix no longer positive definite, it makes the similarity more stable and robust to noisy measurements. fastHiCRep is a faster implementation of the original HiCRep approach [5].”
MethodInfluentialGenome-wide absolute quantification of chromatin looping
Jusuf, J. M., Yang, J. H., Toppen, J., Grosse-Holz, S., Gabriele, M., Mach, P., Flyamer, I. M., Zechner, C., Giorgetti, L., Mirny, L. A., et al. (2026) · Nature Structural & Molecular Biology · doi:10.1038/s41594-026-01819-2 · Cited by 22
Cao, C., Xu, Q., Zhu, Z., Xu, M., Ye, W., Lin, S., Sheng, C., Zhi, W., Hong, P., Huang, X., et al. (2024) · Cancer Letters · doi:10.1016/j.canlet.2024.216809 · Cited by 22
Li, B., Xiong, W., Zuo, W., Shi, Y., Wang, T., Chang, L., Wu, Y., Ma, H., Bian, Q., & Chang, A. C. Y. (2024) · Nucleic Acids Research · doi:10.1093/nar/gkae274 · Cited by 26
HiCRes: a computational method to estimate and predict the genomic resolution of Hi-C libraries
Marchal, C., Singh, N., Corso‐Díaz, X., & Swaroop, A. (2021) · Nucleic Acids Research · doi:10.1093/nar/gkab1235 · Cited by 23
Reorganization of 3D genome architecture across wild boar and Bama pig adipose tissues
Zhang, J., Liu, P., He, M., Wang, Y., Kui, H., Jin, L. G., Li, D., & Li, M. (2022) · Journal of Animal Science and Biotechnology/Journal of animal science and biotechnology · doi:10.1186/s40104-022-00679-2 · Cited by 24
“The global contact maps obtained for replicates were highly reproducible as determined by HiCRep [21] (median stratum-adjusted correlation coefficient [SCC] = 0.83), and the contact maps for the same adipose depots were also highly similar between wild boars and Bama pigs (median SCC = 0.82) (Fig.”
MethodInfluentialNakato, R., Sakata, T., Wang, J., Nagai, L. A. E., Nagaoka, Y., Oba, G. M., Bando, M., & Shirahige, K. (2023) · Nature Communications · doi:10.1038/s41467-023-41316-4 · Cited by 22
FreeHi-C simulates high-fidelity Hi-C data for benchmarking and data augmentation
Zheng, Y., & Keleş, S. (2019) · Nature Methods · doi:10.1038/s41592-019-0624-3 · Cited by 21
Shi, Z., Cong, L., & Wu, H. (2025) · IEEE Journal of Biomedical and Health Informatics · doi:10.1109/jbhi.2025.3595904 · Cited by 22
“To further enhance data accuracy and reliability, we computationally transform chromosomal interaction data for each cell into a chromosomal contact matrix [6], [7], [32], [33], [34], [35], [36], [37], [38].”
EnHiC: learning fine-resolution Hi-C contact maps using a generative adversarial framework
Hu, Y., & Ma, W.-X. (2021) · Bioinform. · doi:10.1093/bioinformatics/btab272 · Cited by 16
Tolokh, I. S., Kinney, N. A., Sharakhov, I. V., & Onufriev, A. V. (2023) · Epigenetics & Chromatin · doi:10.1186/s13072-023-00492-9 · Cited by 21
“03), which are most affected by the noise component, effectively divides the experimental Hi-C map into two strata [131]; the corresponding Pearson’s coefficient between model and experiment increases to 0.”
BackgroundDynamic chromatin architecture of the porcine adipose tissues with weight gain and loss
Jin, L. G., Wang, D., Zhang, J., Liu, P., Wang, Y., Yu, L., Liu, C., Han, Z., Long, K., Li, D., et al. (2023) · Nature Communications · doi:10.1038/s41467-023-39191-0 · Cited by 21
Three-dimensional chromatin architecture datasets for aging and Alzheimer’s disease
Meng, G., Xu, H., Lu, D., Li, S., Zhao, Z., Li, H., & Zhang, W. (2023) · Scientific Data · doi:10.1038/s41597-023-01948-z · Cited by 20
Zhao, Z., Hu, B., Deng, Y., Soeung, M., Yao, J., Bei, L.-X., Zhang, Y., Gong, P.-J., Huang, L. A., Jiang, Z., et al. (2025) · Immunity · doi:10.1016/j.immuni.2025.04.020 · Cited by 16
Chu, X., & Wang, J. (2022) · Physical Review Letters · doi:10.1103/physrevlett.129.068102 · Cited by 17
Low input capture Hi-C (liCHi-C) identifies promoter-enhancer interactions at high-resolution
Tomás-Daza, L., Rovirosa, L., López-Martí, P., Nieto-Aliseda, A., Serra, F., Planas‐Riverola, A., Molina, Ò., McDonald, R., Ghevaert, C., Cuatrecasas, E., et al. (2023) · Nature Communications · doi:10.1038/s41467-023-35911-8 · Cited by 22
KDM3B inhibitors disrupt the oncogenic activity of PAX3-FOXO1 in fusion-positive rhabdomyosarcoma
Kim, Y., Gryder, B., Sinniah, R., Peach, M. L., Shern, J., Abdelmaksoud, A., Pomella, S., Woldemichael, G., Stanton, B. Z., Milewski, D., et al. (2024) · Nature Communications · doi:10.1038/s41467-024-45902-y · Cited by 25
“A head to head comparison between ARMS and ERMS using O-PDXs may be beneficial.”
Removing unwanted variation between samples in Hi-C experiments
Fletez‐Brant, K., Qiu, Y., Gorkin, D. U., Hu, M., & Hansen, K. D. (2024) · Briefings in Bioinformatics · doi:10.1093/bib/bbae217 · Cited by 19
“Following the log counts per million transformation of the raw contact matrices, we smooth individual chromosome matrices using a box smoother with a bandwidth of 5, as selected by the HiCRep approach (Yang, Zhang, et al., 2017).”
BackgroundMethodInfluentialPaldi, F., Szalay, M.-F., Dufau, S., Di Stefano, M., Reboul, H., Jost, D., Bantignies, F., & Cavalli, G. (2026) · Nature Genetics · doi:10.1038/s41588-025-02489-4 · Cited by 18
STAG2 Promotes the Myelination Transcriptional Program in Oligodendrocytes
Cheng, N., Li, G., Kanchwala, M., Evers, B. M., Xing, C., & Yu, H. (2021) · eLife · doi:10.7554/elife.77848 · Cited by 19
Ahmed, I., Yang, S., Ogden, S., Zhang, W., Li, Y., & Sharrocks, A. D. (2023) · eLife · doi:10.7554/elife.80840 · Cited by 18
Comparing chromatin contact maps at scale: methods and insights
Gjoni, K., Gunsalus, L. M., Kuang, S., McArthur, E., Pittman, M., Capra, J. A., & Pollard, K. S. (2025) · Nature Methods · doi:10.1038/s41592-025-02630-5 · Cited by 19
“For example, SCC and Correlation share 88% of their top maps, and neither of these methods has uniquely high-scoring maps (Extended Data Figs.”
InfluentialBoost-HiC: computational enhancement of long-range contacts in chromosomal contact maps
Carron, L., Morlot, J. B., Matthys, V., Lesne, A., & Mozziconacci, J. (2018) · Bioinformatics · doi:10.1093/bioinformatics/bty1059 · Cited by 18
IDR2D identifies reproducible genomic interactions
Krismer, K., Guo, Y., & Gifford, D. K. (2020) · Nucleic Acids Research · doi:10.1093/nar/gkaa030 · Cited by 18
Erythrocytes 3D genome organization in vertebrates
Ryzhkova, A. S., Taskina, A., Khabarova, A. A., Fishman, V., & Баттулин, Н. Р. (2021) · Scientific Reports · doi:10.1038/s41598-021-83903-9 · Cited by 18
HiC1Dmetrics: framework to extract various one-dimensional features from chromosome structure data
Wang, J., & Nakato, R. (2021) · Briefings in Bioinformatics · doi:10.1093/bib/bbab509 · Cited by 17
“To further evaluate the clustering performance of 1D metrics, we carried out the same clustering analysis but applied SCC (stratum-adjusted correlation coefficient [38]), a designed score (not 1D metric) for measuring similarities between Hi-C interaction matrices.”
Method3D chromatin structure in chondrocytes identifies putative osteoarthritis risk genes
Thulson, E., Davis, E. S., D’Costa, S., Coryell, P., Kramer, N. E., Mohlke, K. L., Loeser, R. F., Diekman, B. O., & Phanstiel, D. H. (2022) · Genetics · doi:10.1093/genetics/iyac141 · Cited by 19
Genetic coupling of enhancer activity and connectivity in gene expression control
Ray-Jones, H. F., Sung, C. K., Chan, L. T., Haglund, A., Artemov, P., Rosa, M. D., Ruje, L., Burden, F., Kreuzhuber, R., Litovskikh, A., et al. (2025) · Nature Communications · doi:10.1038/s41467-025-55900-3 · Cited by 17
Topological Data Analysis of Single-Cell Hi-C Contact Maps
Carrière, M., & Rabadán, R. (2020) · Abel symposia · doi:10.1007/978-3-030-43408-3_6 · Cited by 18
Inference of chromosome 3D structures from GAM data by a physics computational approach
Fiorillo, L., Bianco, S., Chiariello, A. M., Barbieri, M., Esposito, A., Annunziatella, C., Conte, M., Corrado, A., Prisco, A., Pombo, A., et al. (2019) · Methods · doi:10.1016/j.ymeth.2019.09.018 · Cited by 19
Are dropout imputation methods for scRNA-seq effective for scHi-C data?
Han, C., Xie, Q. S., & Lin, S. (2020) · Briefings in Bioinformatics · doi:10.1093/bib/bbaa289 · Cited by 17
“In particular, HiCRep [8] is developed to calculate the reproductivity of Hi-C data, and it takes a 2D mean filter approach to replace each contact with the average count of its neighbors.”
Method
Metadata
- Authors
- Yang, T., Zhang, F., Yardımcı, G. G., Song, F., Hardison, R. C., Noble, W. S., Yue, F., & Li, Q.
- Affiliations
- Pennsylvania State University (US)
- University of Washington (US)
- ORCID
- Venue
- Genome Research
- Publisher
- Cold Spring Harbor Laboratory
- Published
- 2017-08-30
- Volume
- 27
- Issue
- 11
- Pages
- 1939-1949
- ISSN
- 1088-9051 (ISSN-L)
- 1549-5469
- PMC
- PMC5668950
- OpenAlex
- W2952940726
- Cited by
- 533
- References
- 41
- Citations by year
- 2026: 48 · 2025: 68 · 2024: 98 · 2023: 69 · 2022: 57 · 2021: 73 · 2020: 60 · 2019: 38 · 2018: 18 · 2017: 4
- Type
- posted content
- Language
- en
- Open access
- hybrid
- doi.org
- Licence
- public-domain
- Locations
- Genome Research (publishedVersion, public-domain)
- bioRxiv (Cold Spring Harbor Laboratory) (acceptedVersion, cc-by-nc-nd)
- Europe PMC (PubMed Central) (publishedVersion, cc-by-nc)
- PubMed Central (publishedVersion, cc-by-nc)
- PubMed (publishedVersion)
- HighWire Press Open Archive (submittedVersion)
- Funders
- National Institutes of Health (T32 GM102057)
- Huck Graduate Research Innovation
- NIH (R01GM109453, U01CA200060, R24DK106766, U54HG006998, U41HG007000)
- Topics
- Life Sciences › Biochemistry, Genetics and Molecular Biology › Molecular Biology › Genomics and Chromatin Dynamics
- Life Sciences › Biochemistry, Genetics and Molecular Biology › Molecular Biology › Genomics and Phylogenetic Studies
- Life Sciences › Biochemistry, Genetics and Molecular Biology › Genetics › Genomic variations and chromosomal abnormalities
- Keywords
- Hi-C, domain structure, distance dependence, cell lineage
- MeSH terms
- Cell Line, Humans, Software, Reproducibility of Results, Sequence Analysis, RNA, Cell Lineage, Computational Biology, Chromatin Immunoprecipitation, High-Throughput Nucleotide Sequencing
About these checks
Registry, retraction, Cites and statistics results are computed, not judged, with one exception: a printed reference that no index lists is read once by a model before it counts as a citation error. Claims are extracted by a model and kept only when their quote appears verbatim in the text; each cited source is then checked, with a model’s help, for whether it says what the claim relies on. Those verdicts can be wrong — read the claim’s quote and the cited source before relying on one.
Statistics and arithmetic are recomputed, not judged.
Confidence bands are shown only for fields calibrated on our annotated test set. None is calibrated yet, so no band is shown.
What counts as a claim ›How we measure confidence ›How we check this ›
Are you an author, or do you see a problem with this page? Request a review
