Cited by 6

The DOI matches its Crossref record.

Partial information decomposition for discrete target and continuous source random variables

Barà, Chiara, Antonacci, Yuri, Iovino, Marta, Lazic, Ivan, Faes, Luca·2025·Physical Review E

Overview

The claims and statistics of this paper haven’t been checked yet.

Run the check — free, no account needed. It reads the open-access text and checks the sources it cites.

A few free checks a day · papers already verified open instantly · results are public

Integrity signals

Registry

Crossref · 10.1103/58bg-5n9s

Cites

Statistics

Figures

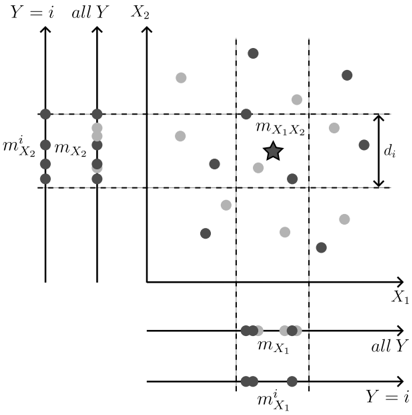
Figure 1 Schematic representation of the nearest-neighbor estimation of the specific MI (5) for a binary target variable Y and two continuous sources X 1 and X 2 . The estimation proceeds by computing the distance (here, the Chebyshev distance) between each reference sample x i (star symbol) and its k th neighbor (here, k = 2 ) counted among the samples with Y = i (black circles), and then counting the number of samples falling within this distance in the two-dimensional space ( m X 1 X 2 = 3 ) and in the projected one-dimensional spaces considering all samples ( m X 1 = 6 , m X 2 = 7 ) or only the samples for which { Y = i } ( m i X 1 = 3 , m i X 2 = 4 ).
Figure 1 Schematic representation of the nearest-neighbor estimation of the specific MI (5) for a binary target variable Y and two continuous sources X 1 and X 2 . The estimation proceeds by computing the distance (here, the Chebyshev distance) between each reference sample x i (star symbol) and its k th neighbor (here, k = 2 ) counted among the samples with Y = i (black circles), and then counting the number of samples falling within this distance in the two-dimensional space ( m X 1 X 2 = 3 ) and in the projected one-dimensional spaces considering all samples ( m X 1 = 6 , m X 2 = 7 ) or only the samples for which { Y = i } ( m i X 1 = 3 , m i X 2 = 4 ).CC-BY · From the PDF
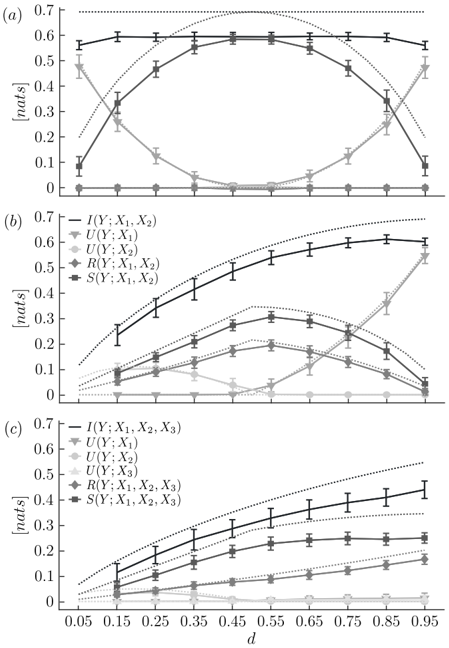
Figure 2 Theoretical values (dotted lines) and estimated distributions (solid lines, mean ± std. dev. over 100 simulations) of the PID measures obtained for the XOR gate ( a ), and for the AND gates with 2 ( b ) or 3 sources ( c ).
Figure 2 Theoretical values (dotted lines) and estimated distributions (solid lines, mean ± std. dev. over 100 simulations) of the PID measures obtained for the XOR gate ( a ), and for the AND gates with 2 ( b ) or 3 sources ( c ).CC-BY · From the PDF
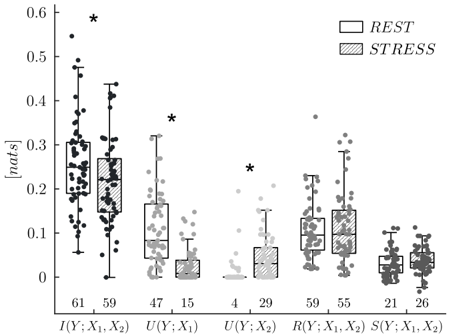
Figure 3 Boxplot distributions and individual values of the PID applied to the MI between the binary target variable Y measuring inspiration/expiration and the continuous source variables X 1 and X 2 measuring respectively heart period and systolic arterial pressure, computed in conditions of resting state and postural stress. *, p < 0 . 05 paired Student's t -test, REST vs. STRESS. The number of subjects for which each measure is statistically significant according to surrogate data analysis is shown below each boxplot.
Figure 3 Boxplot distributions and individual values of the PID applied to the MI between the binary target variable Y measuring inspiration/expiration and the continuous source variables X 1 and X 2 measuring respectively heart period and systolic arterial pressure, computed in conditions of resting state and postural stress. *, p < 0 . 05 paired Student's t -test, REST vs. STRESS. The number of subjects for which each measure is statistically significant according to surrogate data analysis is shown below each boxplot.CC-BY · From the PDF
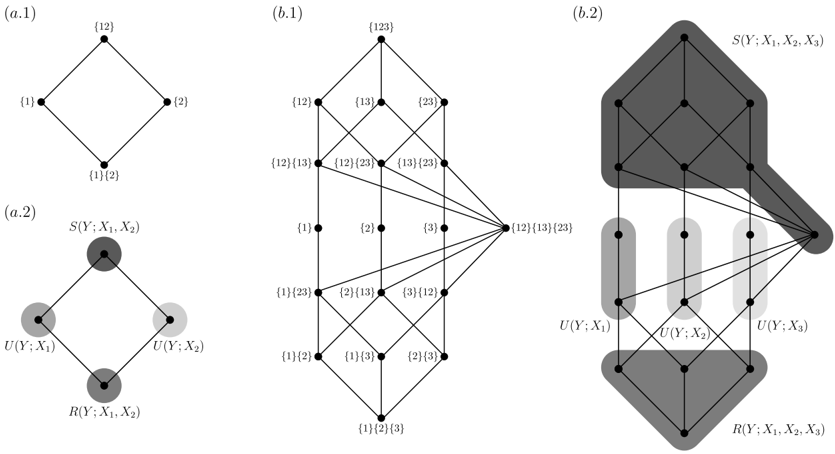
Figure S.1. Redundancy lattices representing the PI atoms ordering (panels .1 ) and the PID components definition (panels .2 ) for the PID with two sources (panels a. ) and for the PID with three sources (panels b. ).
Figure S.1. Redundancy lattices representing the PI atoms ordering (panels .1 ) and the PID components definition (panels .2 ) for the PID with two sources (panels a. ) and for the PID with three sources (panels b. ).CC-BY · From the PDF
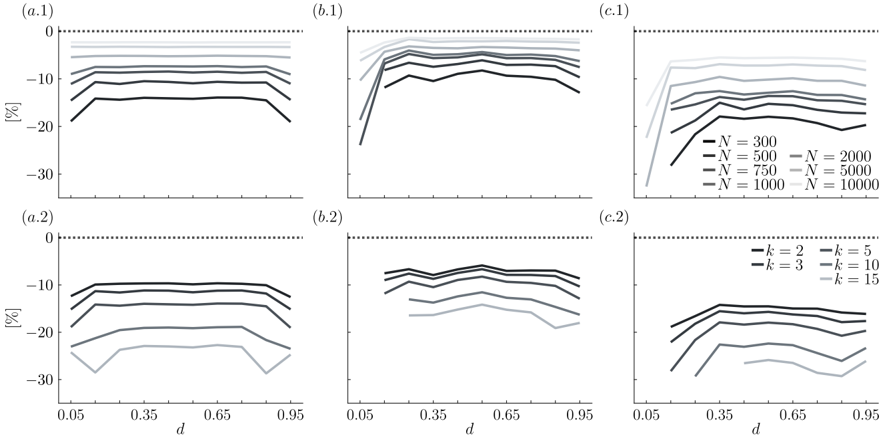
Figure S.2. Average estimation of the percentage bias in computing the measure I ( Y ; X ) on one-hundred realizations of the XOR-logic gate between two sources (panel a. ), of the AND-logic gate between two (panel b. ) and three (panel c. ) sources at varying the variable realizations length N fi xing k = 5 (panel .1 ) and the number of neighbors k fi xing N = 300 (panel .2 ).
Figure S.2. Average estimation of the percentage bias in computing the measure I ( Y ; X ) on one-hundred realizations of the XOR-logic gate between two sources (panel a. ), of the AND-logic gate between two (panel b. ) and three (panel c. ) sources at varying the variable realizations length N fi xing k = 5 (panel .1 ) and the number of neighbors k fi xing N = 300 (panel .2 ).CC-BY · From the PDF
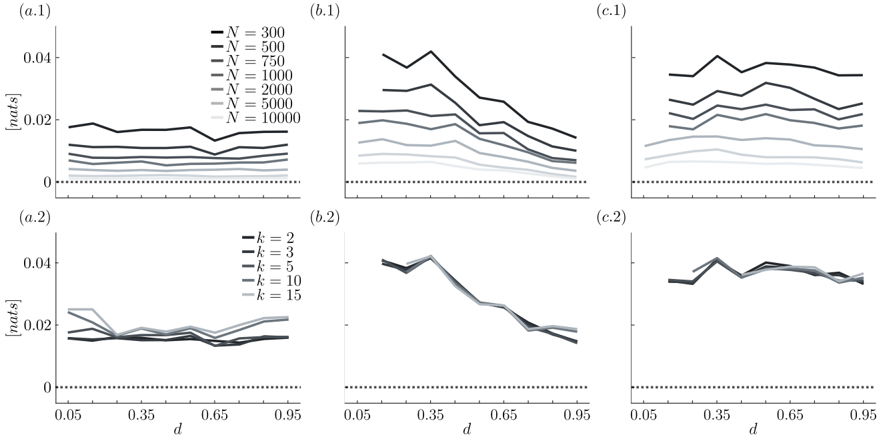
Figure S.3. Standard deviation of the estimates of I ( Y ; X ) on one-hundred realizations of the XOR-logic gate between two sources (panel a. ), of the AND-logic gate between two (panel b. ) and three (panel c. ) sources at varying the variable realizations length N fi xing k = 5 (panel .1 ) and the number of neighbors k fi xing N = 300 (panel .2 ).
Figure S.3. Standard deviation of the estimates of I ( Y ; X ) on one-hundred realizations of the XOR-logic gate between two sources (panel a. ), of the AND-logic gate between two (panel b. ) and three (panel c. ) sources at varying the variable realizations length N fi xing k = 5 (panel .1 ) and the number of neighbors k fi xing N = 300 (panel .2 ).CC-BY · From the PDF
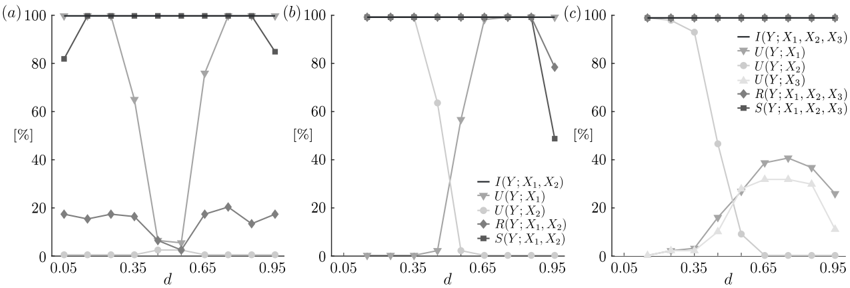
Figure S.4. Percentage of realizations for which PID measures are statistically significant according to surrogate data analysis on simulated logic XOR (panel a ) and AND (panel b ) gates with 2 sources, and logic AND gate with 3 sources (panel c ).
Figure S.4. Percentage of realizations for which PID measures are statistically significant according to surrogate data analysis on simulated logic XOR (panel a ) and AND (panel b ) gates with 2 sources, and logic AND gate with 3 sources (panel c ).CC-BY · From the PDF
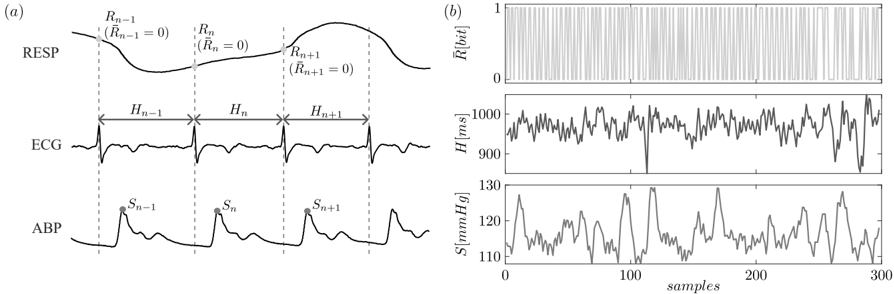
Figure S.5. Schematic representation of the procedure for extracting the time series from the synchronously acquired respiratory (RESP), electrocardiographic (ECG) and arterial blood pressure (ABP) signals (panel a ), and resulting time series representative of respiratory phase ( ¯ R ), heart period ( H ) and systolic arterial pressure ( S ) physiological dynamics, respectively (panel b ).
Figure S.5. Schematic representation of the procedure for extracting the time series from the synchronously acquired respiratory (RESP), electrocardiographic (ECG) and arterial blood pressure (ABP) signals (panel a ), and resulting time series representative of respiratory phase ( ¯ R ), heart period ( H ) and systolic arterial pressure ( S ) physiological dynamics, respectively (panel b ).CC-BY · From the PDF

Verification

Claims the paper makes

The claims and statistics of this paper haven’t been checked yet.

Run the check — free, no account needed. It reads the open-access text and checks the sources it cites.

A few free checks a day · papers already verified open instantly · results are public

Claims other papers make about this one

Each is checked against this paper’s own text: does it say what the citing paper says it does?

Self-check

Percentages, sums and reported differences re-computed from the paper’s own numbers.

The self-check needs the paper’s full text.

Citations

Cites

No references could be resolved yet.

Research works printed but not linked: 34

  1. 10.1016/j.bandc.2015.09.004 · DOI
  2. 10.1371/journal.pcbi.1009196 · DOI
  3. 10.1098/rsta.2020.0250 · DOI
  4. 10.3390/e24101387 · DOI
  5. P. Wollstadt, 2023, J. Mach. Learn. Res., 24, 1
  6. 10.1103/PhysRevResearch.6.L032007 · DOI
  7. 10.1103/PhysRevE.87.012130 · DOI
  8. 10.3390/e16042161 · DOI · Paper page
  9. 10.1103/PhysRevE.91.052802 · DOI
  10. 10.3390/e19070318 · DOI
  11. See Supplemental Material at http://link.aps.org/supplemental/10.1103/58bg-5n9s for a detailed description of the proposed methodology, details about real data analyzed, and a description of the codes implementing the proposed methodology, which includes Refs. [28, 29, 30, 31, 32, 33, 34, 35, 36].
  12. A. Pakman, 2021, Adv. Neu. In., 34, 20295
  13. 10.1103/PhysRevE.110.014115 · DOI
  14. 10.1073/pnas.2300888120 · DOI · Paper page
  15. 10.1016/j.cub.2024.03.023 · DOI
  16. 10.1080/18756891.2016.1204120 · DOI
  17. 10.1038/14731 · DOI
  18. 10.1371/journal.pone.0087357 · DOI
  19. 10.1098/rspa.2021.0110 · DOI
  20. 10.1371/journal.pcbi.1008289 · DOI
  21. 10.1103/PhysRevE.69.066138 · DOI · Paper page
  22. 10.1016/j.neucom.2013.06.035 · DOI
  23. G. Ver Steeg, 2014, Proceedings of the 31st International Conference on Machine Learning, Beijing, China
  24. 10.1007/s10827-013-0458-4 · DOI
  25. S. Baladram, Iris dataset extended, (2023), https://doi.org/10.34740/kaggle/ds/3916784. · DOI
  26. V. Griffith, 2014, Guided Self-Organization: Inception
  27. 10.1103/PhysRevE.103.032149 · DOI
  28. L. Faes, 2014, Directed Information Measures in Neuroscience
  29. 10.1016/j.bbe.2024.04.004 · DOI
  30. 10.1142/S0218127409025298 · DOI
  31. 10.1016/j.compbiomed.2018.05.007 · DOI
  32. 10.1152/japplphysiol.91107.2008 · DOI
  33. 10.1186/s40101-016-0113-7 · DOI
  34. 10.1186/1471-2202-12-119 · DOI

Cited by

Sorted by citations

Metadata

Authors
Barà, C., Antonacci, Y., Iovino, M., Lazic, I., & Faes, L.
Affiliations
  • University of Palermo
  • University of Novi Sad
Venue
Physical Review E
Published
2025-07-23
Volume
112
Issue
1
ISSN
  • 2470-0045
  • 2470-0053
Cited by
6
References
0
Language
en
Funders
Ministero dell'Università e della Ricerca (B53D23003020006)

About these checks

Registry, retraction, Cites and statistics results are computed, not judged, with one exception: a printed reference that no index lists is read once by a model before it counts as a citation error. Claims are extracted by a model and kept only when their quote appears verbatim in the text; each cited source is then checked, with a model’s help, for whether it says what the claim relies on. Those verdicts can be wrong — read the claim’s quote and the cited source before relying on one.

Statistics and arithmetic are recomputed, not judged.

Confidence bands are shown only for fields calibrated on our annotated test set. None is calibrated yet, so no band is shown.

What counts as a claim ›How we measure confidence ›How we check this ›

Are you an author, or do you see a problem with this page? Request a review