

The DOI matches its Crossref record; 31 of the 31 references it cites were found in a registry or an index.
EcologicalNetworks.jl: analysing ecological networks of species interactions
Abstract
Networks are a convenient way to represent many interactions among ecological entities. The analysis of ecological networks is challenging for two reasons. First, there is a plethora of measures that can be applied (and some of them measure the same property). Second, the implementation of these measures is sometimes difficult. We present ’EcologicalNetworks.jl’, a package for the ‘Julia’ programming language. Using a layered system of types to represent several types of ecological networks, this packages offers a solid library of basic functions which can be chained together to perform the most common analyses of ecological networks.
Overview
The claims and statistics of this paper haven’t been checked yet.
Run the check — free, no account needed. It reads the open-access text and checks the sources it cites.
Integrity signals
Registry
Cites
Statistics
Figures
Verification
Claims the paper makes
The claims and statistics of this paper haven’t been checked yet.
Run the check — free, no account needed. It reads the open-access text and checks the sources it cites.
Claims other papers make about this one
Each is checked against this paper’s own text: does it say what the citing paper says it does?
The cited source says what the claim attributes to it.
In the citing paper
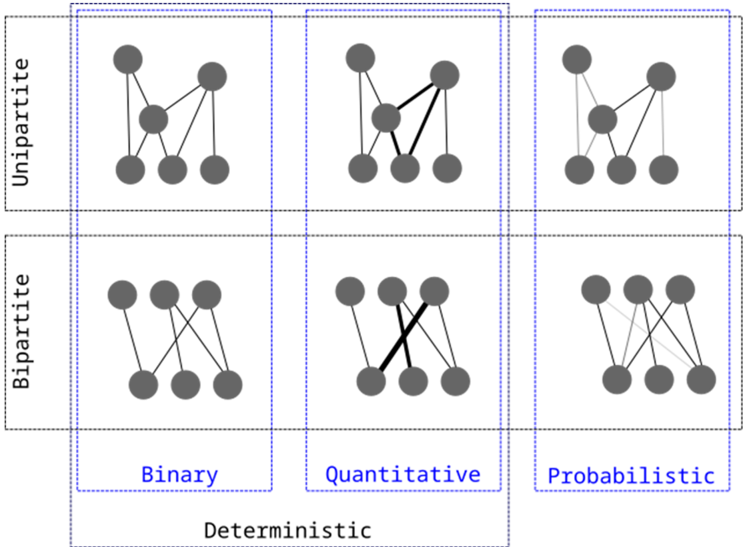
“For example, the package EcologicalNetworks.jl[202] defines two fundamental data types describing the partiteness of a graph, parameterized by the nature of the interactions in the graph.”
From Circuitscape in julia: empowering dynamic approaches to connectivity assessment (2021) · cites this paper as [202]
Self-check
Percentages, sums and reported differences re-computed from the paper’s own numbers.
The self-check needs the paper’s full text.
Citations
Cites
The igraph software package for complex network research
Csárdi, G., & Nepusz, T. (2006) · Medical Entomology and Zoology · Cited by 10,078
Exploring Network Structure, Dynamics, and Function Using NetworkX
Hagberg, A. A., Schult, D. A., & Swart, P. J. (2008) · Proceedings of the Python in Science Conference · doi:10.25080/tcwv9851 · Cited by 7,477
Julia: A Fresh Approach to Numerical Computing
Bezanson, J., Edelman, A., Karpinski, S., & Shah, V. B. (2017) · SIAM Review · doi:10.1137/141000671 · Cited by 5,440
Functional cartography of complex metabolic networks
Guimerà, R., & Nunes Amaral, L. A. (2005) · Nature · doi:10.1038/nature03288 · Cited by 3,983
The modularity of pollination networks
Olesen, J. M., Bascompte, J., Dupont, Y. L., & Jordano, P. (2007) · Proceedings of the National Academy of Sciences · doi:10.1073/pnas.0706375104 · Cited by 2,639
The nested assembly of plant–animal mutualistic networks
Bascompte, J., Jordano, P., Melián, C. J., & Olesen, J. M. (2003) · Proceedings of the National Academy of Sciences · doi:10.1073/pnas.1633576100 · Cited by 2,497
Measuring beta diversity for presence–absence data
Koleff, P., Gaston, K. J., & Lennon, J. J. (2003) · Journal of Animal Ecology · doi:10.1046/j.1365-2656.2003.00710.x · Cited by 1,736
Introducing the bipartite Package: Analysing Ecological Networks
Dormann, C. F., Gruber, B., & Fründ, J. (2008) · GoeScholar The Publication Server of the Georg-August-Universität Göttingen (Georg-August-Universität Göttingen) · Cited by 1,434
Tolerance of pollination networks to species extinctions
Memmott, J., Waser, N. M., & Price, M. V. (2004) · Proceedings of the Royal Society of London. Series B: Biological Sciences · doi:10.1098/rspb.2004.2909 · Cited by 1,238
The architecture of mutualistic networks minimizes competition and increases biodiversity
Bastolla, U., Fortuna, M. A., Pascual-García, A., Ferrera, A., Luque, B., & Bascompte, J. (2009) · Nature · doi:10.1038/nature07950 · Cited by 1,126
Research works printed but not linked: 1
- Simmons B. I., 2018, bmotif: a package for counting motifs in bipartite networks
Cited by
Circuitscape in julia: empowering dynamic approaches to connectivity assessment
Hall, K. R., Anantharaman, R., Landau, V. A., Clark, M., Dickson, B. G., Jones, A., Platt, J., Edelman, A., & Shah, V. B. (2021) · Land · doi:10.3390/land10030301 · Cited by 115
Metadata
- Authors
- Poisot, T., Bélisle, Z., Hoebeke, L., Stock, M., & Szefer, P.
- Affiliations
- Dépt de Sciences Biologiques, Univ. de Montréal Montréal Canada
- KERMIT, Dept of Data Analysis and Mathematical Modelling, Ghent Univ Belgium
- Faculty of Science, Univ. of South Bohemia České Budějovice Czech Republic
- ORCID
- Poisot, Timothée
- Venue
- Ecography
- Publisher
- Wiley
- Published
- 2019-10-17
- Volume
- 42
- Issue
- 11
- Pages
- 1850-1861
- ISSN
- 0906-7590
- 1600-0587
- Cited by
- 16
- References
- 31
- Language
- en
About these checks
Registry, retraction, Cites and statistics results are computed, not judged, with one exception: a printed reference that no index lists is read once by a model before it counts as a citation error. Claims are extracted by a model and kept only when their quote appears verbatim in the text; each cited source is then checked, with a model’s help, for whether it says what the claim relies on. Those verdicts can be wrong — read the claim’s quote and the cited source before relying on one.
Statistics and arithmetic are recomputed, not judged.
Confidence bands are shown only for fields calibrated on our annotated test set. None is calibrated yet, so no band is shown.
What counts as a claim ›How we measure confidence ›How we check this ›
Are you an author, or do you see a problem with this page? Request a review
Data sources
Bibliographic data: Semantic Scholar, OpenAlex, Crossref.
Contains information from the Semantic Scholar Academic Graph Datasets, made available under the ODC Attribution License (ODC-BY 1.0).
Semantic Scholar’s data is described in: Kinney, R., et al. (2023). The Semantic Scholar Open Data Platform. arXiv:2301.10140.
