Cited by 63Pancreatitis Pathology and TreatmentTGF-β signaling in diseasesPancreatic and Hepatic Oncology Research

The DOI matches its Crossref record; 40 of the 40 references it cites were found in a registry or an index.

Lipopolysaccharide enhances TGF‐β1 signalling pathway and rat pancreatic fibrosis

Open access
Sun, Li, Xiu, Ming, Wang, Shuhua, Brigstock, David R., Li, Hongyan, Qu, Limei, Gao, Runping·2018·Journal of Cellular and Molecular Medicine

Abstract

Pancreatic stellate cells (PSC s) play a critical role in fibrogenesis during alcoholic chronic pancreatitis (ACP). Transforming growth factor‐beta1 (TGF‐β1) is a key regulator of extracellular matrix production and PSC activation. Endotoxin lipopolysaccharide (LPS) has been recognized as a trigger factor in the pathogenesis of ACP. This study aimed to investigate the mechanisms by which LPS modulates TGF‐β1 signalling and pancreatic fibrosis. Sprague‐Dawley rats fed with a Lieber‐DeCarli alcohol (ALC) liquid diet for 10 weeks with or without LPS challenge during the last 3 weeks. In vitro studies were performed using rat macrophages (Mφs) and PSC s (RP‐2 cell line). The results showed that repeated LPS challenge resulted in significantly more collagen production and PSC activation compared to rats fed with ALC alone. LPS administration caused overexpression of pancreatic TLR 4 or TGF‐β1 which was paralleled by an increased number of TLR 4‐positive or TGF‐β1‐positive Mφs or PSC s in ALC‐fed rats. In vitro, TLR 4 or TGF‐β1 production in Mφs or RP‐2 cells was up‐regulated by LPS. LPS alone or in combination with TGF‐β1 significantly increased type I collagen and α‐SMA production and Smad2 and 3 phosphorylation in serum‐starved RP‐2 cells. TGF‐β pseudoreceptor BAMBI production was repressed by LPS, which was antagonized by Si‐TLR 4 RNA or by inhibitors of MyD88/NF‐kB. Additionally, knockdown of Bambi with Si‐Bambi RNA significantly increased TGF‐β1 signalling in RP‐2 cells. These findings indicate that LPS increases TGF‐β1 production through paracrine and autocrine mechanisms and that LPS enhances TGF‐β1 signalling in PSC s by repressing BAMBI via TLR 4/MyD88/NF‐kB activation.

Overview

The claims and statistics of this paper haven’t been checked yet.

Run the check — free, no account needed. It reads the open-access text and checks the sources it cites.

A few free checks a day · papers already verified open instantly · results are public

Integrity signals

Registry

Crossref · 10.1111/jcmm.13526

Cites

40 of 40 references verified0 citation errors · 0 not checkable

Statistics

Figures

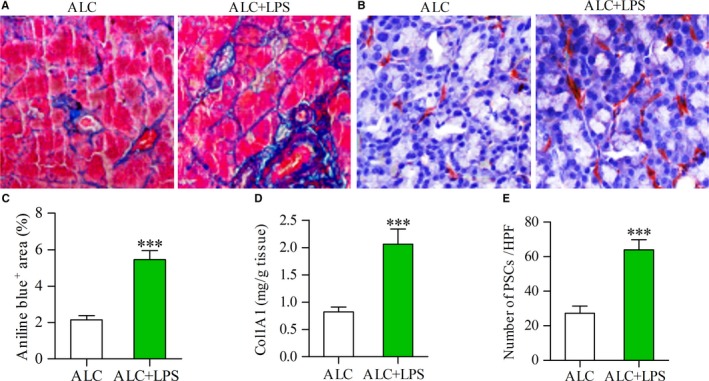
Figure 1 LPS was associated with increased expression of collagen and activation of PSCs. Aniline blue staining showing collagen deposition in the pancreas (blue) of alcohol (ALC, 15 g/kg/d)‐fed rat and ALC rat plus LPS (3 mg/kg once a week for 3 weeks) repeated injections (ALC + LPS) (A); Immunostaining showing the activated PSCs in the pancreas of ALC rat and ALC + LPS rat (B); The area of collagen deposition (C) or the content of Col1A1 (D) or the number of activated PSCs (E) in the pancreas of ALC + LPS rats was significantly more than that of ALC rats. Student's t test, ***P < .001 vs ALC rats (n = 11/group)
Figure 1 LPS was associated with increased expression of collagen and activation of PSCs. Aniline blue staining showing collagen deposition in the pancreas (blue) of alcohol (ALC, 15 g/kg/d)‐fed rat and ALC rat plus LPS (3 mg/kg once a week for 3 weeks) repeated injections (ALC + LPS) (A); Immunostaining showing the activated PSCs in the pancreas of ALC rat and ALC + LPS rat (B); The area of collagen deposition (C) or the content of Col1A1 (D) or the number of activated PSCs (E) in the pancreas of ALC + LPS rats was significantly more than that of ALC rats. Student's t test, ***P < .001 vs ALC rats (n = 11/group)CC BY · PubMed Central
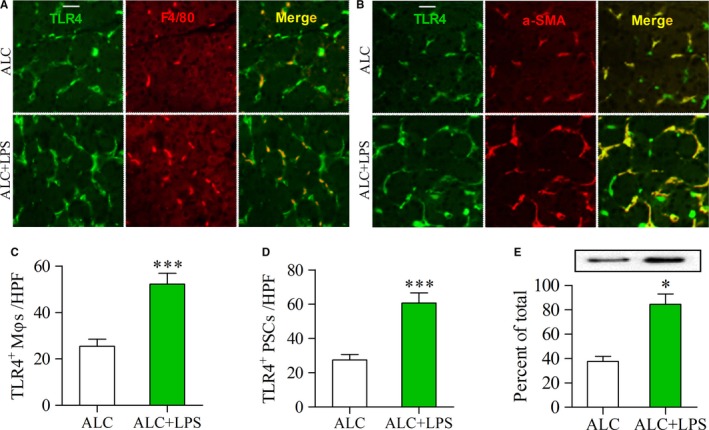
Figure 2 Enhanced expression of TLR4 in the pancreas of ALC‐fed rats with LPS injections. (A, B) Double‐immunofluorescence labelling using antibodies for TLR4 and F4/80 or α‐SMA. Yellow, colocalization of two antibodies. Scale bar = 50 μm; (A) Yellow staining indicates TLR4‐positive Mφs; (B) Yellow staining indicates TLR4‐positive PSCs. The number of TLR4‐positive Mφs/PSCs was higher in the pancreas of ALC + LPS rats than that of ALC rats (C, D); (E) The expression of TLR4 protein was examined by Western blot analysis (top panels) and the results, normalized with GAPDH, are the mean ± SEM of triplicate determinations (bottom panels). Student's t test, *P < .05, ***P < .001 vs ALC rats (n = 11/group)
Figure 2 Enhanced expression of TLR4 in the pancreas of ALC‐fed rats with LPS injections. (A, B) Double‐immunofluorescence labelling using antibodies for TLR4 and F4/80 or α‐SMA. Yellow, colocalization of two antibodies. Scale bar = 50 μm; (A) Yellow staining indicates TLR4‐positive Mφs; (B) Yellow staining indicates TLR4‐positive PSCs. The number of TLR4‐positive Mφs/PSCs was higher in the pancreas of ALC + LPS rats than that of ALC rats (C, D); (E) The expression of TLR4 protein was examined by Western blot analysis (top panels) and the results, normalized with GAPDH, are the mean ± SEM of triplicate determinations (bottom panels). Student's t test, *P < .05, ***P < .001 vs ALC rats (n = 11/group)CC BY · PubMed Central
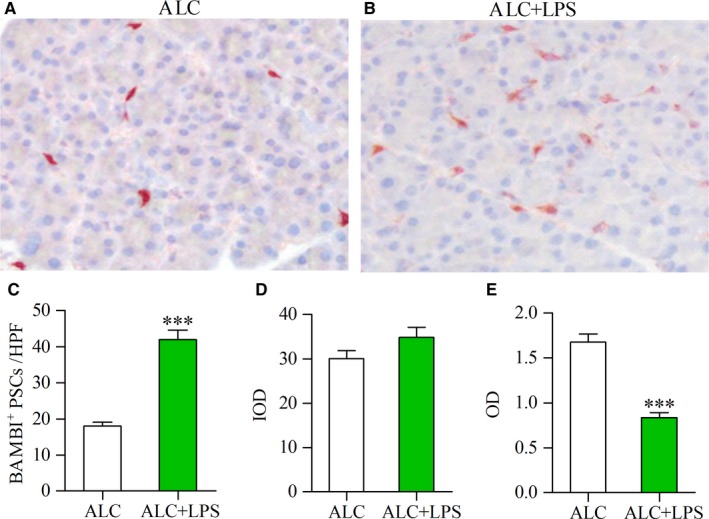
Figure 3 Decreased expression of BAMBI in the PSCs of ALC‐fed rats with LPS injections. Immunohistochemical staining showing strong positive staining for BAMB in several PSCs of ALC rat (A), but weak staining in more PSCs of ALC + LPS rat (red) (B). The number of BAMBI‐positive PSCs in the pancreas of ALC and ALC + LPS rats (C); Computer image analysis showed that the integrated optical density (IOD) of BAMBI‐positive PSCs in the pancreas of ALC and ALC + LPS rats (D); The mean optical density (OD) per BAMBI‐positive PSC was used for comparing the expression intensity of BAMBI in PSCs of ALC and ALC + LPS rats (E). Student's t test, ***P < .001 vs ALC rats (n = 11/group)
Figure 3 Decreased expression of BAMBI in the PSCs of ALC‐fed rats with LPS injections. Immunohistochemical staining showing strong positive staining for BAMB in several PSCs of ALC rat (A), but weak staining in more PSCs of ALC + LPS rat (red) (B). The number of BAMBI‐positive PSCs in the pancreas of ALC and ALC + LPS rats (C); Computer image analysis showed that the integrated optical density (IOD) of BAMBI‐positive PSCs in the pancreas of ALC and ALC + LPS rats (D); The mean optical density (OD) per BAMBI‐positive PSC was used for comparing the expression intensity of BAMBI in PSCs of ALC and ALC + LPS rats (E). Student's t test, ***P < .001 vs ALC rats (n = 11/group)CC BY · PubMed Central
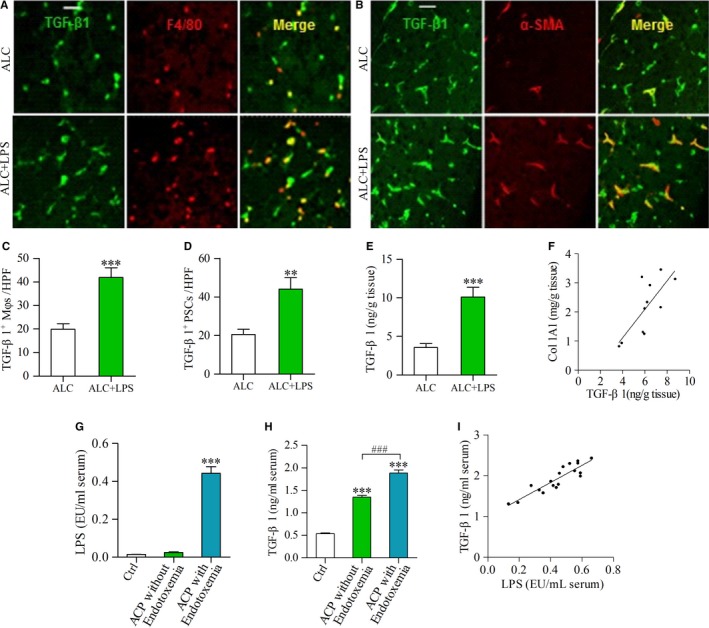
Figure 4 TGF‐β1 production was enhanced by LPS in the pancreas of ALC‐fed rats and in the sera of ACP patients. (A, B) Double‐immunofluorescence labelling using antibodies for TGF‐β1 and F4/80 or α‐SMA. Yellow, colocalization of two antibodies. Scale bar = 50 μm; (A) Yellow staining indicates TGF‐β1‐positive Mφs; (B) Yellow staining indicates TGF‐β1‐positive PSCs. The number of TGF‐β1‐positive Mφs/PSCs was higher in the pancreas of ALC + LPS rats than that of ALC rats (C, D); (E) The expression of TGF‐β1 protein was determined by ELISA. Student t test, **P < .01, ***P < .001 vs ALC rats. (F) There was a positive correlation between TGF‐β1 and Col1A1 in the pancreas of LPS‐treated ALC rats. Pearson's correlation test, r = .541, P < .01 (n = 11/group). (G) The LPS levels in the sera of ACP patients and healthy control (Ctrl); (H) The TGF‐β1 levels in the sera of ACP patients with/without endotoxemia and Ctrl group. One‐way ANOVA followed by Bonferroni post hoc test, ***P < .001 vs Ctrl, ### P < .001 vs ACP without endotoxemia. (I) There was a positive correlation between TGF‐β1 and LPS in the sera of ACP patients with endotoxemia. Pearson's correlation test, r = .609, P < .01. (Ctrl: n = 25; ACP without endotoxemia: n = 11; ACP with endotoxemia: n = 18)
Figure 4 TGF‐β1 production was enhanced by LPS in the pancreas of ALC‐fed rats and in the sera of ACP patients. (A, B) Double‐immunofluorescence labelling using antibodies for TGF‐β1 and F4/80 or α‐SMA. Yellow, colocalization of two antibodies. Scale bar = 50 μm; (A) Yellow staining indicates TGF‐β1‐positive Mφs; (B) Yellow staining indicates TGF‐β1‐positive PSCs. The number of TGF‐β1‐positive Mφs/PSCs was higher in the pancreas of ALC + LPS rats than that of ALC rats (C, D); (E) The expression of TGF‐β1 protein was determined by ELISA. Student t test, **P < .01, ***P < .001 vs ALC rats. (F) There was a positive correlation between TGF‐β1 and Col1A1 in the pancreas of LPS‐treated ALC rats. Pearson's correlation test, r = .541, P < .01 (n = 11/group). (G) The LPS levels in the sera of ACP patients and healthy control (Ctrl); (H) The TGF‐β1 levels in the sera of ACP patients with/without endotoxemia and Ctrl group. One‐way ANOVA followed by Bonferroni post hoc test, ***P < .001 vs Ctrl, ### P < .001 vs ACP without endotoxemia. (I) There was a positive correlation between TGF‐β1 and LPS in the sera of ACP patients with endotoxemia. Pearson's correlation test, r = .609, P < .01. (Ctrl: n = 25; ACP without endotoxemia: n = 11; ACP with endotoxemia: n = 18)CC BY · PubMed Central
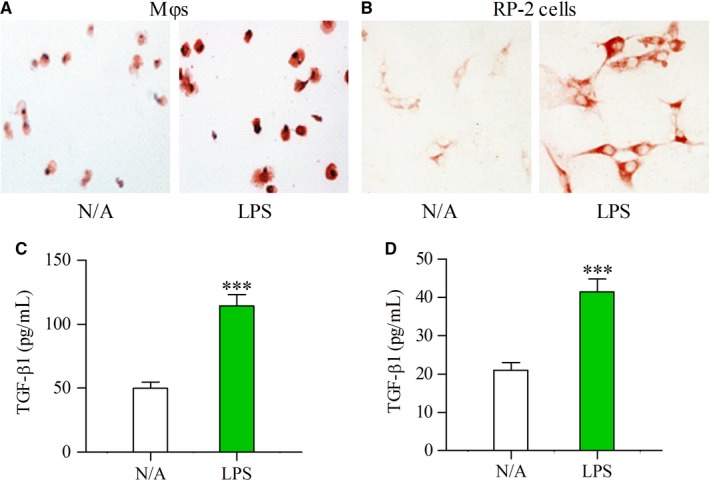
Figure 5 Expression of TLR4 and TGF‐β1 was enhanced by LPS in cultured Mφs and PSCs. Immunocytological staining showing the enhanced expression of TLR4 by LPS (100 ng/mL) in cultured Mφs (A) and RP‐2 cells (B) The concentrations of TGF‐β1 were determined by ELISA in the supernatant of cultured Mφs (C) or RP‐2 cells (D) that had been incubated for 24 h in the absence (N/A) or presence of LPS (100 ng/mL). Student's t test, ***P < .001 vs N/A (n = 6/group)
Figure 5 Expression of TLR4 and TGF‐β1 was enhanced by LPS in cultured Mφs and PSCs. Immunocytological staining showing the enhanced expression of TLR4 by LPS (100 ng/mL) in cultured Mφs (A) and RP‐2 cells (B) The concentrations of TGF‐β1 were determined by ELISA in the supernatant of cultured Mφs (C) or RP‐2 cells (D) that had been incubated for 24 h in the absence (N/A) or presence of LPS (100 ng/mL). Student's t test, ***P < .001 vs N/A (n = 6/group)CC BY · PubMed Central
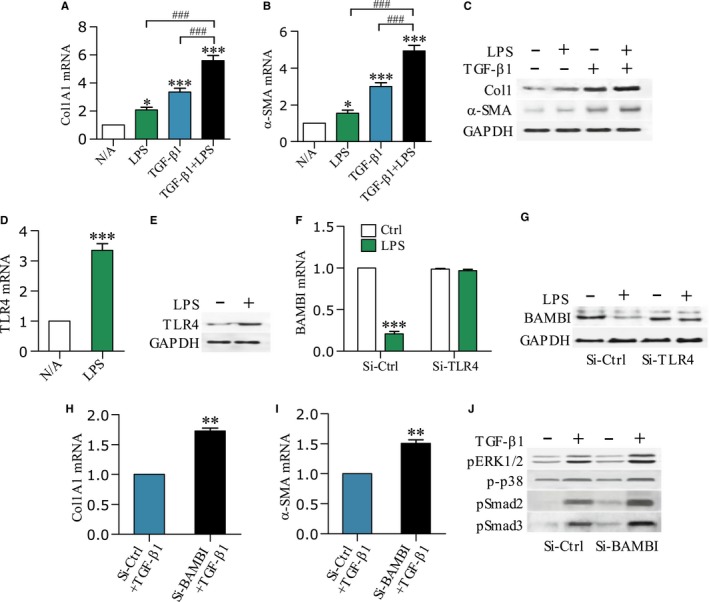
Figure 6 LPS sensitizes PSCs to TGF‐β1 and down‐regulates BAMBI. Col1A1 and α‐SMA mRNA levels (A, B) or Col1 and α‐SMA protein contents (C) in the RP‐2 cells after 12 h and 24 h of stimulation with LPS (100 ng/mL) or TGF‐β1 (10 ng/mL) or in combination were determined by qPCR or Western blot, respectively. One‐way ANOVA followed by Bonferroni post hoc test, *P < .05, ***P < .001 vs N/A; ### P < .001 vs LPS or TGF‐β1 group. TLR4 mRNA levels (D) or protein contents (E) were determined in the RP‐2 cells that had been incubated for 12 h or 24 h in the absence or presence of LPS (100 ng/mL); BAMBI mRNA levels F or protein contents (G) were determined in the RP‐2 cells after 12 h or 24 h of stimulation with LPS (100 ng/mL); Before treatment, RP‐2 cells were pre‐transfected with either small interfere control RNA (Si‐Ctrl) or small interfere TLR4 RNA (Si‐TLR4) for 24 h; Col1A1 and α‐SMA mRNA levels (H, I) or ERK1/2 and p38 and Smad2/3 phosphorylations (J) were determined in the RP‐2 cells after 12 h or 24 h of stimulation with TGF‐β1 (10 ng/mL); Before treatment, RP‐2 cells were pre‐transfected with either Si‐Ctrl or small interfere BAMBI RNA (Si‐BAMBI) for 24 h. Student's t test, **P < .01, ***P < .001 vs Si‐Ctrl group (n = 6/group)
Figure 6 LPS sensitizes PSCs to TGF‐β1 and down‐regulates BAMBI. Col1A1 and α‐SMA mRNA levels (A, B) or Col1 and α‐SMA protein contents (C) in the RP‐2 cells after 12 h and 24 h of stimulation with LPS (100 ng/mL) or TGF‐β1 (10 ng/mL) or in combination were determined by qPCR or Western blot, respectively. One‐way ANOVA followed by Bonferroni post hoc test, *P < .05, ***P < .001 vs N/A; ### P < .001 vs LPS or TGF‐β1 group. TLR4 mRNA levels (D) or protein contents (E) were determined in the RP‐2 cells that had been incubated for 12 h or 24 h in the absence or presence of LPS (100 ng/mL); BAMBI mRNA levels F or protein contents (G) were determined in the RP‐2 cells after 12 h or 24 h of stimulation with LPS (100 ng/mL); Before treatment, RP‐2 cells were pre‐transfected with either small interfere control RNA (Si‐Ctrl) or small interfere TLR4 RNA (Si‐TLR4) for 24 h; Col1A1 and α‐SMA mRNA levels (H, I) or ERK1/2 and p38 and Smad2/3 phosphorylations (J) were determined in the RP‐2 cells after 12 h or 24 h of stimulation with TGF‐β1 (10 ng/mL); Before treatment, RP‐2 cells were pre‐transfected with either Si‐Ctrl or small interfere BAMBI RNA (Si‐BAMBI) for 24 h. Student's t test, **P < .01, ***P < .001 vs Si‐Ctrl group (n = 6/group)CC BY · PubMed Central
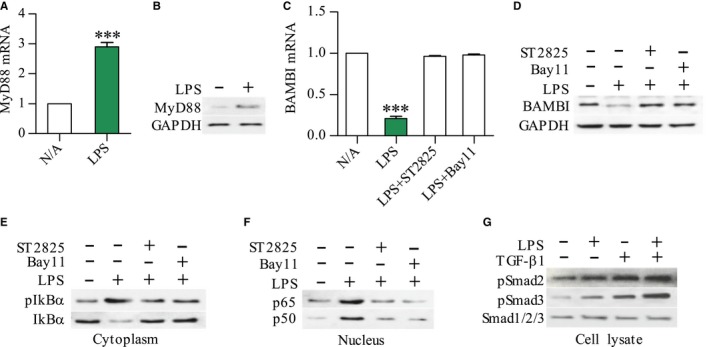
Figure 7 Down‐regulation of BAMBI by LPS through a MyD88/NF‐kB‐dependent pathway. MyD88 and BAMBI mRNA levels (A, C) or proteins (B, D) in the RP‐2 cells after 12 h and 24 h of stimulation with LPS (100 ng/mL) were determined by qPCR and Western blot, respectively; Western blot showing the expression of pIkBα or IkBα in cytoplasm and NF‐kB p65 or p50 in nucleus of RP‐2 cells after 45 min of LPS stimulation (E, F) For inhibition experiments, RP‐2 cells were pre‐treated for 30 min with NF‐kB inhibitor Bay11(10 μmol/L) or MyD88 inhibitor ST2825 (10 μmol/L); The expression of pSmad2 or pSmad3 or Smad123 in whole cell lysate of RP‐2 cells that had been stimulated with LPS (100 ng/mL) or TGF‐β1 (10 ng/mL) or in combination for 12 h (G). Student's t test, ***P < .001 vs N/A (n = 6/group)
Figure 7 Down‐regulation of BAMBI by LPS through a MyD88/NF‐kB‐dependent pathway. MyD88 and BAMBI mRNA levels (A, C) or proteins (B, D) in the RP‐2 cells after 12 h and 24 h of stimulation with LPS (100 ng/mL) were determined by qPCR and Western blot, respectively; Western blot showing the expression of pIkBα or IkBα in cytoplasm and NF‐kB p65 or p50 in nucleus of RP‐2 cells after 45 min of LPS stimulation (E, F) For inhibition experiments, RP‐2 cells were pre‐treated for 30 min with NF‐kB inhibitor Bay11(10 μmol/L) or MyD88 inhibitor ST2825 (10 μmol/L); The expression of pSmad2 or pSmad3 or Smad123 in whole cell lysate of RP‐2 cells that had been stimulated with LPS (100 ng/mL) or TGF‐β1 (10 ng/mL) or in combination for 12 h (G). Student's t test, ***P < .001 vs N/A (n = 6/group)CC BY · PubMed Central

Verification

Claims the paper makes

The claims and statistics of this paper haven’t been checked yet.

Run the check — free, no account needed. It reads the open-access text and checks the sources it cites.

A few free checks a day · papers already verified open instantly · results are public

Claims other papers make about this one

Each is checked against this paper’s own text: does it say what the citing paper says it does?

Self-check

Percentages, sums and reported differences re-computed from the paper’s own numbers.

The self-check needs the paper’s full text.

Citations

Cites

Show all 40 references

Research works printed but not linked: 1

  1. Wang XP, 2012, Guidelines for diagnosis and management of chronic pancreatitis, Chin J Pancreatol, 51, 922

Cited by

Sorted by citations

See all 63

Metadata

Authors
Sun, L., Xiu, M., Wang, S., Brigstock, D. R., Li, H., Qu, L., & Gao, R.
Affiliations
  • First Hospital of Jilin University (CN)
  • Nationwide Children's Hospital (US)
Corresponding author
Gao, Runping
Venue
Journal of Cellular and Molecular Medicine
Publisher
Wiley
Published
2018-02-09
Volume
22
Issue
4
Pages
2346-2356
ISSN
  • 1582-1838 (ISSN-L)
  • 1582-4934
OpenAlex
W2789957233
Cited by
63
References
40
Citations by year
2026: 5 · 2025: 6 · 2024: 4 · 2023: 11 · 2022: 9 · 2021: 15 · 2020: 8 · 2019: 2 · 2018: 3
FWCI
7.28
Type
journal article
Language
en
Open access
Locations
  • Journal of Cellular and Molecular Medicine (publishedVersion, cc-by)
  • PubMed Central (publishedVersion, cc-by)
  • PubMed (publishedVersion)
Funders
National Natural Scientific Foundation of China (81770629, 81270544)
Topics
  • Health Sciences › Medicine › Surgery › Pancreatitis Pathology and Treatment
  • Life Sciences › Biochemistry, Genetics and Molecular Biology › Molecular Biology › TGF-β signaling in diseases
  • Health Sciences › Medicine › Oncology › Pancreatic and Hepatic Oncology Research
Keywords
lipopolysaccharide, TGF-β1 signaling, pancreatic fibrosis, alcoholic chronic pancreatitis, pancreatic stellate cells, TLR4, Bambi, Smad2/3 phosphorylation, macrophages, collagen synthesis, endotoxin
MeSH terms
Alcohols, Animals, Collagen, Fibrosis, Gene Expression Regulation, Humans, Lipopolysaccharides, Macrophages, Membrane Proteins, Pancreas, Signal Transduction, Pancreatitis, Alcoholic, Toll-Like Receptor 4, Rats, Smad2 Protein, Myeloid Differentiation Factor 88, Transforming Growth Factor beta1, Pancreatic Stellate Cells

About these checks

Registry, retraction, Cites and statistics results are computed, not judged, with one exception: a printed reference that no index lists is read once by a model before it counts as a citation error. Claims are extracted by a model and kept only when their quote appears verbatim in the text; each cited source is then checked, with a model’s help, for whether it says what the claim relies on. Those verdicts can be wrong — read the claim’s quote and the cited source before relying on one.

Statistics and arithmetic are recomputed, not judged.

Confidence bands are shown only for fields calibrated on our annotated test set. None is calibrated yet, so no band is shown.

What counts as a claim ›How we measure confidence ›How we check this ›

Are you an author, or do you see a problem with this page? Request a review