Cited by 4Cardiomyopathy and Myosin StudiesSingle-cell and spatial transcriptomicsCardiac electrophysiology and arrhythmias

The DOI matches its Crossref record; 2 of the 2 references it cites were found in a registry or an index.

Characterising Shared and Specific Cell–Cell Communication in Cardiomyopathy Subtypes From Single‐Cell Transcriptomics Data

Open access
Tao, Wenqi, Gong, Miao, Ke, Zunping·2025·Journal of Cellular and Molecular Medicine

Abstract

Cardiomyopathy encompasses a diverse range of conditions characterised by extensive molecular heterogeneity, particularly the variations in cell–cell communication events such as ligand‐receptor interactions and downstream signalling. Understanding the common and unique features of these intercellular interactions is crucial for advancing targeted treatments. We analysed single‐cell RNA sequencing datasets from the ventricular regions of patients with arrhythmogenic cardiomyopathy (ACM), dilated cardiomyopathy (DCM), hypertrophic cardiomyopathy (HCM) and healthy donors (HD), as well as ischemic cardiomyopathy (ICM). Our analyses focused on cell type‐specific disease preferences, differential gene expression, pathway enrichment and particularly cell–cell communication. We observed that inflammatory, autoimmune, angiogenesis, lymphangiogenesis and fibrotic extracellular matrix deposition are consistently enriched across all four disease subtypes, highlighting their universal significance in disease progression through intercellular interactions. Additionally, we identified subtype‐specific pathways that reflect distinct intercellular communication patterns unique to each disease subtype: arrhythmia‐associated pathways in ACM, chronic inflammation‐related pathways in DCM, ECM remodelling pathways in HCM and ischaemic injury and recovery pathways in ICM.

Overview

The claims and statistics of this paper haven’t been checked yet.

Run the check — free, no account needed. It reads the open-access text and checks the sources it cites.

A few free checks a day · papers already verified open instantly · results are public

Integrity signals

Registry

Crossref · 10.1111/jcmm.70554

Cites

2 of 2 references verified0 citation errors · 0 not checkable

Statistics

Figures

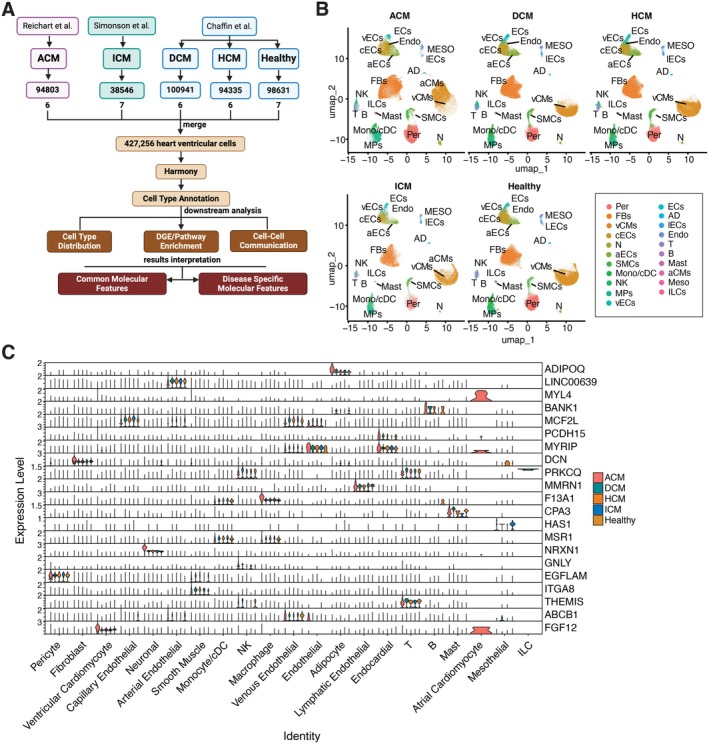
FIGURE 1 Identification of Major Cell Compartments in Human Cardiomyopathy and Healthy Donors through Single‐cell Data Integration. (A) Overview of Dataset Integration, Downstream Analysis and Interpretation of Results Using Single‐Cell RNA Sequencing Datasets from Three Independent Studies. (B) UMAP embeddings of ‘celltype.l2’ cell types, split by disease subtype and healthy donor group. Cell types are labelled by abbreviation as follows: Adipocyte (AD), Arterial Endothelial cells (aECs), Atrial Cardiomyocyte cells (aCMs), B cells (B), Capillary Endothelial cells (cECs), Endocardial (Endo), Endothelial cells (ECs), Fibroblasts (FBs), Innate Lymphoid cells (ILCs), Lymphatic Endothelial cells (lECs), Macrophages (MPs), Mast (Mast), Mesothelial cells (MESO), Monocyte/cDC (Mono/cDC), Neuronal cells (N), NK/T cells (NK), Pericytes (Per), Smooth Muscle cells (SMCs), T cells (T), Venous Endothelial cells (vECs) and Ventricular Cardiomyocyte cells (vCMs). (C) Stack violin plots showing the ‘celltype.l2’ annotated cell types specific expression of the top‐ranking candidate marker genes for each identified cell type across disease subtype and healthy donor group.
FIGURE 1 Identification of Major Cell Compartments in Human Cardiomyopathy and Healthy Donors through Single‐cell Data Integration. (A) Overview of Dataset Integration, Downstream Analysis and Interpretation of Results Using Single‐Cell RNA Sequencing Datasets from Three Independent Studies. (B) UMAP embeddings of ‘celltype.l2’ cell types, split by disease subtype and healthy donor group. Cell types are labelled by abbreviation as follows: Adipocyte (AD), Arterial Endothelial cells (aECs), Atrial Cardiomyocyte cells (aCMs), B cells (B), Capillary Endothelial cells (cECs), Endocardial (Endo), Endothelial cells (ECs), Fibroblasts (FBs), Innate Lymphoid cells (ILCs), Lymphatic Endothelial cells (lECs), Macrophages (MPs), Mast (Mast), Mesothelial cells (MESO), Monocyte/cDC (Mono/cDC), Neuronal cells (N), NK/T cells (NK), Pericytes (Per), Smooth Muscle cells (SMCs), T cells (T), Venous Endothelial cells (vECs) and Ventricular Cardiomyocyte cells (vCMs). (C) Stack violin plots showing the ‘celltype.l2’ annotated cell types specific expression of the top‐ranking candidate marker genes for each identified cell type across disease subtype and healthy donor group.CC BY · PubMed Central
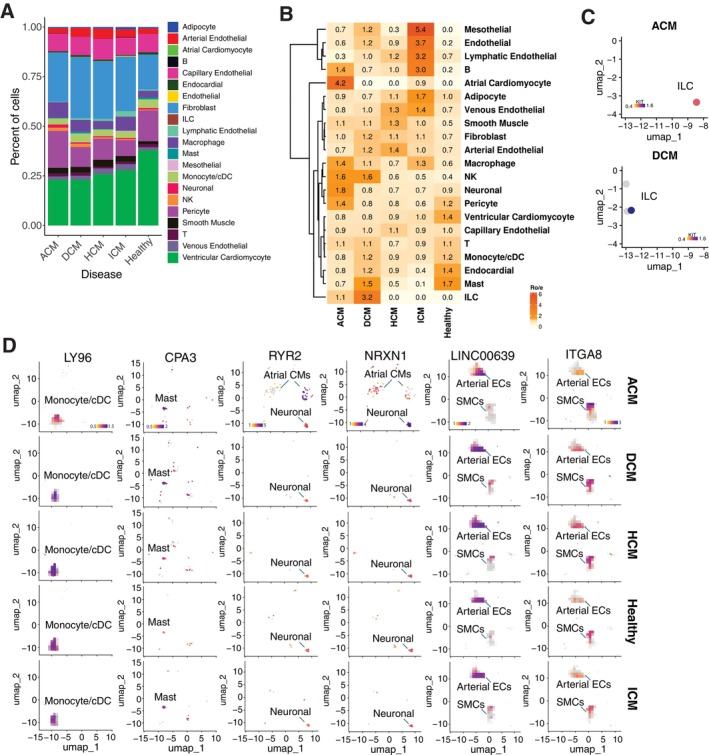
FIGURE 2 Characterise Cell Composition in Each Patient Subgroup and Evaluate Cell Type‐Specific Disease Preferences. (A) Stack bar plots showing the distribution of Level_2 annotated cell types across disease subtypes and the healthy group. (B) Heatmap showing disease preference for each annotated cell type, evaluated by the ratio of observed to expected cell counts (Ro/e) value. (C) UMAP plot showing the expression patterns of the ILC marker gene KIT in annotated ILC cells across detected patient groups. (D) UMAP plot showing the expression patterns of the genes, including LY96(MD‐2), CPA3, NRXN1, RYR2, LINC00639 and ITGA8 in annotated Monocyte/cDC, Mast, Atrial Cardiomyocyte, Neuronal, Arterial Endothelial and Smooth Muscle, respectively. Split by disease subtype and healthy donor group. Dot colours represent expression level.
FIGURE 2 Characterise Cell Composition in Each Patient Subgroup and Evaluate Cell Type‐Specific Disease Preferences. (A) Stack bar plots showing the distribution of Level_2 annotated cell types across disease subtypes and the healthy group. (B) Heatmap showing disease preference for each annotated cell type, evaluated by the ratio of observed to expected cell counts (Ro/e) value. (C) UMAP plot showing the expression patterns of the ILC marker gene KIT in annotated ILC cells across detected patient groups. (D) UMAP plot showing the expression patterns of the genes, including LY96(MD‐2), CPA3, NRXN1, RYR2, LINC00639 and ITGA8 in annotated Monocyte/cDC, Mast, Atrial Cardiomyocyte, Neuronal, Arterial Endothelial and Smooth Muscle, respectively. Split by disease subtype and healthy donor group. Dot colours represent expression level.CC BY · PubMed Central
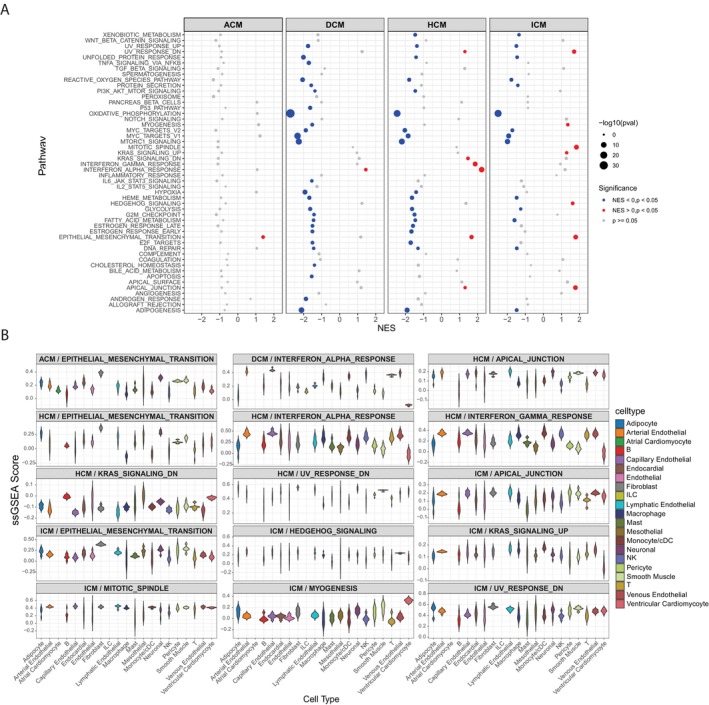
FIGURE 3 Gene Set Enrichment Analysis Reveals Hallmark Gene Sets Across Cardiomyopathy Subtypes and Annotated Cell Types. (A) Dot plot showing Hallmark gene‐set enrichment analysis comparing disease versus healthy controls across four cardiomyopathy subtypes (ACM, DCM, HCM, ICM). The plot is faceted by disease subtype, with the x‐axis representing the normalised enrichment score (NES) and the y‐axis indicating pathway names. Dot size corresponds to the −log10 (p‐value), and dot colour indicates statistical significance. (B) Violin plot showing single‐sample gene set enrichment analysis (ssGSEA) scores for pathways identified in Panel A across annotated cell types. The plot is faceted by enriched pathways from each disease subtype, with the x‐axis and violin colour representing the annotated cell types and the y‐axis indicating the ssGSEA score.
FIGURE 3 Gene Set Enrichment Analysis Reveals Hallmark Gene Sets Across Cardiomyopathy Subtypes and Annotated Cell Types. (A) Dot plot showing Hallmark gene‐set enrichment analysis comparing disease versus healthy controls across four cardiomyopathy subtypes (ACM, DCM, HCM, ICM). The plot is faceted by disease subtype, with the x‐axis representing the normalised enrichment score (NES) and the y‐axis indicating pathway names. Dot size corresponds to the −log10 (p‐value), and dot colour indicates statistical significance. (B) Violin plot showing single‐sample gene set enrichment analysis (ssGSEA) scores for pathways identified in Panel A across annotated cell types. The plot is faceted by enriched pathways from each disease subtype, with the x‐axis and violin colour representing the annotated cell types and the y‐axis indicating the ssGSEA score.CC BY · PubMed Central
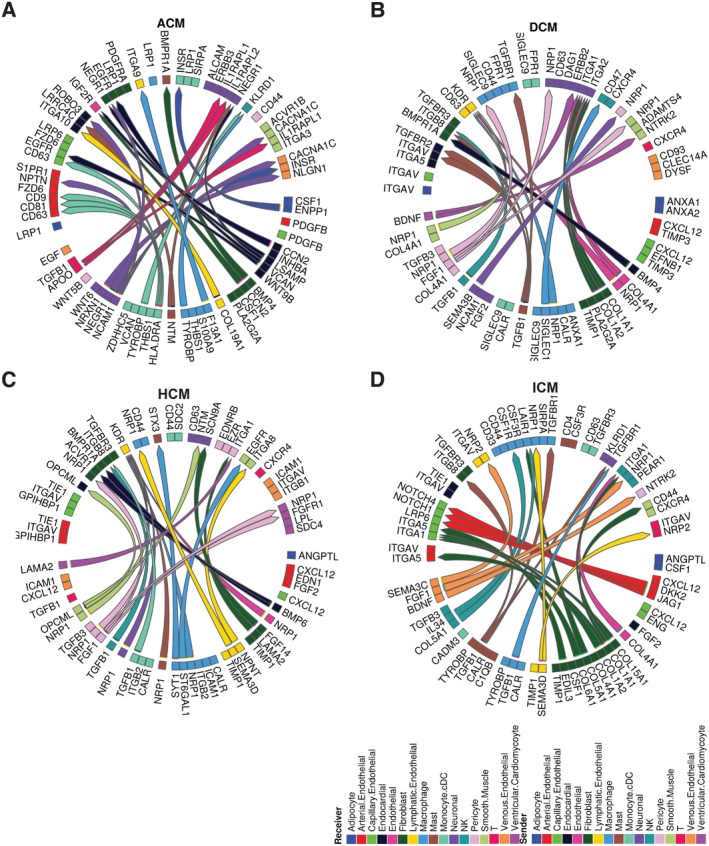
FIGURE 4 Summary of cell–cell communication in patients. Interactome analysis was performed on the annotated scRNAseq analysis of disease vs. healthy control using the MultiNicheNet package. Circos plots showing the top 30 ligand‐receptor interactions differentially activated in disease subtypes compared to healthy controls: ACM (A), DCM (B), HCM (C) and ICM (D). All clusters listed in the sender and receiver columns within the respective disease group of the prioritised table were included.
FIGURE 4 Summary of cell–cell communication in patients. Interactome analysis was performed on the annotated scRNAseq analysis of disease vs. healthy control using the MultiNicheNet package. Circos plots showing the top 30 ligand‐receptor interactions differentially activated in disease subtypes compared to healthy controls: ACM (A), DCM (B), HCM (C) and ICM (D). All clusters listed in the sender and receiver columns within the respective disease group of the prioritised table were included.CC BY · PubMed Central
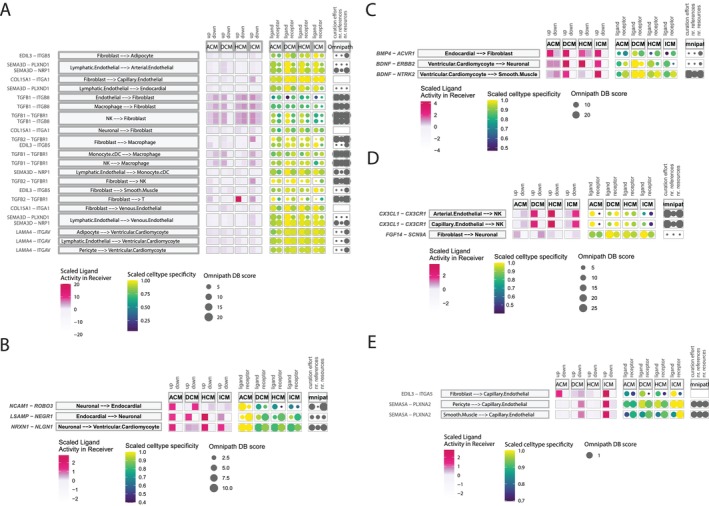
FIGURE 5 Summary of Shared and Disease‐Specific Cell–Cell Communications Across Disease Subtypes. Bubble plots display ligand‐receptor pairs and their differential impact across disease subtypes: (A) shared across three or more disease subtypes, (B) preferentially affected in ACM, (C) preferentially affected in DCM, (D) preferentially affected in HCM and (E) preferentially affected in ICM. Each plot includes scaled ligand activity in receiver cells, scaled cell type activity and curation levels of intercellular communication based on the Omnipath dataset.
FIGURE 5 Summary of Shared and Disease‐Specific Cell–Cell Communications Across Disease Subtypes. Bubble plots display ligand‐receptor pairs and their differential impact across disease subtypes: (A) shared across three or more disease subtypes, (B) preferentially affected in ACM, (C) preferentially affected in DCM, (D) preferentially affected in HCM and (E) preferentially affected in ICM. Each plot includes scaled ligand activity in receiver cells, scaled cell type activity and curation levels of intercellular communication based on the Omnipath dataset.CC BY · PubMed Central
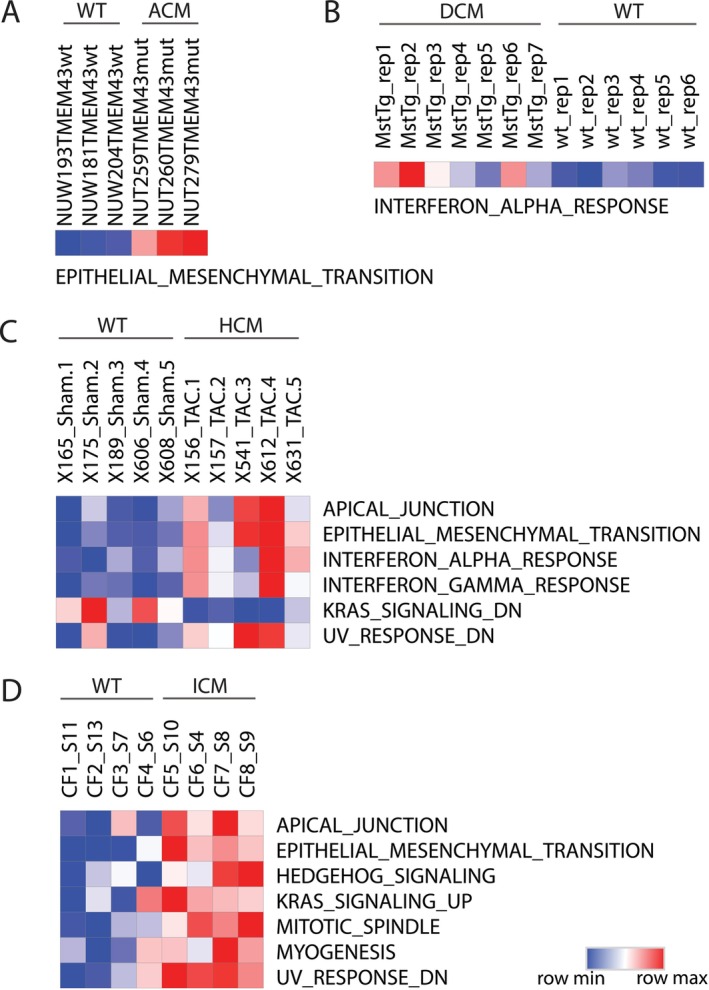
FIGURE 6 Validation of Disease‐Enriched Pathways in Cardiomyopathy Mouse Models Using ssGSEA. Heatmaps showing single‐sample gene set enrichment analysis (ssGSEA) scores for hallmark gene sets in mouse models of cardiomyopathy. Each panel represents one disease subtype: (A) ACM, (B) DCM, (C) HCM and (D) ICM. Rows correspond to annotated hallmark gene sets (left), and columns represent individual samples (top), grouped by disease versus wild type (WT). The colour scale ranges from blue (low ssGSEA score) to red (high ssGSEA score), reflecting pathway activity. This analysis validates the pathways identified through GSEA in human cardiomyopathy by assessing their enrichment in corresponding mouse models.
FIGURE 6 Validation of Disease‐Enriched Pathways in Cardiomyopathy Mouse Models Using ssGSEA. Heatmaps showing single‐sample gene set enrichment analysis (ssGSEA) scores for hallmark gene sets in mouse models of cardiomyopathy. Each panel represents one disease subtype: (A) ACM, (B) DCM, (C) HCM and (D) ICM. Rows correspond to annotated hallmark gene sets (left), and columns represent individual samples (top), grouped by disease versus wild type (WT). The colour scale ranges from blue (low ssGSEA score) to red (high ssGSEA score), reflecting pathway activity. This analysis validates the pathways identified through GSEA in human cardiomyopathy by assessing their enrichment in corresponding mouse models.CC BY · PubMed Central

Verification

Claims the paper makes

The claims and statistics of this paper haven’t been checked yet.

Run the check — free, no account needed. It reads the open-access text and checks the sources it cites.

A few free checks a day · papers already verified open instantly · results are public

Claims other papers make about this one

Each is checked against this paper’s own text: does it say what the citing paper says it does?

Self-check

Percentages, sums and reported differences re-computed from the paper’s own numbers.

The self-check needs the paper’s full text.

Citations

Cites

Show all 2 references

Research works printed but not linked: 44

  1. 10.1161/CIRCULATIONAHA.106.174287 · DOI
  2. 10.1016/j.xcrm.2024.101556 · DOI
  3. 10.1126/science.abo1984 · DOI · Paper page
  4. 10.1016/j.celrep.2023.112086 · DOI
  5. 10.1038/s41392‐024‐01840‐1 · DOI
  6. 10.1038/s41586‐022‐05060‐x · DOI · Paper page
  7. 10.1038/s41587‐023‐01767‐y · DOI · Paper page
  8. 10.1038/s41592‐019‐0619‐0 · DOI · Paper page
  9. 10.1016/j.cell.2021.04.048 · DOI · Paper page
  10. 10.1126/sciadv.abf1444 · DOI
  11. 10.1038/s44161‐022‐00028‐6 · DOI · Paper page
  12. 10.1038/s41586‐020‐2797‐4 · DOI · Paper page
  13. 10.1038/s41596‐024‐01020‐z · DOI
  14. R.Browaeys J.Gilis C.Sang‐Aram et al. “MultiNicheNet: A Flexible Framework for Differential Cell‐Cell Communication Analysis From Multi‐Sample Multi‐Condition Single‐Cell Transcriptomics Data.bioRxiv ”(2023) https://doi.org/10.1101/2023.06.13.544751. · DOI
  15. 10.1161/CIRCRESAHA.109.213157 · DOI · Paper page
  16. 10.1002/eji.201142209 · DOI
  17. 10.1111/imm.13490 · DOI
  18. 10.1093/cvr/cvaa324 · DOI · Paper page
  19. 10.1161/ATVBAHA.118.311229 · DOI
  20. 10.1038/s41419‐018‐0860‐y · DOI
  21. 10.1016/j.xcrm.2024.101559 · DOI
  22. 10.1038/s41569‐022‐00759‐w · DOI
  23. 10.1016/j.tcm.2019.09.003 · DOI
  24. 10.1177/2048004019843047 · DOI
  25. 10.1093/ehjci/jead119.134 · DOI
  26. 10.1016/s0008‐6363(99)00132‐7 · DOI
  27. 10.1155/2020/6627144 · DOI
  28. 10.1161/CIRCRESAHA.108.175018 · DOI
  29. 10.3390/ijms20215270 · DOI
  30. 10.3389/fphar.2019.01386 · DOI
  31. 10.1038/s41419‐021‐03395‐3 · DOI
  32. 10.1371/journal.ppat.1011929 · DOI
  33. 10.1038/s41598‐022‐08561‐x · DOI
  34. 10.1016/j.ebiom.2023.104744 · DOI
  35. 10.3390/biomedicines11020524 · DOI
  36. 10.1016/j.tcm.2021.02.009 · DOI
  37. 10.1007/s11886‐023‐01944‐0 · DOI
  38. 10.1093/cvr/cvp183 · DOI
  39. 10.3389/fphys.2020.529075 · DOI
  40. 10.1007/s10911‐023‐09554‐w · DOI
  41. 10.1038/s41467‐022‐30682‐0 · DOI
  42. 10.1038/s41525‐018‐0048‐5 · DOI
  43. 10.1186/s12967‐017‐1298‐1 · DOI
  44. 10.1007/s10741‐023‐10307‐4 · DOI

Cited by

Sorted by citations

Metadata

Authors
Tao, W., Gong, M., & Ke, Z.
Affiliations
  • Shanghai Medical College of Fudan University (CN)
  • Department of Geriatrics, Shanghai Fifth People's Hospital Fudan University Shanghai China
Venue
Journal of Cellular and Molecular Medicine
Publisher
Wiley
Published
2025-05
Volume
29
Issue
9
Pages
e70554-e70554
ISSN
  • 1582-1838 (ISSN-L)
  • 1582-4934
OpenAlex
W4410248941
Cited by
4
References
2
Citations by year
2026: 4
FWCI
2.79
Type
journal article
Language
en
Open access
Locations
  • Journal of Cellular and Molecular Medicine (publishedVersion, cc-by)
  • PubMed Central (publishedVersion, cc-by)
  • PubMed (publishedVersion)
Topics
  • Health Sciences › Medicine › Cardiology and Cardiovascular Medicine › Cardiomyopathy and Myosin Studies
  • Life Sciences › Biochemistry, Genetics and Molecular Biology › Molecular Biology › Single-cell and spatial transcriptomics
  • Health Sciences › Medicine › Cardiology and Cardiovascular Medicine › Cardiac electrophysiology and arrhythmias
Keywords
cardiomyopathy, intercellular communication, arrhythmogenic cardiomyopathy, dilated cardiomyopathy, hypertrophic cardiomyopathy, ischemic cardiomyopathy, ventricular myocytes, ligand-receptor interactions, extracellular matrix remodeling, fibrosis, lymphangiogenesis, chronic inflammation, ischemic injury, disease heterogeneity
MeSH terms
Cardiomyopathy, Dilated, Cell Communication, Humans, Cardiomyopathies, Signal Transduction, Gene Expression Profiling, Single-Cell Analysis, Transcriptome

About these checks

Registry, retraction, Cites and statistics results are computed, not judged, with one exception: a printed reference that no index lists is read once by a model before it counts as a citation error. Claims are extracted by a model and kept only when their quote appears verbatim in the text; each cited source is then checked, with a model’s help, for whether it says what the claim relies on. Those verdicts can be wrong — read the claim’s quote and the cited source before relying on one.

Statistics and arithmetic are recomputed, not judged.

Confidence bands are shown only for fields calibrated on our annotated test set. None is calibrated yet, so no band is shown.

What counts as a claim ›How we measure confidence ›How we check this ›

Are you an author, or do you see a problem with this page? Request a review