

The DOI matches its Crossref record, with a small difference in title or year; 96 of the 96 references it cites were found in a registry or an index.
Borrelia burgdorferi PlzA is a cyclic‐di‐GMP dependent DNA and RNA binding protein
Open accessPublished version of a preprint
Abstract
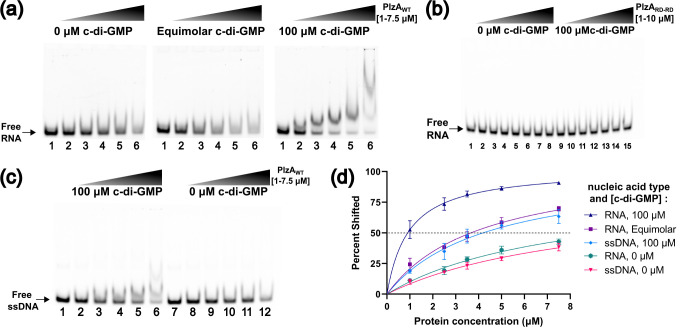
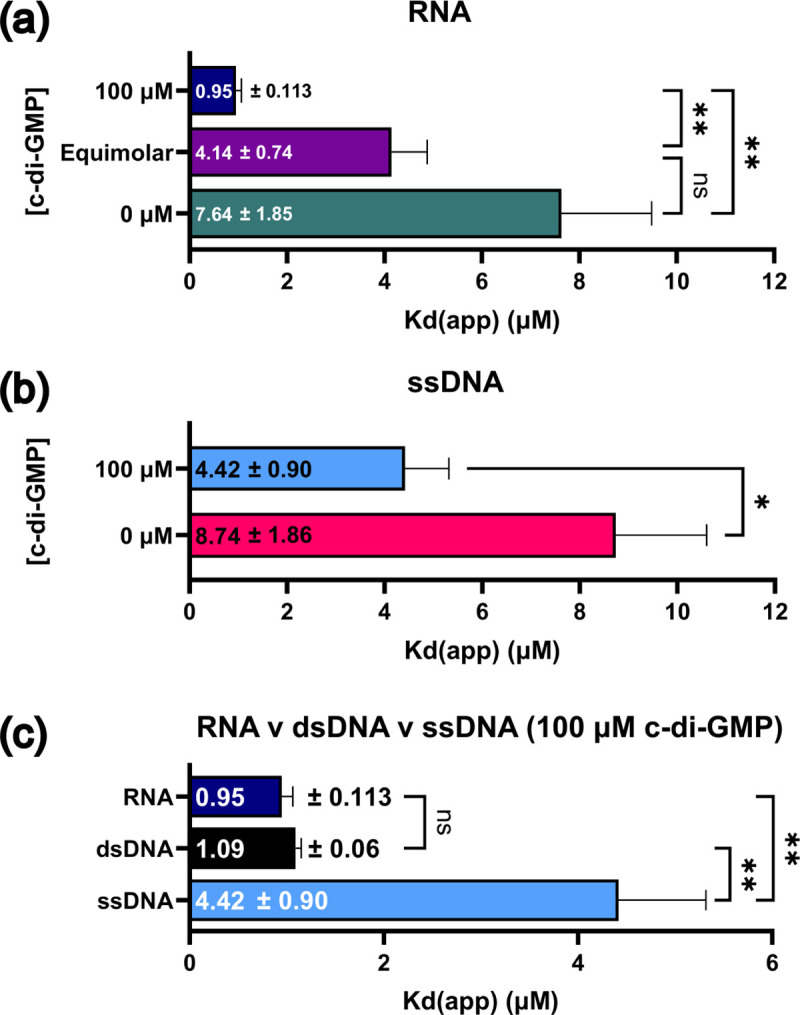
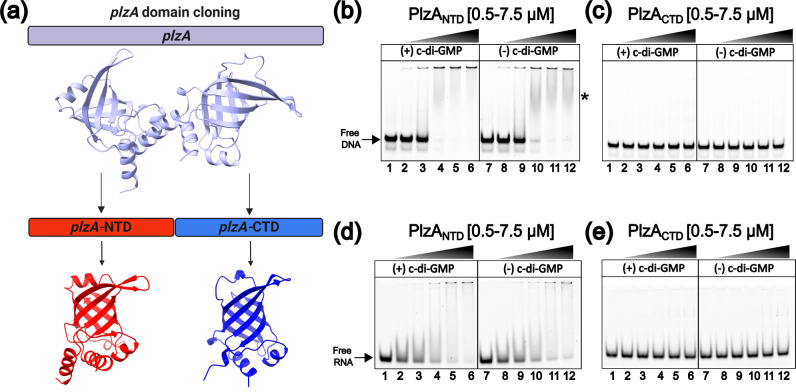
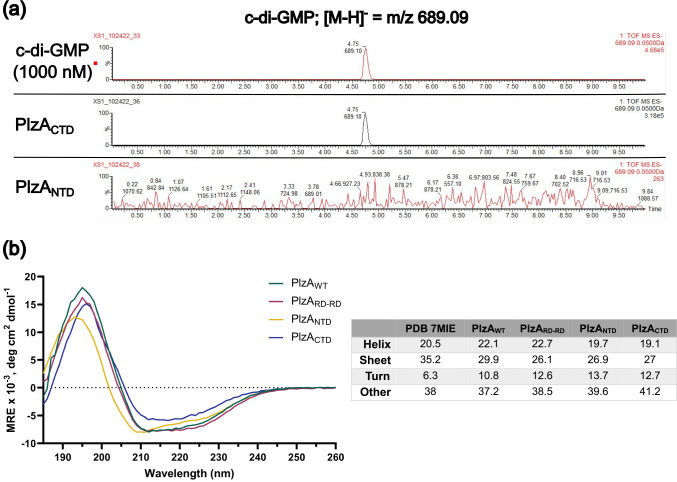
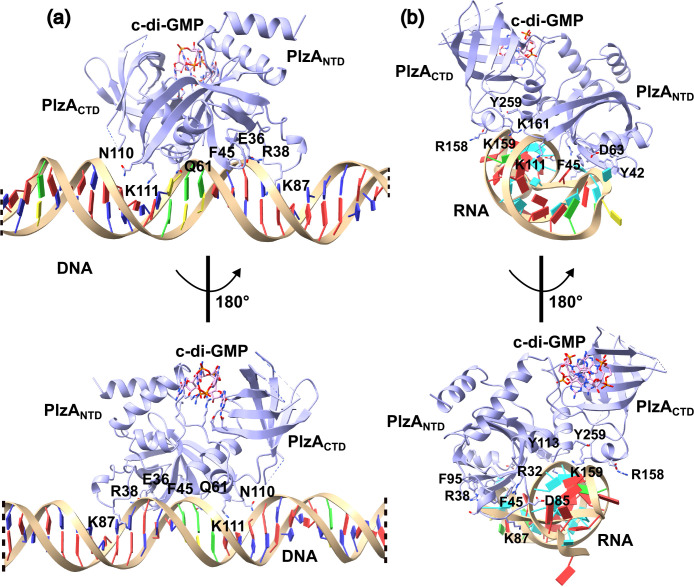
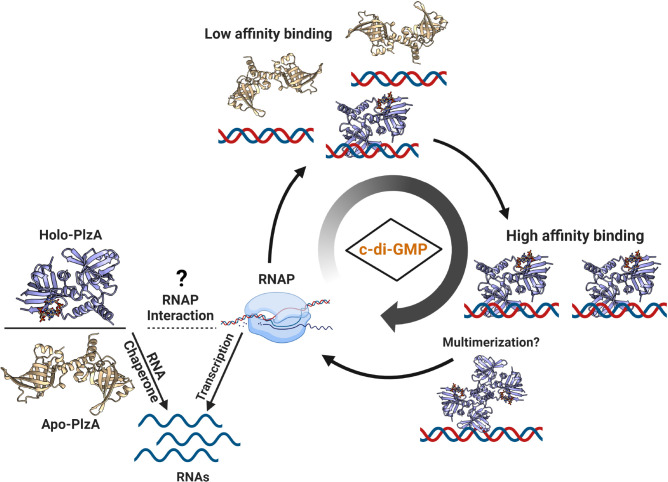
The PilZ domain‐containing protein, PlzA, is the only known cyclic di‐GMP binding protein encoded by all Lyme disease spirochetes. PlzA has been implicated in the regulation of many borrelial processes, but the effector mechanism of PlzA was not previously known. Here, we report that PlzA can bind DNA and RNA and that nucleic acid binding requires c‐di‐GMP, with the affinity of PlzA for nucleic acids increasing as concentrations of c‐di‐GMP were increased. A mutant PlzA that is incapable of binding c‐di‐GMP did not bind to any tested nucleic acids. We also determined that PlzA interacts predominantly with the major groove of DNA and that sequence length and G–C content play a role in DNA binding affinity. PlzA is a dual‐domain protein with a PilZ‐like N‐terminal domain linked to a canonical C‐terminal PilZ domain. Dissection of the domains demonstrated that the separated N‐terminal domain bound nucleic acids independently of c‐di‐GMP. The C‐terminal domain, which includes the c‐di‐GMP binding motifs, did not bind nucleic acids under any tested conditions. Our data are supported by computational docking, which predicts that c‐di‐GMP binding at the C‐terminal domain stabilizes the overall protein structure and facilitates PlzA‐DNA interactions via residues in the N‐terminal domain. Based on our data, we propose that levels of c‐di‐GMP during the various stages of the enzootic life cycle direct PlzA binding to regulatory targets.
Overview
The claims and statistics of this paper haven’t been checked yet.
Run the check — free, no account needed. It reads the open-access text and checks the sources it cites.
Integrity signals
Registry
Cites
Statistics
Figures
Verification
Claims the paper makes
The claims and statistics of this paper haven’t been checked yet.
Run the check — free, no account needed. It reads the open-access text and checks the sources it cites.
Self-check
Percentages, sums and reported differences re-computed from the paper’s own numbers.
The self-check needs the paper’s full text.
Citations
Cites
Highly accurate protein structure prediction with AlphaFold
Jumper, J., Evans, R., Pritzel, A., Green, T., Figurnov, M., Ronneberger, O., Tunyasuvunakool, K., Bates, R., Žídek, A., Potapenko, A., et al. (2021) · Nature · doi:10.1038/s41586-021-03819-2 · Cited by 43,764
Proceedings of the National Academy of Sciences of the United States of America
Dowling, J. E., & Wald, G. (2009) · Nutrition Reviews · doi:10.1111/j.1753-4887.1981.tb06752.x · Cited by 17,893
International Journal of Molecular Sciences
(2024) · International Journal of Molecular Sciences · doi:10.3390/ijms · Cited by 10,111
UCSF ChimeraX: Structure visualization for researchers, educators, and developers
Pettersen, E. F., Goddard, T. D., Huang, C. C., Meng, E. C., Couch, G. S., Croll, T. I., Morris, J. H., & Ferrin, T. E. (2021) · Protein Science · doi:10.1002/pro.3943 · Cited by 9,514
Biochemical and Biophysical Research Communications
Rc, A. N., On Filamentous Bacteriophage, M., Hoffmann, S., & Willbold, D. (1960) · Nature · doi:10.1038/186124d0 · Cited by 6,690
(2016) · Repository@Hull (Worktribe) (University of Hull) · doi:10.1111/j.1365 · Cited by 5,304
UCSF ChimeraX: Meeting modern challenges in visualization and analysis
Goddard, T. D., Huang, C. C., Meng, E. C., Pettersen, E. F., Couch, G. S., Morris, J. H., & Ferrin, T. E. (2018) · Protein Science · doi:10.1002/pro.3235 · Cited by 5,267
Equilibria and kinetics of lac repressor-operator interactions by polyacrylamide gel electrophoresis
Fried, M., & Crothers, D. M. (1981) · Nucleic Acids Research · doi:10.1093/nar/9.23.6505 · Cited by 2,738
Genomic sequence of a Lyme disease spirochaete, Borrelia burgdorferi
Fraser, C. M., Casjens, S., Huang, W. M., Sutton, G. G., Clayton, R., Lathigra, R., White, O., Ketchum, K. A., Dodson, R., Hickey, E. K., et al. (1997) · Nature · doi:10.1038/37551 · Cited by 2,108
The HDOCK server for integrated protein–protein docking
Yan, Y., Tao, H., He, J., & Huang, S. (2020) · Nature Protocols · doi:10.1038/s41596-020-0312-x · Cited by 1,956
Accurate secondary structure prediction and fold recognition for circular dichroism spectroscopy
Micsonai, A., Wien, F., Kernya, L., Lee, Y., Goto, Y., Réfrégiers, M., & Kardos, J. (2015) · Proceedings of the National Academy of Sciences · doi:10.1073/pnas.1500851112 · Cited by 1,761
Cyclic di-GMP: the First 25 Years of a Universal Bacterial Second Messenger
Römling, U., Galperin, M. Y., & Gomelsky, M. (2013) · Microbiology and Molecular Biology Reviews · doi:10.1128/mmbr.00043-12 · Cited by 1,738
Gross, K. S., Brandner, D. D., Martinez, L. A., Olive, M. F., Meisel, R. L., & Mermelstein, P. G. (2016) · PLOS ONE · doi:10.1371/journal.pone.0162755 · Cited by 1,609
Principles of c-di-GMP signalling in bacteria
Hengge, R. (2009) · Nature Reviews Microbiology · doi:10.1038/nrmicro2109 · Cited by 1,578
HDOCK: a web server for protein–protein and protein–DNA/RNA docking based on a hybrid strategy
Yan, Y., Zhang, D., Zhou, P., Li, B., & Huang, S. (2017) · Nucleic Acids Research · doi:10.1093/nar/gkx407 · Cited by 1,527
MICROBIOLOGY AND MOLECULAR BIOLOGY REVIEWS: 2011 INSTRUCTIONS TO AUTHORS
(2011) · Microbiology and Molecular Biology Reviews · doi:10.1128/mmbr.00038-10 · Cited by 1,313
Electrophoretic mobility shift assay (EMSA) for detecting protein–nucleic acid interactions
Hellman, L. M., & Fried, M. G. (2007) · Nature Protocols · doi:10.1038/nprot.2007.249 · Cited by 1,214
Micsonai, A., Wien, F., Bulyáki, É., Kun, J., Moussong, É., Lee, Y., Goto, Y., Réfrégiers, M., & Kardos, J. (2018) · Nucleic Acids Research · doi:10.1093/nar/gky497 · Cited by 1,157
Cyclic di-GMP: second messenger extraordinaire
Jenal, U., Reinders, A., & Lori, C. (2017) · Nature Reviews Microbiology · doi:10.1038/nrmicro.2016.190 · Cited by 1,039
Proteins: Structure, Function, and Bioinformatics
(2006) · Proteins Structure Function and Bioinformatics · doi:10.1002/(issn)1097-0134 · Cited by 943
Casjens, S., Palmer, N., van Vugt, R., Huang, W. M., Stevenson, B., Rosa, P. A., Lathigra, R. B., Sutton, G. G., Peterson, J. D., Dodson, R. J., et al. (2000) · Molecular Microbiology · doi:10.1046/j.1365-2958.2000.01698.x · Cited by 856
Self-citationNovel domains of the prokaryotic two-component signal transduction systems
Galperin, M. (2001) · FEMS Microbiology Letters · doi:10.1016/s0378-1097(01)00326-3 · Cited by 665
Ryjenkov, D. A., Tarutina, M., Moskvin, O. V., & Gomelsky, M. (2005) · Journal of Bacteriology · doi:10.1128/jb.187.5.1792-1798.2005 · Cited by 579
PilZ domain is part of the bacterial c-di-GMP binding protein
Amikam, D., & Galperin, M. Y. (2005) · Bioinformatics · doi:10.1093/bioinformatics/bti739 · Cited by 529
The PilZ Domain Is a Receptor for the Second Messenger c-di-GMP
Ryjenkov, D. A., Simm, R., Römling, U., & Gomelsky, M. (2006) · Journal of Biological Chemistry · doi:10.1074/jbc.c600179200 · Cited by 481
BeStSel: webserver for secondary structure and fold prediction for protein CD spectroscopy
Micsonai, A., Moussong, É., Wien, F., Boros, E., Vadászi, H., Murvai, N., Lee, Y.-H., Molnár, T., Réfrégiers, M., Goto, Y., et al. (2022) · Nucleic Acids Research · doi:10.1093/nar/gkac345 · Cited by 455
Wilksch, J. J., Yang, J., Clements, A., Gabbe, J. L., Short, K. R., Cao, H., Cavaliere, R., James, C. E., Whitchurch, C. B., Schembri, M. A., et al. (2011) · PLoS Pathogens · doi:10.1371/journal.ppat.1002204 · Cited by 302
Measurement of protein‐DNA interaction parameters by electrophoresis mobility shift assay
Fried, M. G. (1989) · Electrophoresis · doi:10.1002/elps.1150100515 · Cited by 272
Diversity of Cyclic Di-GMP-Binding Proteins and Mechanisms
Chou, S., & Galperin, M. Y. (2015) · Journal of Bacteriology · doi:10.1128/jb.00333-15 · Cited by 261
Tschowri, N., Schumacher, M. A., Schlimpert, S., Chinnam, N. B., Findlay, K., Brennan, R. G., & Buttner, M. J. (2014) · Cell · doi:10.1016/j.cell.2014.07.022 · Cited by 249
Protein aggregation in bacteria
Schramm, F. D., Schroeder, K., & Jonas, K. (2019) · FEMS Microbiology Reviews · doi:10.1093/femsre/fuz026 · Cited by 203
Huang, S.-Y., & Zou, X. (2014) · Nucleic Acids Research · doi:10.1093/nar/gku077 · Cited by 195
FEMS Immunology and Medical Microbiology
(1993) · FEMS Microbiology Reviews · doi:10.1016/0168-6445(93)90051-a · Cited by 190
Yan, Y., Wen, Z., Wang, X., & Huang, S. (2016) · Proteins Structure Function and Bioinformatics · doi:10.1002/prot.25234 · Cited by 173
Multiple Roles of c-di-GMP Signaling in Bacterial Pathogenesis
Valentini, M., & Filloux, A. (2019) · Annual Review of Microbiology · doi:10.1146/annurev-micro-020518-115555 · Cited by 170
Sarenko, O., Klauck, G., Wilke, F. M., Pfiffer, V., Richter, A. M., Herbst, S., Kaever, V., & Hengge, R. (2017) · mBio · doi:10.1128/mbio.01639-17 · Cited by 159
Kim, S. K., & Nordén, B. (1993) · FEBS Letters · doi:10.1016/0014-5793(93)81133-k · Cited by 151
Mutations derived from horseshoe bat ACE2 orthologs enhance ACE2-Fc neutralization of SARS-CoV-2
Mou, H., Quinlan, B. D., Peng, H., Liu, G., Guo, Y., Peng, S., Zhang, L., Davis-Gardner, M. E., Gardner, M. R., Crynen, G. C., et al. (2021) · PLoS Pathogens · doi:10.1371/journal.ppat.1009501 · Cited by 147
Dimerization of a Specific DNA-Binding Protein on the DNA
Kim, B., & Little, J. W. (1992) · Science · doi:10.1126/science.1553548 · Cited by 137
Cyclic di-GMP is Essential for the Survival of the Lyme Disease Spirochete in Ticks
He, M. L., Ouyang, Z., Troxell, B., Xu, H., Moh, A., Piesman, J. F., Norgard, M. V., Gomelsky, M., & Yang, X. (2011) · PLoS Pathogens · doi:10.1371/journal.ppat.1002133 · Cited by 134
Rogers, E. A., Terekhova, D. A., Zhang, H., Hovis, K. M., Schwartz, I. S., & Marconi, R. T. (2009) · Molecular Microbiology · doi:10.1111/j.1365-2958.2009.06621.x · Cited by 129
Cation–π/H-bond Stair Motifs at Protein–DNA Interfaces
Rooman, M. J., Liévin, J., Buisine, E., & Wintjens, R. T. (2002) · Journal of Molecular Biology · doi:10.1016/s0022-2836(02)00263-2 · Cited by 128
Pappas, C. J., Iyer, R., Petzke, M. M., Caimano, M. J., Radolf, J. D., & Schwartz, I. S. (2011) · PLoS Pathogens · doi:10.1371/journal.ppat.1002102 · Cited by 109
DNA specificity enhanced by sequential binding of protein monomers
Kohler, J. J., Metallo, S. J., Schneider, T. L., & Schepartz, A. (1999) · Proceedings of the National Academy of Sciences · doi:10.1073/pnas.96.21.11735 · Cited by 104
Pultz, I. S., Christen, M., Kulasekara, H. D., Kennard, A. S., Kulasekara, B. R., & Miller, S. I. (2012) · Molecular Microbiology · doi:10.1111/mmi.12066 · Cited by 99
Kostick, J. L., Szkotnicki, L. T., Rogers, E. A., Bocci, P., Raffaelli, N., & Marconi, R. T. (2011) · Molecular Microbiology · doi:10.1111/j.1365-2958.2011.07687.x · Cited by 95
Caimano, M. J., Kenedy, M. R., Kairu, T., Desrosiers, D. C., Harman, M. W., Dunham-Ems, S. M., Akins, D. R., Pal, U., & Radolf, J. D. (2011) · Infection and Immunity · doi:10.1128/iai.05136-11 · Cited by 93
Caimano, M. J., Dunham-Ems, S. M., Allard, A. M., Cassera, M. B., Kenedy, M. R., & Radolf, J. D. (2015) · Infection and Immunity · doi:10.1128/iai.00315-15 · Cited by 86
Pitzer, J. E., Sultan, S. Z., Hayakawa, Y., Hobbs, G. R., Miller, M. R., & Motaleb, M. A. (2011) · Infection and Immunity · doi:10.1128/iai.00075-11 · Cited by 84
Self-citationSultan, S. Z., Pitzer, J. E., Boquoi, T., Hobbs, G. R., Miller, M. R., & Motaleb, M. A. (2011) · Infection and Immunity · doi:10.1128/iai.05153-11 · Cited by 84
Self-citationCold-Hardiness in the Antarctic Tick, Ixodes uriae
Lee, R. E., Jr., & Baust, J. G. (1987) · Physiological Zoology · doi:10.1086/physzool.60.4.30157912 · Cited by 84
Sultan, S. Z., Pitzer, J. E., Miller, M. R., & Motaleb, M. A. (2010) · Molecular Microbiology · doi:10.1111/j.1365-2958.2010.07191.x · Cited by 79
Self-citationSchäper, S., Steinchen, W., Krol, E., Altegoer, F., Skotnicka, D., Søgaard‐Andersen, L., Bange, G., & Becker, A. (2017) · Proceedings of the National Academy of Sciences · doi:10.1073/pnas.1702435114 · Cited by 75
Identification and Characterization of VpsR and VpsT Binding Sites in Vibrio cholerae
Zamorano‐Sánchez, D., Fong, J. C. N., Kılıç, S., Erill, I., & Yildiz, F. H. (2015) · Journal of Bacteriology · doi:10.1128/jb.02439-14 · Cited by 73
Adams, P. P., Avile, C. F., Popitsch, N. P., Bilusic, I., Schroeder, R., Lybecker, M. C., & Jewett, M. W. (2016) · Nucleic Acids Research · doi:10.1093/nar/gkw1180 · Cited by 72
The Miraprep: A Protocol that Uses a Miniprep Kit and Provides Maxiprep Yields
Pronobis, M. I., Deuitch, N. T., & Peifer, M. A. (2016) · PLoS ONE · doi:10.1371/journal.pone.0160509 · Cited by 67
Borrelia burgdorferi : Carbon Metabolism and the Tick-Mammal Enzootic Cycle
Corona, A., & Schwartz, I. S. (2015) · Microbiology Spectrum · doi:10.1128/microbiolspec.mbp-0011-2014 · Cited by 64
Interaction of DNA with clusters of amino acids in proteins
Sathyapriya, R., & Vishveshwara, S. (2004) · Nucleic Acids Research · doi:10.1093/nar/gkh733 · Cited by 64
Freedman, J. C., Rogers, E. A., Kostick, J. L., Zhang, H., Iyer, R., Schwartz, I. S., & Marconi, R. T. (2009) · FEMS Immunology & Medical Microbiology · doi:10.1111/j.1574-695x.2009.00635.x · Cited by 62
A novel nucleoid-associated protein of Mycobacterium tuberculosis is a sequence homolog of GroEL
Basu, D., Khare, G., Singh, S. S., Tyagi, A. K., Khosla, S., & Mande, S. C. (2009) · Nucleic Acids Research · doi:10.1093/nar/gkp502 · Cited by 61
Centronuclear Myopathy Caused by Defective Membrane Remodelling of Dynamin 2 and BIN1 Variants
Fujise, K., Noguchi, S., & Takeda, T. (2022) · International Journal of Molecular Sciences · doi:10.3390/ijms23116274 · Cited by 55
Jutras, B. L., Bowman, A., Brissette, C. A., Adams, C., Verma, A., Chenail, A. M., & Stevenson, B. (2012) · Journal of Bacteriology · doi:10.1128/jb.00252-12 · Cited by 52
Self-citationEubacterial SpoVG Homologs Constitute a New Family of Site-Specific DNA-Binding Proteins
Jutras, B. L., Chenail, A. M., Rowland, C. L., Carroll, D. W., Miller, M. C., Bykowski, T., & Stevenson, B. (2013) · PLoS ONE · doi:10.1371/journal.pone.0066683 · Cited by 51
Self-citationCyclic Di-GMP Receptor PlzA Controls Virulence Gene Expression through RpoS in Borrelia burgdorferi
He, M. L., Zhang, J., Ye, M., Lou, Y., & Yang, X. (2013) · Infection and Immunity · doi:10.1128/iai.01238-13 · Cited by 49
Hsieh, M., Hinton, D. M., & Waters, C. M. (2018) · Nucleic Acids Research · doi:10.1093/nar/gky606 · Cited by 48
Riley, S. P., Bykowski, T., Cooley, A. E., Burns, L. H., Babb, K., Brissette, C. A., Bowman, A., Rotondi, M., Miller, M. C., DeMoll, E., et al. (2009) · Nucleic Acids Research · doi:10.1093/nar/gkp027 · Cited by 46
Self-citationThe cyclic-di-GMP signaling pathway in the Lyme disease spirochete, Borrelia burgdorferi
Novak, E. A., Sultan, S. Z., & Motaleb, M. A. (2014) · Frontiers in Cellular and Infection Microbiology · doi:10.3389/fcimb.2014.00056 · Cited by 44
Self-citationYang, J. W., Wilksch, J. J., Tan, J. W. H., Hocking, D. M., Webb, C. T., Lithgow, T. J., Robins-Browne, R. M., & Strugnell, R. A. (2013) · PLoS ONE · doi:10.1371/journal.pone.0079038 · Cited by 44
Local signaling enhances output specificity of bacterial c-di-GMP signaling networks
Junkermeier, E. H., & Hengge, R. (2023) · microLife · doi:10.1093/femsml/uqad026 · Cited by 43
Babb, K., Bykowski, T., Riley, S. P., Miller, M. C., DeMoll, E., & Stevenson, B. (2006) · Journal of Bacteriology · doi:10.1128/jb.00005-06 · Cited by 42
Self-citationStructural Conservation and Diversity of PilZ-Related Domains
Galperin, M. Y., & Chou, S. (2019) · Journal of Bacteriology · doi:10.1128/jb.00664-19 · Cited by 42
Liu, Y., Wang, H., Cui, T., Zhou, X., Jia, Y., Zhang, H., & He, Z. (2016) · Molecular Microbiology · doi:10.1111/mmi.13383 · Cited by 38
Tan, J. W. H., Wilksch, J. J., Hocking, D. M., Wang, N., Srikhanta, Y. N., Tauschek, M., Lithgow, T. J., Robins-Browne, R. M., Yang, J. W., & Strugnell, R. A. (2015) · Journal of Bacteriology · doi:10.1128/jb.02615-14 · Cited by 37
Savage, C. R., Jutras, B. L., Bestor, A. C., Tilly, K., Rosa, P. A., Tourand, Y., Stewart, P. E., Brissette, C. A., & Stevenson, B. (2018) · Journal of Bacteriology · doi:10.1128/jb.00033-18 · Cited by 36
Self-citationBurns, L. H., Adams, C., Riley, S. P., Jutras, B. L., Bowman, A., Chenail, A. M., Cooley, A. E., Haselhorst, L. A., Moore, A. M., Babb, K., et al. (2010) · Nucleic Acids Research · doi:10.1093/nar/gkq284 · Cited by 33
Self-citationGrove, A. P., Liveris, D., Iyer, R., Petzke, M. M., Rudman, J., Caimano, M. J., Radolf, J. D., & Schwartz, I. S. (2017) · mBio · doi:10.1128/mbio.01204-17 · Cited by 33
Emerging paradigms for PilZ domain-mediated C-di-GMP signaling
Cheang, Q. W., Xin, L., Chea, R. Y. F., et al. (2019) · Biochemical Society Transactions · doi:10.1042/bst20180543 · Cited by 33
Bpur, the Lyme Disease Spirochete's PUR Domain Protein
Jutras, B. L., Chenail, A. M., Carroll, D. W., Miller, M. C., Zhu, H., Bowman, A., & Stevenson, B. (2013) · Journal of Biological Chemistry · doi:10.1074/jbc.m113.491357 · Cited by 31
Self-citationLarouche, K., Bergeron, M., Leclerc, S., & Guérin, S. L. (1996) · BioTechniques · doi:10.2144/19962003439 · Cited by 29
Interactions between Borrelia burgdorferi and its hosts across the enzootic cycle
Helble, J. D., McCarthy, J. E., & Hu, L. T. (2020) · Parasite Immunology · doi:10.1111/pim.12816 · Cited by 29
Shi, W., Zhang, B., Li, M., Liu, K., Jiao, J., & Tian, C. F. (2022) · Nucleic Acids Research · doi:10.1093/nar/gkac664 · Cited by 29
Grassmann, A. A., Tokarz, R., Golino, C., McLain, M. A., Groshong, A. M., Radolf, J. D., & Caimano, M. J. (2023) · Journal of Clinical Investigation · doi:10.1172/jci166710 · Cited by 28
Mallory, K. L., Miller, D. P., Oliver, L. D., Freedman, J. C., Kostick, J. L., Carlyon, J. A., Marion, J. D., Bell, J. K., & Marconi, R. T. (2016) · Pathogens and Disease · doi:10.1093/femspd/ftw105 · Cited by 24
The PilZ domain of MrkH represents a novel DNA binding motif
Wang, F., He, Q. W., Su, K., Gao, F., Huang, Y., Lin, Z., Zhu, D., & Gu, L. (2016) · Protein & Cell · doi:10.1007/s13238-016-0317-y · Cited by 22
Zhang, J., Chen, T., Yang, Y., Du, J., Li, H., Troxell, B., He, M. L., Carrasco, S. E., Gomelsky, M., & Yang, X. (2018) · Journal of Bacteriology · doi:10.1128/jb.00243-18 · Cited by 22
Skotnicka, D., Steinchen, W., Szadkowski, D., et al. (2020) · Nature Communications · doi:10.1038/s41467-020-15628-8 · Cited by 21
Bauer, W. J., Luthra, A., Zhu, G., Radolf, J. D., Malkowski, M. G., & Caimano, M. J. (2015) · Journal of Structural Biology · doi:10.1016/j.jsb.2015.08.013 · Cited by 18
The Borrelia burgdorferi c-di-GMP Binding Receptors, PlzA and PlzB, Are Functionally Distinct
Kostick, J. L., Izac, J. R., Freedman, J. C., Szkotnicki, L. T., Oliver, L. D., & Marconi, R. T. (2018) · Frontiers in Cellular and Infection Microbiology · doi:10.3389/fcimb.2018.00213 · Cited by 17
Groshong, A. M., Grassmann, A. A., Luthra, A., McLain, M. A., Provatas, A. A., Radolf, J. D., & Caimano, M. J. (2021) · PLoS Pathogens · doi:10.1371/journal.ppat.1009725 · Cited by 16
Affinity, Specificity, and Cooperativity of DNA Binding by Bacterial Gene Regulatory Proteins
Carey, J. (2022) · International Journal of Molecular Sciences · doi:10.3390/ijms23010562 · Cited by 16
Bong, H.-J., Ko, E.-M., Song, S.-Y., Ko, I.-J., & Oh, J. (2019) · Journal of Bacteriology · doi:10.1128/jb.00511-19 · Cited by 15
Quantitative analyses of interactions between SpoVG and RNA/DNA
Saylor, T. C., Savage, C. R., Krusenstjerna, A. C., Jusufovic, N., Zückert, W. R., Brissette, C. A., Motaleb, M. A., Schlax, P. J., & Stevenson, B. (2023) · Biochemical and Biophysical Research Communications · doi:10.1016/j.bbrc.2023.02.044 · Cited by 10
Self-citationSingh, A. K., Izac, J. R., Schuler, E. J. A., Patel, D. T., Davies, C., & Marconi, R. T. (2021) · Pathogens and Disease · doi:10.1093/femspd/ftab030 · Cited by 9
Krusenstjerna, A. C., Saylor, T. C., Arnold, W. K., Tucker, J. S., & Stevenson, B. (2022) · Journal of Bacteriology · doi:10.1128/jb.00396-22 · Cited by 9
Self-citationc‐di‐GMP regulates activity of the PlzA RNA chaperone from the Lyme disease spirochete
Gundy, T. J. V., Patel, D. T., Bowler, B. E., Rothfuss, M. T., Hall, A. J., Davies, C., Hall, L. S., Drecktrah, D., Marconi, R. T., Samuels, D. S., et al. (2023) · Molecular Microbiology · doi:10.1111/mmi.15066 · Cited by 8
Zhang, J., Raghunandanan, S., Wang, Q., Priya, R., Alanazi, F., Lou, Y., & Yang, X. (2024) · Journal of Bacteriology · doi:10.1128/jb.00340-23 · Cited by 6
Research works printed but not linked: 1
- 10.1111/j.1574-6968.2001.tb10814.x · DOI · Paper page
Metadata
- Authors
- Jusufovic, N., Krusenstjerna, A. C., Savage, C. R., Saylor, T. C., Brissette, C. A., Zückert, W. R., Schlax, P. J., Motaleb, M. A., & Stevenson, B.
- Affiliations
- University of Kentucky (US)
- University of North Dakota (US)
- University of Kansas (US)
- Bates College (US)
- East Carolina University (US)
- Corresponding author
- Stevenson, Brian
- ORCID
- Venue
- Molecular Microbiology
- Publisher
- Wiley
- Published
- 2024-03-25
- Volume
- 121
- Issue
- 5
- Pages
- 1039-1062
- ISSN
- 0950-382X (ISSN-L)
- 1365-2958
- PMC
- PMC9915621
- OpenAlex
- W4394758680
- Cited by
- 7
- References
- 96
- Citations by year
- 2025: 2 · 2024: 1
- FWCI
- 0.79
- Type
- journal article
- Language
- en
- Open access
- hybrid
- doi.org
- Licence
- Locations
- Molecular Microbiology (publishedVersion, cc-by-nc)
- bioRxiv (Cold Spring Harbor Laboratory) (acceptedVersion, cc-by-nc-nd)
- PubMed (publishedVersion)
- PubMed Central (submittedVersion, cc-by-nc-nd)
- SCARAB (Bates College) (submittedVersion, cc-by-nc)
- UKnowledge (University of Kentucky) (submittedVersion, cc-by-nc)
- Funders
- National Institutes of Health (R01 AI144126‐3)
- Topics
- Life Sciences › Biochemistry, Genetics and Molecular Biology › Genetics › Bacterial Genetics and Biotechnology
- Life Sciences › Immunology and Microbiology › Parasitology › Vector-borne infectious diseases
- Life Sciences › Biochemistry, Genetics and Molecular Biology › Molecular Biology › Biochemical and Structural Characterization
- Keywords
- Borrelia burgdorferi, PilZ domain, c-di-GMP, nucleic acid binding, DNA binding, RNA binding, major groove, GC content, protein-DNA interactions, protein structure stabilization, gene expression regulation
About these checks
Registry, retraction, Cites and statistics results are computed, not judged, with one exception: a printed reference that no index lists is read once by a model before it counts as a citation error. Claims are extracted by a model and kept only when their quote appears verbatim in the text; each cited source is then checked, with a model’s help, for whether it says what the claim relies on. Those verdicts can be wrong — read the claim’s quote and the cited source before relying on one.
Statistics and arithmetic are recomputed, not judged.
Confidence bands are shown only for fields calibrated on our annotated test set. None is calibrated yet, so no band is shown.
What counts as a claim ›How we measure confidence ›How we check this ›
Are you an author, or do you see a problem with this page? Request a review
Data sources
Bibliographic data: Semantic Scholar, OpenAlex, Crossref.
Contains information from the Semantic Scholar Academic Graph Datasets, made available under the ODC Attribution License (ODC-BY 1.0).
Semantic Scholar’s data is described in: Kinney, R., et al. (2023). The Semantic Scholar Open Data Platform. arXiv:2301.10140.
