

The DOI matches its Crossref record; 26 of the 26 references it cites were found in a registry or an index; none of the 14 sources its claims cite is checked for support yet.
A time-scale modification dataset with subjective quality labels
Open accessAbstract
Time Scale Modification (TSM) is a well-researched field; however, no effective objective measure of quality exists. This paper details the creation, subjective evaluation, and analysis of a dataset for use in the development of an objective measure of quality for TSM. Comprised of two parts, the training component contains 88 source files processed using six TSM methods at 10 time scales, while the testing component contains 20 source files processed using three additional methods at four time scales. The source material contains speech, solo harmonic and percussive instruments, sound effects, and a range of music genres. Ratings (42 529) were collected from 633 sessions using laboratory and remote collection methods. Analysis of results shows no correlation between age and quality of rating; expert and non-expert listeners to be equivalent; minor differences between participants with and without hearing issues; and minimal differences between testing modalities. A comparison of published objective measures and subjective scores shows the objective measures to be poor indicators of subjective quality. Initial results for a retrained objective measure of quality are presented with results approaching average root mean squared error loss and Pearson correlation values of subjective sessions. The labeled dataset is available at http://ieee-dataport.org/1987.
Overview
CoChat Summary
TL;DR
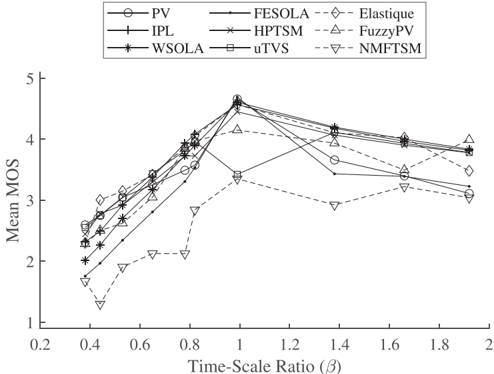
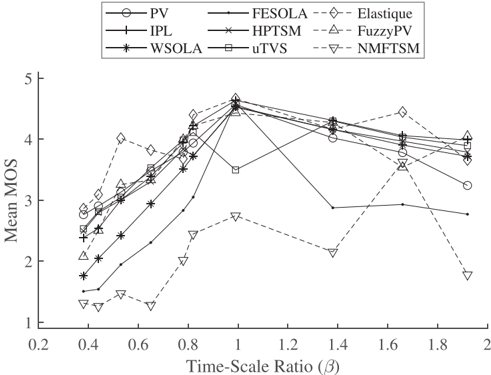
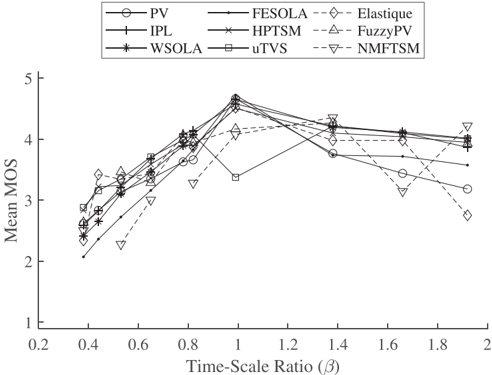
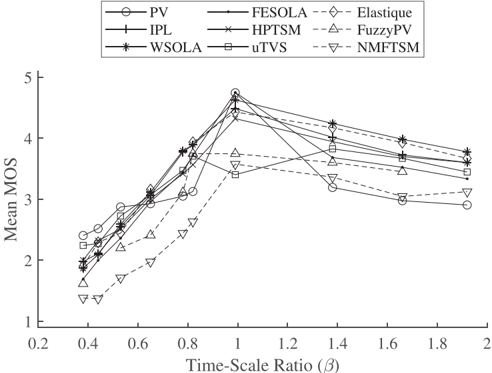
This paper presents a labeled dataset for time-scale modification (TSM) quality, with 88 source files processed by six methods at 10 time scales for training and 20 source files processed by three additional methods at four time scales for testing. It collects 42,529 subjective ratings and shows that existing objective measures correlate poorly with subjective quality, while a retrained PEAQ-based measure approaches session-level RMSE and PCC.
Key findings
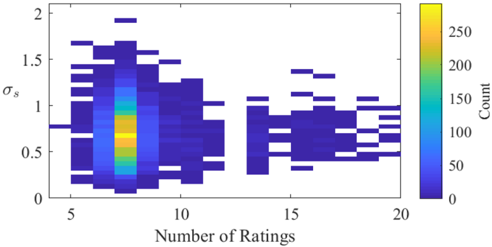
- The dataset contains 5,280 training processed files (88 sources × six methods × 10 time scales) and 240 testing files (20 sources × three additional methods × four time scales); 42,529 ratings were collected from 263 participants across 633 sessions, including 10,354 laboratory ratings.
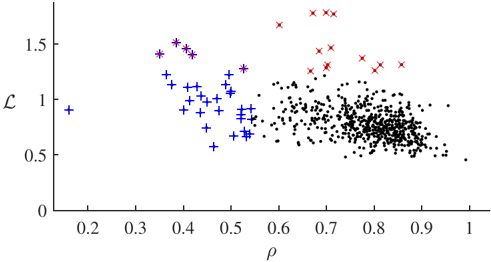
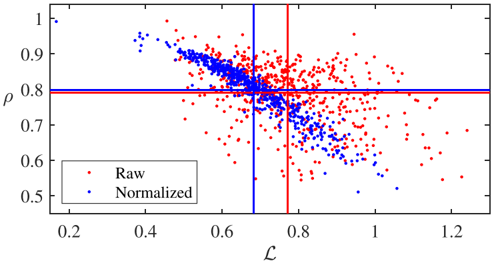
- After outlier removal (45 sessions, 2,102 ratings, 4.94%) and normalization, session reliability improved: mean RMSE 0.771→0.682 and mean PCC 0.791→0.799; interrater reliability G(q,k) was 0.871 before and 0.909 after normalization.
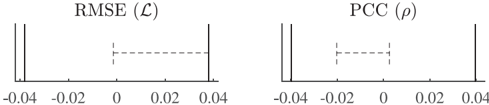
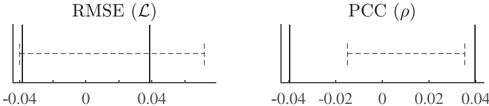
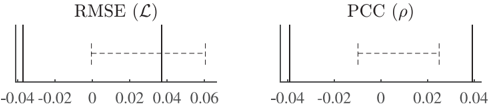
- Expert and non-expert listeners were equivalent on RMSE/PCC; participants with and without hearing issues showed equivalent PCC but not RMSE; remote and laboratory modalities showed equivalent PCC but not RMSE. Age correlated 0.108 with RMSE and −0.001 with PCC.
- Published objective measures correlated poorly with MOS: SER 0.3707 and D_M 0.1574. A retrained PEAQ network achieved best D = 0.731, RMSE L = 0.668, and PCC q = 0.719, placing it at the 11th and 17th percentiles of subjective sessions.
Methods
- Source material: 34 musical, 37 solo instrument, and 37 voice files (total playback 6 min 42 s; mean duration 3.7 s, SD 1.6 s), mono, 16-bit, 44.1 kHz, normalized before TSM; includes speech, solo harmonic and percussive instruments, sound effects, and a range of music genres.
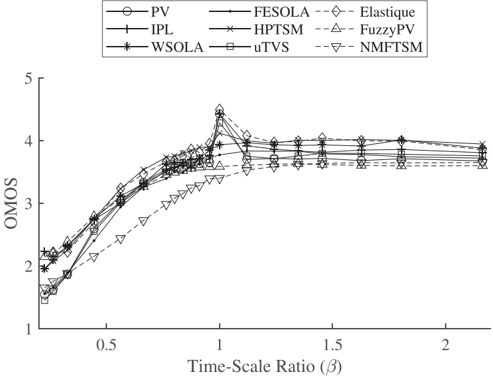
- TSM processing: training set used six methods (PV, IPL, WSOLA, FESOLA, HPTSM, uTVS) at 10 time scales; testing set used Elastique, FuzzyPV, and NMFTSM at four time scales; an additional evaluation set used all methods at 20 time scales in the range 0.22 < b < 2.2.
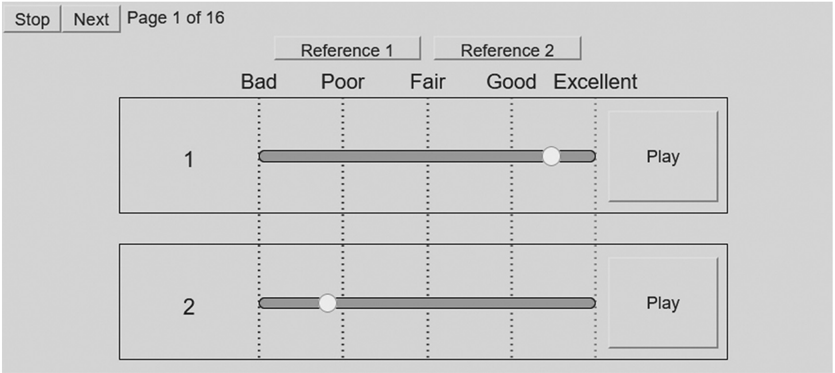
- Subjective testing: laboratory MATLAB GUI and remote WAET browser tests, reference-processed pairs, continuous 1–5 quality scale, ITU-R BS.1248-1/BS.1284-style normalization; analysis used MOS, RMSE, PCC, outlier removal, TOST equivalence tests, interrater reliability, and comparison/retraining of objective measures.
Limitations
- The paper states that an error in the uTVS implementation introduced spectral discontinuities for 0.9 < b < 1.1 on some files and these were not removed from the training dataset; it was rectified before the evaluation subset. It also states testing-subset means are noisier due to fewer files and nonuniform processing difficulty, and direct training/testing method comparison was not appropriate.
- The paper states that only 33 sessions reported any hearing issue versus 554 with no issue, increasing standard error; RMSE equivalence for hearing issues and testing modality required widening the equivalence interval to 69.32% and 68.14%, respectively. It also notes some files had not yet converged in MOS standard deviation, though this was a small subset.
- Evident from the text: the objective measure is preliminary and its output only moves away from the mean for b < 0.75 and b = 1; source material was collated from the authors’ previous projects and short excerpts (mean 3.7 s), which may limit generalization beyond this dataset.
Model-written summary. Check it against the paper before relying on it.
Integrity signals
Registry
Cites
Statistics
Figures

Verification
Claims the paper makes
0 Valid · 0 Not valid · 12 Not checked · 93 Own results and interpretations
A result the paper reports from its own data — it cites no other source for it, so there is none to check. The quote shows it is in the paper.
In the paper
“Initial results for a retrained objective measure of quality are presented with results approaching average root mean squared error loss and Pearson correlation values of subjective sessions.”
§ A time-scale modification dataset with subjective quality > Abstract
plainstates an association- Asserted: passes — The authors put it forward as true.
- Checkable: passes — It can be checked against evidence.
- Load-bearing: passes — The paper’s conclusions depend on it.
- Based: passes — The paper gives a reason why it holds.
A result the paper states — it cites no source for it, so there is none to check. The quote shows it is in the paper.
In the paper
“Mean MOS for testing subset methods are noisier due to the smaller number of files, and nonuniform difficulty in processing each signal.”
§ A time-scale modification dataset with subjective quality > A. Results
plainstates a cause- Asserted: passes — The authors put it forward as true.
- Checkable: passes — It can be checked against evidence.
- Load-bearing: unclear — It is unclear whether the paper’s conclusions depend on it.
- Based: passes — The paper gives a reason why it holds.
A result the paper reports from its own data — it cites no other source for it, so there is none to check. The quote shows it is in the paper.
In the paper
“A comparison of published objective measures and subjective scores shows the objective measures to be poor indicators of subjective quality.”
§ A time-scale modification dataset with subjective quality > Abstract
plainstates an association- Asserted: passes — The authors put it forward as true.
- Checkable: passes — It can be checked against evidence.
- Load-bearing: passes — The paper’s conclusions depend on it.
- Based: passes — The paper gives a reason why it holds.
A result the paper reports from its own data — it cites no other source for it, so there is none to check. The quote shows it is in the paper.
In the paper
“Analysis of results shows no correlation between age and quality of rating; expert and non-expert listeners to be equivalent; minor differences between participants with and without hearing issues; and minimal differences between testing modalities.”
§ A time-scale modification dataset with subjective quality > Abstract
plain- Asserted: passes — The authors put it forward as true.
- Checkable: passes — It can be checked against evidence.
- Load-bearing: unclear — It is unclear whether the paper’s conclusions depend on it.
- Based: passes — The paper gives a reason why it holds.
A result the paper reports from its own data — it cites no other source for it, so there is none to check. The quote shows it is in the paper.
In the paper
“Analysis of results shows no correlation between age and quality of rating; expert and non-expert listeners to be equivalent; minor differences between participants with and without hearing issues; and minimal differences between testing modalities.”
§ A time-scale modification dataset with subjective quality > Abstract
plain- Asserted: passes — The authors put it forward as true.
- Checkable: passes — It can be checked against evidence.
- Load-bearing: unclear — It is unclear whether the paper’s conclusions depend on it.
- Based: passes — The paper gives a reason why it holds.
42 more claims
Create a free account to see all 105 claims and to verify the 8 references still open.
- Probably not a substantial claim. 26
- It may state two separate claims as one. 39
Claims other papers make about this one
Each is checked against this paper’s own text: does it say what the citing paper says it does?
In the citing paper
“The testing subset, containing 240 files, was created using three additional methods to time-scale 20 reference files at a random β in each band of 0.25 < β < 0.5, 0.5 < β < 0.8, 0.8 < β < 1 and 1 < β < 2.”
From An objective measure of quality for time-scale modification of audio (2021) · cites this paper as Roberts, 2020
In the citing paper
“and the improvement in all metrics after normalization (Roberts and Paliwal, 2020)”
From An objective measure of quality for time-scale modification of audio (2021) · cites this paper as Roberts and Paliwal, 2020
In the citing paper
“Recently, a dataset of time-scaled audio with subjective labels was published for this purpose (Roberts, 2020).”
From An objective measure of quality for time-scale modification of audio (2021) · cites this paper as Roberts, 2020
In the citing paper
“20 time-scale ratios in the interval of 0.22 < β < 2.2 were used, resulting in 5,200 files with 400 files per method.”
From An objective measure of quality for time-scale modification of audio (2021) · cites this paper as Roberts, 2020
In the citing paper
“During subjective testing 42,529 ratings were collected from 263 participants in 633 sessions resulting in a minimum of 7 ratings per file.”
From An objective measure of quality for time-scale modification of audio (2021) · cites this paper as Roberts, 2020
1 more claim about this paper
Create a free account to see every claim other papers make about this one.
Self-check
Percentages, sums and reported differences re-computed from the paper’s own numbers.
Each contradiction between two passages listed here was confirmed by an independent check.
Rated minor: it would not touch a result — a value no result rests on, a p-value that stays on the same side of the significance level, or a conflict that is clerical, resolved elsewhere in the paper, or outside its own findings.
In the paper
§ A time-scale modification dataset with subjective quality > IV. SUBJECTIVE TESTING
“Testing followed ITU-R BS.1248-1 (ITU-T, 2019) recommendations for general methods for the subjective assessment of sound quality”
§ A time-scale modification dataset with subjective quality > References
“ITU-T (2019). "Itu-r bs. 1284-1: General methods for the subjective assess- ment of sound quality," Technical Report.”
Citations
Cites
Lakens, D. (2017) · Social Psychological and Personality Science · doi:10.1177/1948550617697177 · Cited by 2,161
Likert scales: how to (ab)use them
Jamieson, S. (2004) · Medical Education · doi:10.1111/j.1365-2929.2004.02012.x · Cited by 1,602
Pitch-synchronous waveform processing techniques for text-to-speech synthesis using diphones
Moulines, E., & Charpentier, F. (1990) · Speech Communication · doi:10.1016/0167-6393(90)90021-z · Cited by 1,244
Non-parametric techniques for pitch-scale and time-scale modification of speech
Moulines, É., & Laroche, J. (1995) · Speech Communication · doi:10.1016/0167-6393(94)00054-e · Cited by 289
Improved phase vocoder time-scale modification of audio
Laroche, J., & Dolson, M. (1999) · IEEE Transactions on Speech and Audio Processing · doi:10.1109/89.759041 · Cited by 276
Verhelst, W., & Roelands, M. (1993) · IEEE International Conference on Acoustics Speech and Signal Processing · doi:10.1109/icassp.1993.319366 · Cited by 217
Implementation of the digital phase vocoder using the fast Fourier transform
Portnoff, M. R. (1976) · IEEE Transactions on Acoustics Speech and Signal Processing · doi:10.1109/tassp.1976.1162810 · Cited by 209
Equivalence Tests: A Practical Primer for t-Tests, Correlations, and Meta-AnalysesPreprint
Lakens, D. (2016) · PsyArXiv (OSF Preprints) · doi:10.31234/osf.io/97gpc · Cited by 193
A new statistical procedure for testing equivalence in two-group comparative bioavailability trials
Hauck, W. W., & Anderson, S. (1984) · Journal of Pharmacokinetics and Biopharmaceutics · doi:10.1007/bf01063612 · Cited by 168
High quality time-scale modification for speech
Roucos, S., & Wilgus, A. (2005) · ICASSP '85. IEEE International Conference on Acoustics, Speech, and Signal Processing · doi:10.1109/icassp.1985.1168381 · Cited by 143
Cited by
An objective measure of quality for time-scale modification of audio
Roberts, T., & Paliwal, K. K. (2021) · The Journal of the Acoustical Society of America · doi:10.1121/10.0003753 · Cited by 2
Self-citationDeep Representation Decomposition for Rate-Invariant Speaker Verification
Tong, F., Zheng, S., Zhou, H., Xie, X., Hong, Q., & Li, L. (2022) · The Speaker and Language Recognition Workshop (Odyssey) · doi:10.21437/odyssey.2022-32 · Cited by 2
Design of Objective Quality Measures for Time-Scale Modification of Audio
Roberts, T. (2021) · Griffith Research Online · doi:10.25904/1912/4070
Self-citationAVBR-V2C: Low-Intrusion Zero-Shot Dubbing via Audio-Visual Bridging and Duration Retiming
Xie, Y., Mao, C., Wang, L., & Yu, Z. (2026) · International Joint Conference on Neural Networks (IJCNN) · doi:10.1109/ijcnn69854.2026.11729182
Metadata
- Authors
- Roberts, T., & Paliwal, K. K.
- Affiliations
- Griffith University (AU)
- Corresponding author
- Roberts, Timothy
- Venue
- The Journal of the Acoustical Society of America
- Publisher
- Acoustical Society of America (ASA)
- Published
- 2020-07-01
- Volume
- 148
- Issue
- 1
- Pages
- 201-210
- ISSN
- 0001-4966 (ISSN-L)
- 1520-8524
- OpenAlex
- W3032796415
- Cited by
- 4
- References
- 26
- Citations by year
- 2026: 1 · 2022: 1 · 2021: 2
- FWCI
- 0.40
- Type
- journal article
- Language
- en
- Open access
- hybrid
- doi.org
- Licence
- cc-by
- Locations
- The Journal of the Acoustical Society of America (publishedVersion, cc-by)
- PubMed (publishedVersion)
- arXiv (Cornell University) (submittedVersion, cc-by)
- Griffith Research Online (submittedVersion)
- arXiv (Cornell University)
- Topics
- Physical Sciences › Computer Science › Signal Processing › Speech and Audio Processing
- Physical Sciences › Computer Science › Signal Processing › Music and Audio Processing
- Physical Sciences › Computer Science › Computer Vision and Pattern Recognition › Image and Video Quality Assessment
- Keywords
- time-scale modification, subjective quality assessment, objective quality metrics, speech, sound effects, listener ratings, hearing loss, model retraining
About these checks
Registry, retraction, Cites and statistics results are computed, not judged, with one exception: a printed reference that no index lists is read once by a model before it counts as a citation error. Claims are extracted by a model and kept only when their quote appears verbatim in the text; each cited source is then checked, with a model’s help, for whether it says what the claim relies on. Those verdicts can be wrong — read the claim’s quote and the cited source before relying on one.
A language model drew the claims from the paper on 2026-11-14, under version 3 of the claim definition (model deepseek-v4.1-flash, prompt extract-v3).
A second model labelled each claim on 2026-11-14 (model jev-1.13-20260917, definition revision gold-guideline-v0.2).
Statistics and arithmetic are recomputed, not judged.
Confidence bands are shown only for fields calibrated on our annotated test set. None is calibrated yet, so no band is shown.
What counts as a claim ›How we measure confidence ›How we check this ›
Are you an author, or do you see a problem with this page? Request a review
How to cite
Cite CoChat for the checks on this page, and the paper for its own findings.
- This page
- CoChat. (2026). Citation check: A time-scale modification dataset with subjective quality labels. https://app.cochat.ai/papers/10.1121/10.0001567
- The paper
- Roberts, T., & Paliwal, K. K. (2020). A time-scale modification dataset with subjective quality labels. The Journal of the Acoustical Society of America. https://doi.org/10.1121/10.0001567
Data sources
Bibliographic data: Semantic Scholar, OpenAlex, Crossref.
Contains information from the Semantic Scholar Academic Graph Datasets, made available under the ODC Attribution License (ODC-BY 1.0).
Semantic Scholar’s data is described in: Kinney, R., et al. (2023). The Semantic Scholar Open Data Platform. arXiv:2301.10140.
