

On-chip dual-comb source for spectroscopy
Open accessThe DOI matches its Crossref record; 90 of the 90 references it cites were found in a registry or an index.
Abstract
A compact, integrated dual-comb source is developed on a single chip to demonstrate fast, real-time spectroscopy of materials.
Overview
The claims and statistics of this paper haven’t been checked yet.
Free: it reads the open-access text and checks the first 5 claims that cite a source we can check. Create a free account to check every claim.
Integrity signals
Registry
Cites
Statistics
Figures

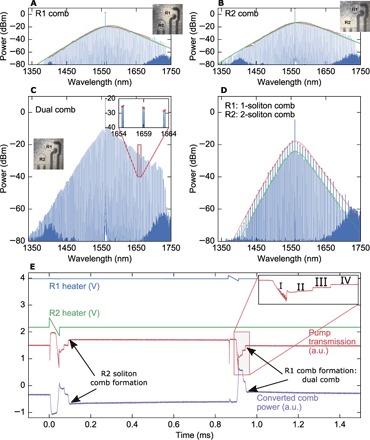

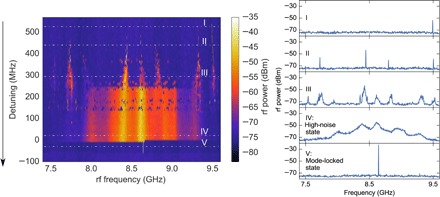

Verification
Claims the paper makes
The claims and statistics of this paper haven’t been checked yet.
Free: it reads the open-access text and checks the first 5 claims that cite a source we can check. Create a free account to check every claim.
Claims other papers make about this one
Each is checked against this paper’s own text: does it say what the citing paper says it does?
In the citing paper
“A residual (difference between the measured spectrum and the HITRAN database [253]) of 10% and a standard deviation of 3.4% was reported.”
From Integrated photonics on thin-film lithium niobate (2021) · cites this paper as [253]
Self-check
Percentages, sums and reported differences re-computed from the paper’s own numbers.
The self-check needs the paper’s full text.
Citations
Cites
Jones, D. J., Diddams, S. A., Ranka, J. K., Stentz, A., Windeler, R. S., Hall, J. L., & Cundiff, S. T. (2000) · Science · doi:10.1126/science.288.5466.635 · Cited by 2,661
Optical frequency comb generation from a monolithic microresonator
Del’Haye, P., Schliesser, A., Arcizet, O., Wilken, T., Holzwarth, R., & Kippenberg, T. J. (2007) · Nature · doi:10.1038/nature06401 · Cited by 2,290
Temporal solitons in optical microresonators
Herr, T., Brasch, V., Jost, J. D., Wang, C. Y., Kondratiev, N. M., Gorodetsky, M. L., & Kippenberg, T. J. (2014) · Nature Photonics · doi:10.1038/nphoton.2013.343 · Cited by 2,122 · cited 6×
“This is in contrast to what has been carried out in most previous experiments with Kerr combs, where the laser wavelength is tuned to a cavity mode of the microresonator (45).”
BackgroundResultInfluentialNew CMOS-compatible platforms based on silicon nitride and Hydex for nonlinear optics
Moss, D. J., Morandotti, R., Gaeta, A. L., & Lipson, M. (2013) · Nature Photonics · doi:10.1038/nphoton.2013.183 · Cited by 1,792 · cited 1×
“8 dB m) (36–39), high refractive index (~2), negligible nonlinear absorption in the near-IR, and compatibility with complementary metal-oxide semiconductor fabrication processes (40).”
BackgroundSelf-citationCoddington, I., Newbury, N., & Swann, W. (2016) · Optica · doi:10.1364/optica.3.000414 · Cited by 1,754
Microresonator-based solitons for massively parallel coherent optical communications
Marin-Palomo, P., Kemal, J. N., Karpov, M., Kordts, A., Pfeifle, J., Pfeiffer, M. H. P., Trocha, P., Wolf, S., Brasch, V., Anderson, M. H., et al. (2017) · Nature · doi:10.1038/nature22387 · Cited by 1,398 · cited 2×
“The dualcomb heterodyning technique inmicroresonators has also been used for massively parallel coherent detection for communications (8).”
BackgroundMethodDirect Link between Microwave and Optical Frequencies with a 300 THz Femtosecond Laser Comb
Diddams, S. A., Jones, D. J., Ye, J., Cundiff, S. T., Hall, J. L., Ranka, J. K., Windeler, R. S., Holzwarth, R., Udem, T., & Hänsch, T. W. (2000) · Physical Review Letters · doi:10.1103/physrevlett.84.5102 · Cited by 1,155
CMOS-compatible multiple-wavelength oscillator for on-chip optical interconnects
Levy, J. S., Gondarenko, A., Foster, M. A., Turner-Foster, A. C., Gaeta, A. L., & Lipson, M. (2010) · Nature Photonics · doi:10.1038/nphoton.2009.259 · Cited by 1,145
Self-citationColloquium: Femtosecond optical frequency combs
Cundiff, S. T., & Ye, J. (2003) · Reviews of Modern Physics · doi:10.1103/revmodphys.75.325 · Cited by 1,083
Microresonator soliton dual-comb spectroscopy
Suh, M.-G., Yang, Q.-F., Yang, K. Y., Yi, X., & Vahala, K. J. (2016) · Science · doi:10.1126/science.aah6516 · Cited by 991
Cited by
Items 401–465 of 465
Moss, D. (2021) · Research Square · doi:10.21203/rs.3.rs-1048646/v1
“It should also be noted that the two MRRs can be further integrated on the same chip, with the spectral interval tuned by employing separate thermo-optical micro-heaters [53].”
BackgroundZhang, D. (2021) · Deep Blue (University of Michigan) · doi:10.7302/2728
Moss, D. (2021) · SSRN Electronic Journal · doi:10.2139/ssrn.3935111
Solid-State Laser Technology for Frequency-Comb Spectroscopy
Picqué, N. (2021) · Optica Laser Congress (ASSL, LAC, LS&C) · doi:10.1364/assl.2021.atu3a.1
Spatial Multiplexing Cavity Solitons in a Monochromatically Driven Kerr Resonator
Pan, J., Huang, T., Wu, Z., & Shum, P. P. (2021) · IEEE Optoelectronics Global Conference (OGC) · doi:10.1109/ogc52961.2021.9654415
Orthogonally polarized RF single sideband generation with Kerr microcombsPreprint
Moss, D. (2020) · doi:10.36227/techrxiv.13102499
“Finally, the two MRRs can be easily be integrated onto the same chip, with the frequency difference tuned by separate on-chip thermal micro-heater controls [88].”
BackgroundMoss, D. (2021) · OSF Preprints (OSF Preprints) · doi:10.31219/osf.io/3xk4a
Dual-polarization frequency combs in a single Kerr microcavity via single-pumped mode-crossing
Bai, Q., Yang, J., Liu, H., Yu, M., Kwong, D.-L., Hou, D., & Wong, C. W. (2019) · Conference on Lasers and Electro-Optics · doi:10.1364/cleo_si.2019.sth4j.4
Neuromorphic photonic computing based on wavelength-division multiplexingPreprint
Moss, D. (2022) · OSF Preprints (OSF Preprints) · doi:10.31219/osf.io/5h9st
Hybrid dual-comb emission spectroscopy based on soliton microcomb
Zhang, C. (2022) · Optoelectronic devices and integration. Conference · doi:10.1117/12.2647940
Integrated Optical Frequency Microcomb ApplicationsPreprint
Moss, D. (2023) · Preprints.org · doi:10.20944/preprints202301.0016.v1
Applications for optical frequency microcomb chipsPreprint
Moss, D. (2023) · doi:10.36227/techrxiv.21818010
Applications for optical frequency microcomb chipsPreprint
Moss, D. (2023) · doi:10.36227/techrxiv.21818010.v1
Optical Data Communications Using Integrated Soliton Microcomb Laser Source
Xiao, Y., Geng, Y., Han, X., Hu, J., Qiu, K. L., & Zhou, H. (2022) · Asia Communications and Photonics Conference · doi:10.1109/acp55869.2022.10088770
Phase Noise of Kerr Soliton Dual Microcombs
Han, X., Geng, Y., Xiao, Y., QIAN, S., Qiu, K. L., & Zhou, H. (2022) · Asia Communications and Photonics Conference · doi:10.1109/acp55869.2022.10088716
Intracavity Pumped Tunable Low Threshold Mid-IR Kerr Comb at 2 μmPreprint
Pathak, K., & Pant, R. (2023) · doi:10.1364/opticaopen.22736693
Moss, D. (2023) · Research Square · doi:10.21203/rs.3.rs-3340230/v1
Alizadeh, M. R., Olyaee, S., & Seifouri, M. (2023) · Journal of Nonlinear Optical Physics & Materials · doi:10.1142/s0218863523500893
Wang, Z., Yang, C., & Bao, C. (2024) · Chinese Science Bulletin (Chinese Version) · doi:10.1360/tb-2023-1061
Integrated optical artificial intelligence chips based on wavelength-division multiplexingPreprint
Moss, D. (2024) · OSF Preprints (OSF Preprints) · doi:10.31219/osf.io/epa3z
Tetsumoto, T., Fujii, S., & Tanabe, T. (2024) · Elsevier eBooks · doi:10.1016/b978-0-323-91765-0.00006-2
Multi-colour frequency combs in the Kerr microresonators
Weng, H., Kumar, V., Tu, H., Lu, Q., Guo, W., Skryabin, D. V., & Donegan, J. F. (2024) · International Conference on Transparent Optical Networks · doi:10.1109/icton62926.2024.10647246
Silicon Nitride Microring Resonator for Optical Frequency Comb Generation in Normal Dispersion
Nazneen, R., & Liboiron-Ladouceur, O. (2024) · OSA Advanced Photonics Congress · doi:10.1364/iprsn.2024.itu3b.2
Impact of U-shaped waveguide structures on optical comb generation in microresonator systems
Chen, K., Chen, S., Li, W., Feng, L., & Li, Y. (2024) · Journal of the Optical Society of America B · doi:10.1364/josab.535368
Response of a Multi-Wavelength Laser to Single-Sideband Optical Injection
Abdollahi, S., Marin-Palomo, P., & Virte, M. (2024) · Journal of Lightwave Technology · doi:10.1109/jlt.2024.3502901
“Thiskey capabilityopensthehorizonofapplicationstovariousdomains rangingfromspectroscopytoopticalcommunications[17],[18], [19].”
Advancing Molecular Spectroscopy Efficiency with Extensive Parallelism
Li, J., Fernandez, R. N., Gutierrez, B., Pedersen, J. B., & Zhou, Y. (2024) · Metrology · doi:10.3390/metrology4040043 · Cited by 1
A high-resolution microresonator-frequency-comb spectrometerPreprint
Zhao, R., Yang, B., Huang, C., Li, J., Shi, B., Sun, W., Shen, C., Wang, C., Chen, T., Chen, L., et al. (2025) · arXiv (Cornell University) · doi:10.48550/arxiv.2502.02878
Performing MHz-Level Repetition Rate Tuning for Coherent Dual-Microcomb Interferometry
Yan, E., Peng, M., Tang, J., Huang, J., Tian, D., Liu, S., Meng, Z., Li, X., Zhu, L., Yan, S., et al. (2025) · Micromachines · doi:10.3390/mi16040448
“The resulting SMCs share the optical phase of the seed laser, forming a compact, coherent dual-comb source [17,18].”
Wan, Z., Cen, Q., Xu, K., Li, M., & Dai, Y. (2025) · Optics Express · doi:10.1364/oe.563993
Bai, X., Ye, Y., Zhang, F. M., Li, H., Shi, J., Liu, X., Wang, J., & Liu, Q. (2025) · Journal of Applied Physics · doi:10.1063/5.0284581
Soliton dual-comb in a single cavity birefringent fiber laser for vibration signal measurement
Li, Y., Dang, L., Zhu, W., Li, F., & Huang, D. (2025) · Conference on Lasers and Electro-Optics · doi:10.1364/cleo_at.2025.jps200_60
“Dual comb measurement greatly reduces the detection bandwidth and the response speed [1,2].”
Frequency-Pair Correlations in Kerr-Frequency Combs
Khrizman, K., Diakonov, A., Zano, E., & Stern, L. (2025) · Conference on Lasers and Electro-Optics · doi:10.1364/cleo_si.2025.ss185_7
Salcedo, A. F. C., González, N. G., Jaramillo-Villegas, J. A., & Marinov, M. B. (2025) · International Scientific Conference Electronics (ET) · doi:10.1109/et66806.2025.11204047
“To overcome these limitations, integrated photonics offers a versatile platform for miniaturizing optical components on a chip, enabling light guiding, modulation, filtering, and detection within stable, reproducible, and CMOS-compatible systems [5].”
Zhu, G., Yan, X., Tian, M., Qin, F., Li, X., Yang, D., Wang, Z., Shen, K., Kou, J.-L., & Cai, Z. (2025) · Europhysics Letters (EPL) · doi:10.1209/0295-5075/ae253a
Dessureault, É. (2024) · PolyPublie (École Polytechnique de Montréal)
Spatiotemporal Kerr cavity solitons in two-mode fiber resonatorsPreprint
Shi, Z., He, J., Wang, Q., Cao, X., Liu, Y., Wang, Z., Liu, Y. M., & Wang, P. (2026) · SSRN Electronic Journal · doi:10.2139/ssrn.6115039
Kerr-enhanced amplification of three-wave mixing and emergent masing regimesPreprint
Alhyder, R., Sahu, R., Fink, J. M., Lemeshko, M., & Koutentakis, G. M. (2026) · arXiv (Cornell University) · doi:10.48550/arxiv.2601.14726
Photonic integrated circuits for dual-comb interferometry
López-Querol, P. (2026) · UPM Digital Archive (Technical University of Madrid) · doi:10.20868/upm.thesis.94006
Dynamics of spatiotemporal Kerr solitons in two-mode fiber resonatorsPreprint
Shi, Z., He, J., Wang, Q., Cao, X., Liu, Y., Wang, Z., Liu, Y. M., & Wang, P. (2026) · SSRN Electronic Journal · doi:10.2139/ssrn.6386952
Zhou, Y., Yunxin, W. A. N. G., Zhang, J., Wang, D., & Zhang, Y. (2026) · IEEE photonics journal · doi:10.1109/jphot.2026.3675296 · Cited by 1
“Kerr microcavityisanotherschemeforOFCgeneration[21],[22], [23],[24].”
Oudin, J. (2020) · theses.fr (ABES) · doi:10.70675/28f1b3c9ze222z4e46zb48az8520658e219a · Cited by 1
Génération de peignes de fréquences par modulation électro-optique et applications
Parriaux, A. (2020) · theses.fr (ABES) · doi:10.70675/a9b4d3b8z365bz4afezbed5z62718d241370 · Cited by 2
Deniel, L. (2021) · theses.fr (ABES) · doi:10.70675/3892ba19z390dz45cdzbe9ez09f66bacf6fc · Cited by 2
Generation of triple frequency combs in multi-core fibres for multidimensional spectroscopy
Bancel, E.-L. (2023) · theses.fr (ABES) · doi:10.70675/99a51d66z6c84z44fazbf92z7725b2ad205d
Optical frequency comb generation in fiber Fabry-Perot resonators
Bunel, T. (2024) · theses.fr (ABES) · doi:10.70675/d6e978b3za838z4093z86a6z94861cb95bd5
Signatures of rare-earth elements in mineralogical form using laser-ablation dual-comb spectroscopy
Höfer, C., Bowman, E., Jarymowycz, A., McCauley, J. J., Tooley, D. P., Dannar, H., Wong, A., Pang, I., Mills, A. K., Phillips, M. C., et al. (2026) · Spectrochimica Acta Part B Atomic Spectroscopy · doi:10.1016/j.sab.2026.107648
“Recent demonstrations have also shown the capability of dual-comb sensors to be field-deployed and miniaturized [40, 41, 42].”
On-chip solitons are gaining new colors
Moille, G. T., Srinivasan, K. A., & Chembo, Y. K. (2026) · Light Science & Applications · doi:10.1038/s41377-026-02313-6
Self-heterodyne spectroscopy via a non-uniformly spaced frequency comb
Zhang, B., Zhao, G., Zhou, X., Yan, X., Yang, J., Ma, W., & Jia, S. (2026) · Nature Communications · doi:10.1038/s41467-026-73261-3
Wu, W., Huang, D., Xu, J., Li, F., & Wai, P. (2026) · IEEE photonics journal · doi:10.1109/jphot.2026.3694537
“ultrafast ranging, and low-noise microwave generation [9], [10], [11], [12], [13].”
Silicon nitride sensors for VIS-NIR based on subwavelength and slot-waveguide ring resonators
Lelit, M., Drecka, D., Kozłowski, Ł., Slowikowski, M., Stonio, B., Juchniewicz, M., Filipiak, M., Michalak, B., Jarosik, M., Stopiński, S., et al. (2026) · Optical and Photonic Microsystems: Technology and Applications · doi:10.1117/12.3100239
“Beyond biomedical applications, these robust SiN PICs are actively replacing bulky benchtop spectrometers in heavy industry, enabling continuous trace gas monitoring [37] and structural health monitoring in harsh environments [38].”
Flat Electro-Optic Frequency Comb Generation Based on a Single-Drive Asymmetric Modulator
Sun, Y., Yao, H., Deng, J., Zhang, H., Ma, X., Wang, M., Wu, J., & Chen, K. (2026) · Journal of Lightwave Technology · doi:10.1109/jlt.2026.3706978
Absorption spectroscopy based on PICs
Hu, J., Spott, A., & Agarwal, A. (2026) · Elsevier eBooks · doi:10.1016/b978-0-443-26578-5.00002-9
Waveguide platforms for mid-wave IR sensing
Marris‐Morini, D., Bodiou, L., Kurdi, M. E., Turpaud, V., Dely, H., Bricout, A., Bouchiki, N. E., Huertas-Pedroche, J., Alonso‐Ramos, C., Buca, D., et al. (2026) · Elsevier eBooks · doi:10.1016/b978-0-443-26578-5.00007-8
Magnetic frequency comb excited by magnetoacoustic coupling in ferromagnetic films
Zhi, Y. A. N. G., Changjiang, L. I. U., Yao, Y., & ZHANG, Y. (2026) · Acta Physica Sinica · doi:10.7498/aps.75.20260087
Manipulation of temporal cavity solitons in pulsed-driving Kerr fiber resonators
Anonymous, Ren, Z., Yu, B., & Wang, Z. (2026) · Physical Review A · doi:10.1103/4hf5-r4nc
Zeping, 王. W., Qi, 国. G., Yu, 谭. T., Yiyang, 顾. G., Hongrun, 任. R., Yong, 耿. G., Bing, 常. C., Teng, 谭. T., & Baicheng, 姚. Y. (2026) · Acta Optica Sinica (Online) · doi:10.3788/aosol260492
Dissipative Kerr soliton self-balancing from Kerr-induced synchronization
Anonymous, Srinivasan, K. A., Menyuk, C. R., & Moille, G. T. (2026) · Physical Review A · doi:10.1103/921d-nf7h
“…frequency combs based on dissipative Kerr soli-tons (DKSs) in microresonators have emerged as low power [1], mass-scale fabrication compatible [2, 3], and versatile coherent light sources for metrology [4, 5], communications [6], spectroscopy [7], distance ranging [8], and other applications.”
Integrated optical frequency comb and its applications from classical to quantum information
Cui, W., Geng, Y., Chen, Z., Cui, H., Wu, Z., Zhang, D., Zhou, H., Baicheng, 姚. Y., Zhang, Q., Shen, S., et al. (2026) · Photonics Insights · doi:10.3788/pi.2026.r13
“…preceding sections, DKS OFCs demonstrate immense application prospects across domains ranging from high-capacity fiber transmission [54,64,109] and ultrastable microwave sources [54,110] to photonic frequency synthesizers [25,54] and precision laser metrology and spectroscopy [26,28,51,54,89,111] .”
High-Precision Ranging based on an Interferometric Time-InterleavedSingle Gain-Switched Dual CombPreprint
Monroy, L., Rosado, A., de Dios, C., & Anandarajah, P. M. (2026) · SSRN Electronic Journal · doi:10.2139/ssrn.7593266
Ultrafast Surface Plasmon Resonance Sensing via Dual‐Comb Spectroscopy
Liu, X., He, S., Gu, C., Zeng, Y., Zhang, M., Li, X., Wang, S., Liu, C., Deng, Z., Zhu, Z., et al. (2026) · Laser & Photonics Review · doi:10.1002/lpor.72122
Miao, R., Yin, K., Zhang, C., Yu, Z., Cheng, X., & Jiang, T. (2022) · doi:10.3389/fphy.2022.989047.s001
Metadata
- Authors
- Dutt, A., Joshi, C., Ji, X., Cardenas, J., Okawachi, Y., Luke, K., Gaeta, A. L., & Lipson, M.
- Affiliations
- Cornell University (US)
- Department of Electrical Engineering, Columbia University, New York, NY 10027, USA.
- Columbia University (US)
- Corresponding author
- Dutt, Avik
- Lipson, Michal
- ORCID
- Venue
- Science Advances
- Published
- 2018-03-02
- Volume
- 4
- Issue
- 3
- Pages
- e1701858-e1701858
- ISSN
- 2375-2548 (ISSN-L)
- PMC
- PMC5834308
- OpenAlex
- W2555239793
- Cited by
- 453
- References
- 88
- Citations by year
- 2026: 32 · 2025: 47 · 2024: 50 · 2023: 59 · 2022: 54 · 2021: 63 · 2020: 61 · 2019: 55 · 2018: 24
- FWCI
- 23.46
- Type
- journal article
- Language
- en
- Open access
- gold
- doi.org
- Licence
- cc-by-nc
- Locations
- Science Advances (publishedVersion, cc-by-nc)
- PubMed Central (publishedVersion, cc-by-nc)
- PubMed (publishedVersion)
- arXiv (Cornell University) (submittedVersion)
- arXiv (Cornell University)
- Columbia Academic Commons (Columbia University)
- Funders
- Air Force Office of Scientific Research (FA9550-15-1-0303)
- Defense Advanced Research Projects Agency (N66001- 16-1-4052, W31P4Q-15-1-0015)
- Cornell Center for Materials Research (DMR-1120296)
- National Nanotechnology Coordinated Infrastructure (ECCS-1542081)
- Topics
- Physical Sciences › Physics and Astronomy › Atomic and Molecular Physics, and Optics › Advanced Fiber Laser Technologies
- Physical Sciences › Chemistry › Spectroscopy › Spectroscopy and Laser Applications
- Physical Sciences › Engineering › Electrical and Electronic Engineering › Semiconductor Lasers and Optical Devices
- Keywords
- dual-comb spectroscopy, microresonator frequency combs, soliton mode-locking, absorption spectroscopy, compact spectrometer
About these checks
Registry, retraction, Cites and statistics results are computed, not judged, with one exception: a printed reference that no index lists is read once by a model before it counts as a citation error. Claims are extracted by a model and kept only when their quote appears verbatim in the text; each cited source is then checked, with a model’s help, for whether it says what the claim relies on. Those verdicts can be wrong — read the claim’s quote and the cited source before relying on one.
Statistics and arithmetic are recomputed, not judged.
Confidence bands are shown only for fields calibrated on our annotated test set. None is calibrated yet, so no band is shown.
What counts as a claim ›How we measure confidence ›How we check this ›
Are you an author, or do you see a problem with this page? Request a review
Data sources
Bibliographic data: Semantic Scholar, OpenAlex, Crossref.
Contains information from the Semantic Scholar Academic Graph Datasets, made available under the ODC Attribution License (ODC-BY 1.0).
Semantic Scholar’s data is described in: Kinney, R., et al. (2023). The Semantic Scholar Open Data Platform. arXiv:2301.10140.
