

The DOI matches its Crossref record; 66 of the 66 references it cites were found in a registry or an index; 12 of the 38 sources its claims cite were checked for support.
Learning skillful medium-range global weather forecasting
Open accessAbstract
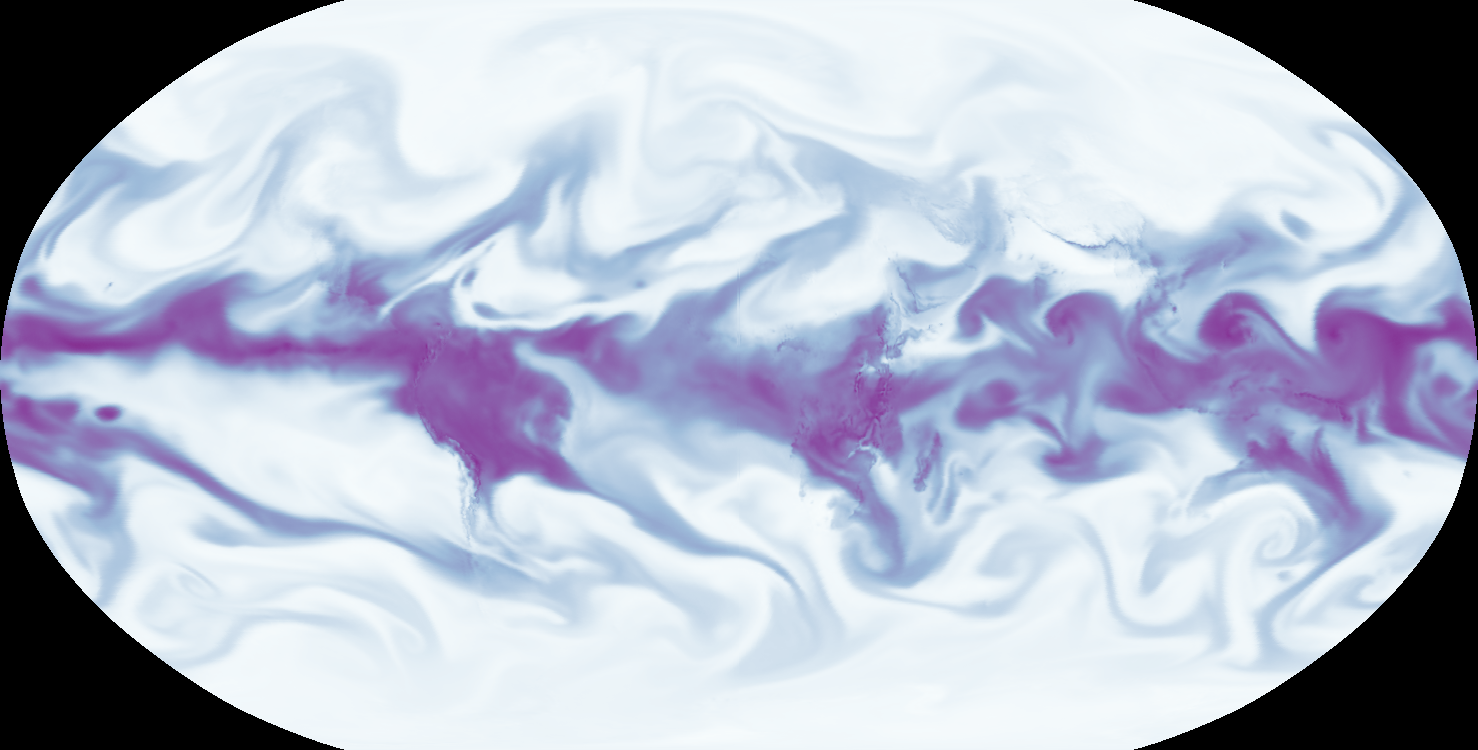
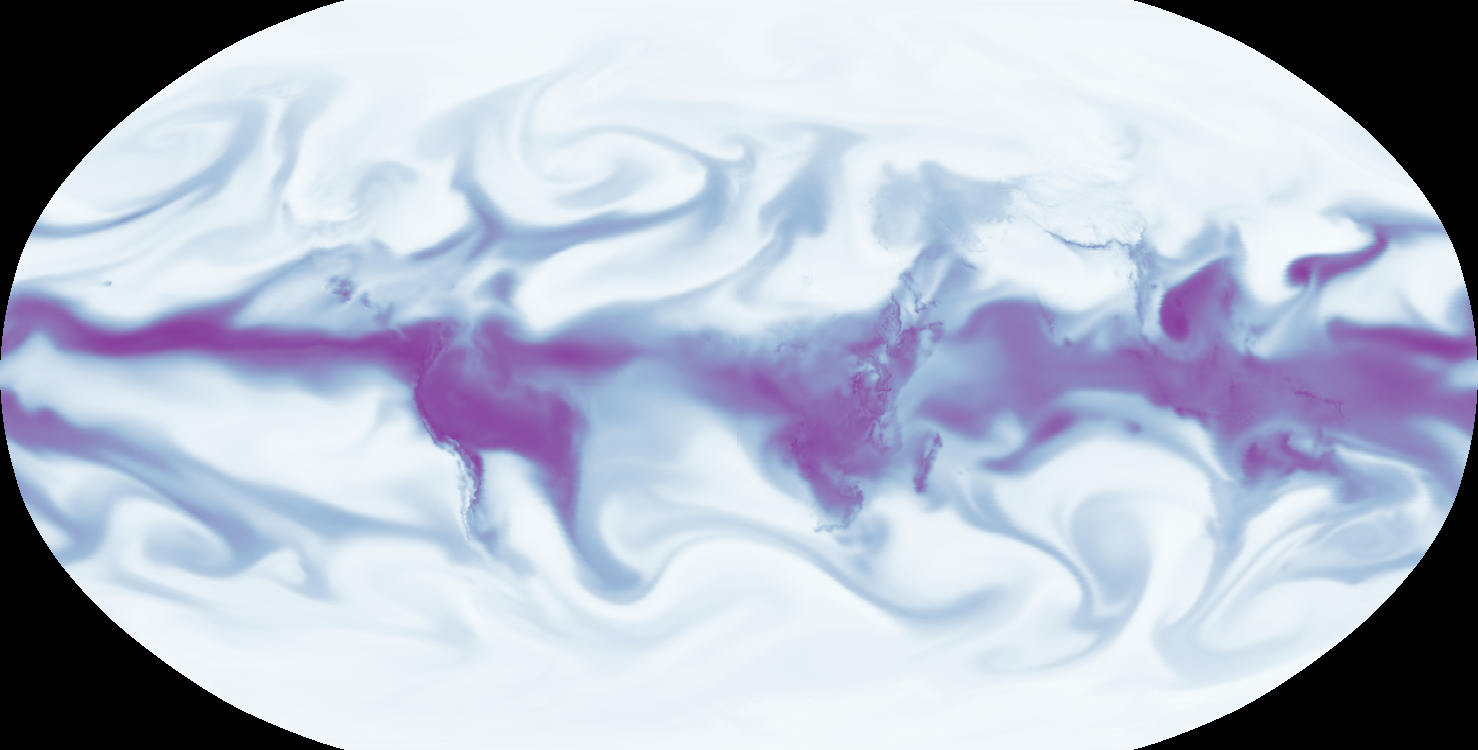
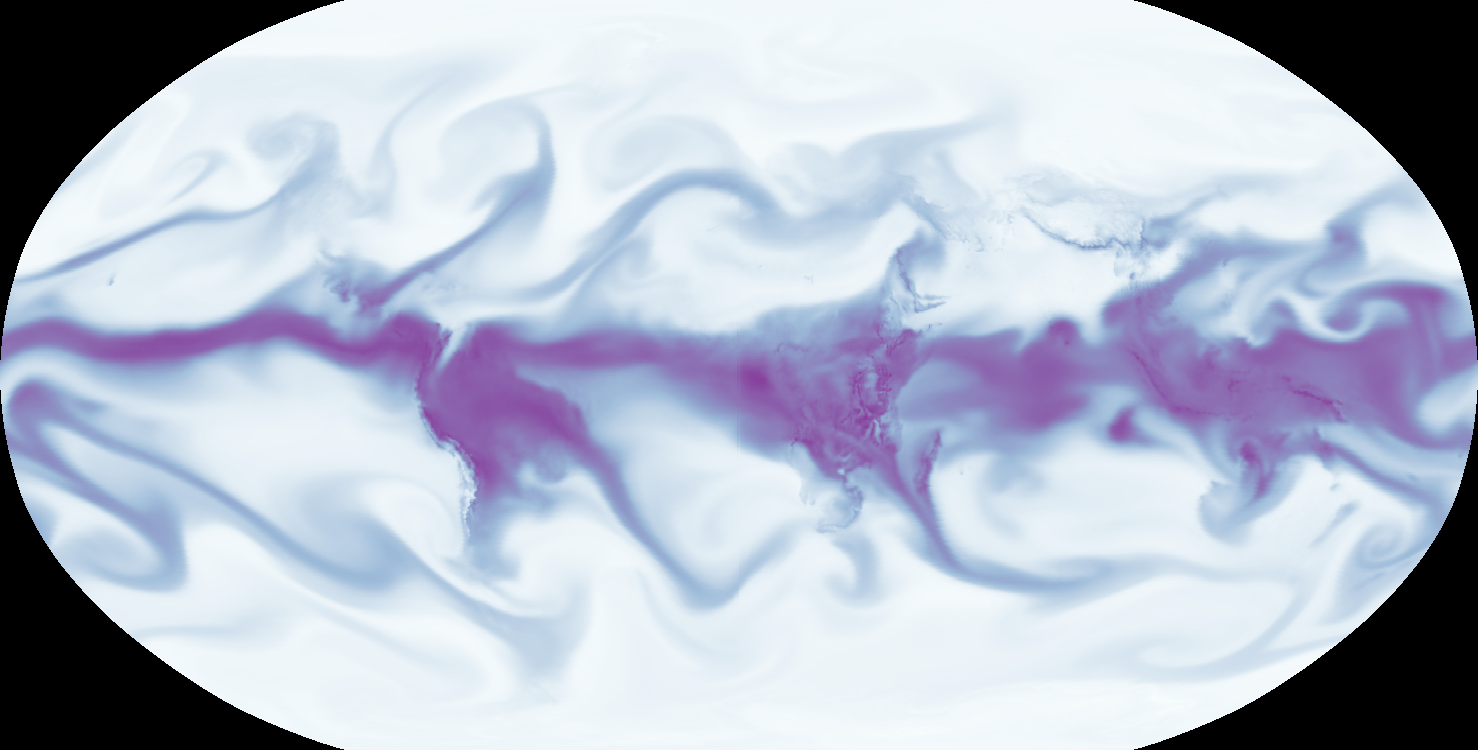
Global medium-range weather forecasting is critical to decision-making across many social and economic domains. Traditional numerical weather prediction uses increased compute resources to improve forecast accuracy but does not directly use historical weather data to improve the underlying model. Here, we introduce GraphCast, a machine learning–based method trained directly from reanalysis data. It predicts hundreds of weather variables for the next 10 days at 0.25° resolution globally in under 1 minute. GraphCast significantly outperforms the most accurate operational deterministic systems on 90% of 1380 verification targets, and its forecasts support better severe event prediction, including tropical cyclone tracking, atmospheric rivers, and extreme temperatures. GraphCast is a key advance in accurate and efficient weather forecasting and helps realize the promise of machine learning for modeling complex dynamical systems.
Overview
CoChat Summary
TL;DR
GraphCast is a graph neural network trained directly on ERA5 reanalysis that produces 10-day global weather forecasts at 0.25° resolution in under one minute. It outperforms the operational HRES deterministic system on most evaluated targets and supports better prediction of tropical cyclones, atmospheric rivers, and extreme temperatures.
Key findings
- GraphCast significantly outperformed HRES on 90.3% of 1380 verification targets, and significantly on 89.9% of targets; excluding 50 hPa it significantly outperformed HRES on 96.9% of 1280 targets, and excluding 50 and 100 hPa on 99.7% of 1180 targets.
- On z500, GraphCast had better skill across all lead times, with skill score improvement around 7%–14%; it also outperformed Pangu-Weather on 99.2% of the 252 targets Pangu-Weather presented.
- For severe events, GraphCast had lower median cyclone track error and was significantly better than HRES for lead times 18 hours to 4.75 days; it improved atmospheric river ivt prediction from 25% at short lead time to 10% at longer horizons; extreme heat precision-recall curves were above HRES at 5- and 10-day lead times, while HRES was better at 12 hours.
- Training on more recent data improved GraphCast’s skill scores, with variants trained up to before 2021 generally outperforming earlier-trained variants on 2021 test data.
Methods
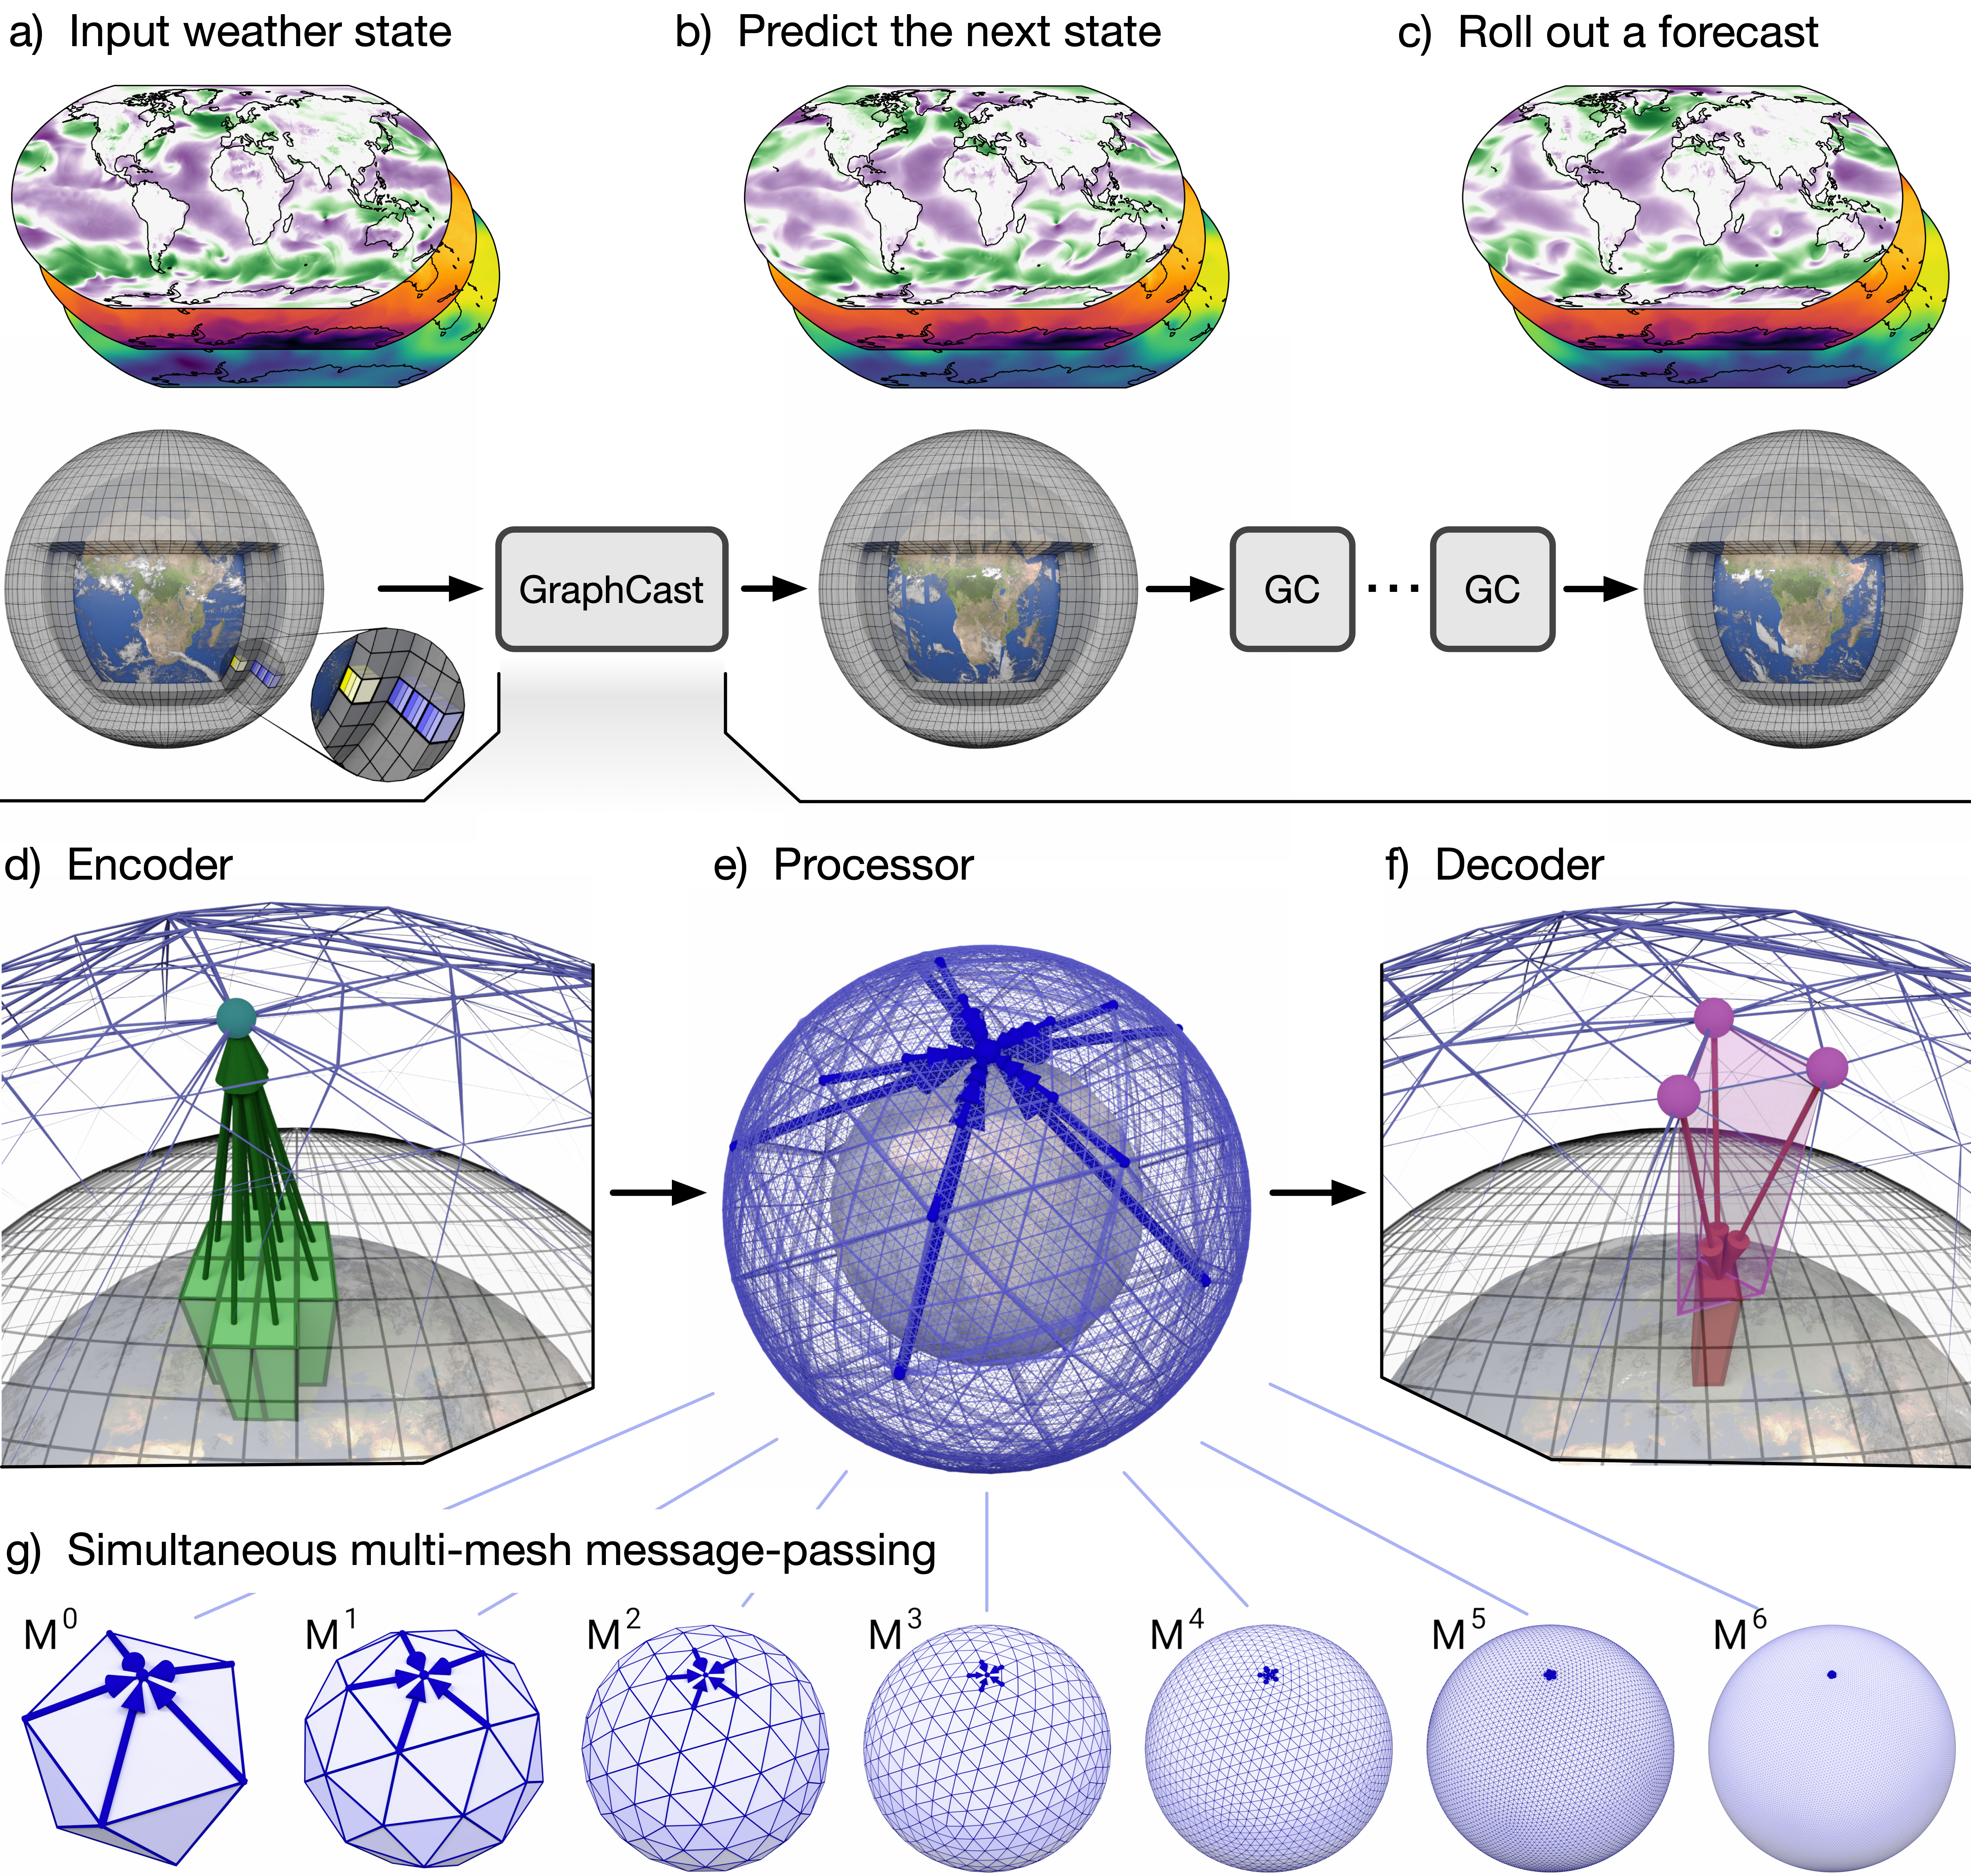
- GraphCast is a 36.7-million-parameter graph neural network in an encode-process-decode configuration, using a multi-mesh icosahedral representation with 40,962 nodes and 327,660 mesh edges; it takes two most recent weather states and predicts the next 6-hour state autoregressively.
- It was trained on 39 years (1979–2017) of ERA5 reanalysis, using a weighted MSE objective over 12 autoregressive steps, with training taking roughly four weeks on 32 Cloud TPU v4 devices; evaluation used held-out 2018 data, with some analyses on 2018–2021 and 2021.
- Forecast skill was evaluated against HRES using RMSE and ACC, with HRES-fc0 as HRES ground truth and ERA5 as GraphCast ground truth; comparisons used 06z/18z initializations and 12-hour target intervals to match data assimilation lookahead.
Limitations
- The paper states that GraphCast is deterministic and does not explicitly model uncertainty like ECMWF’s ensemble system ENS; its MSE training objective encourages spatial blurring, which may limit value for some applications.
- The paper states GraphCast operates at 0.25° resolution, 37 vertical levels, and 6-hour time steps, versus HRES at 0.1°, 137 levels, and up to 1-hour time steps, and that it depends critically on large quantities of high-quality data assimilated via NWP, so it should not be regarded as a replacement for traditional weather forecasting.
- The paper reports reduced skill in the stratosphere, especially at 50 hPa, and at high surface elevations; it also notes possible ERA5 versus HRES-fc0 domain differences and spurious spectral artifacts around 100 km wavelengths.
Model-written summary. Check it against the paper before relying on it.
Integrity signals
Registry
Cites
Statistics
Figures
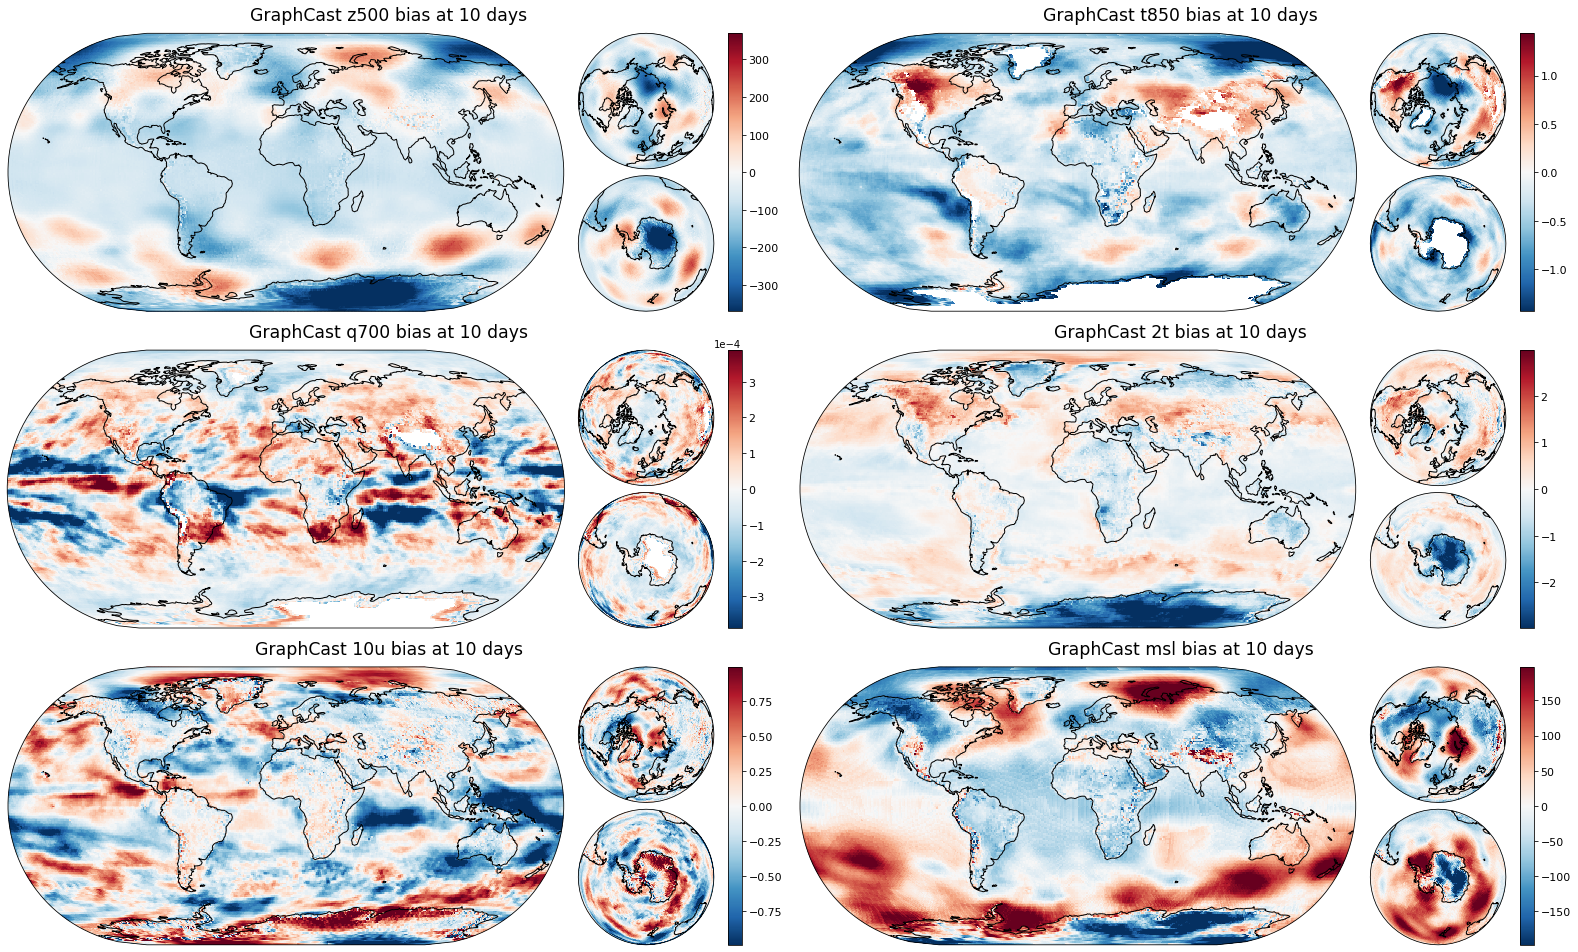
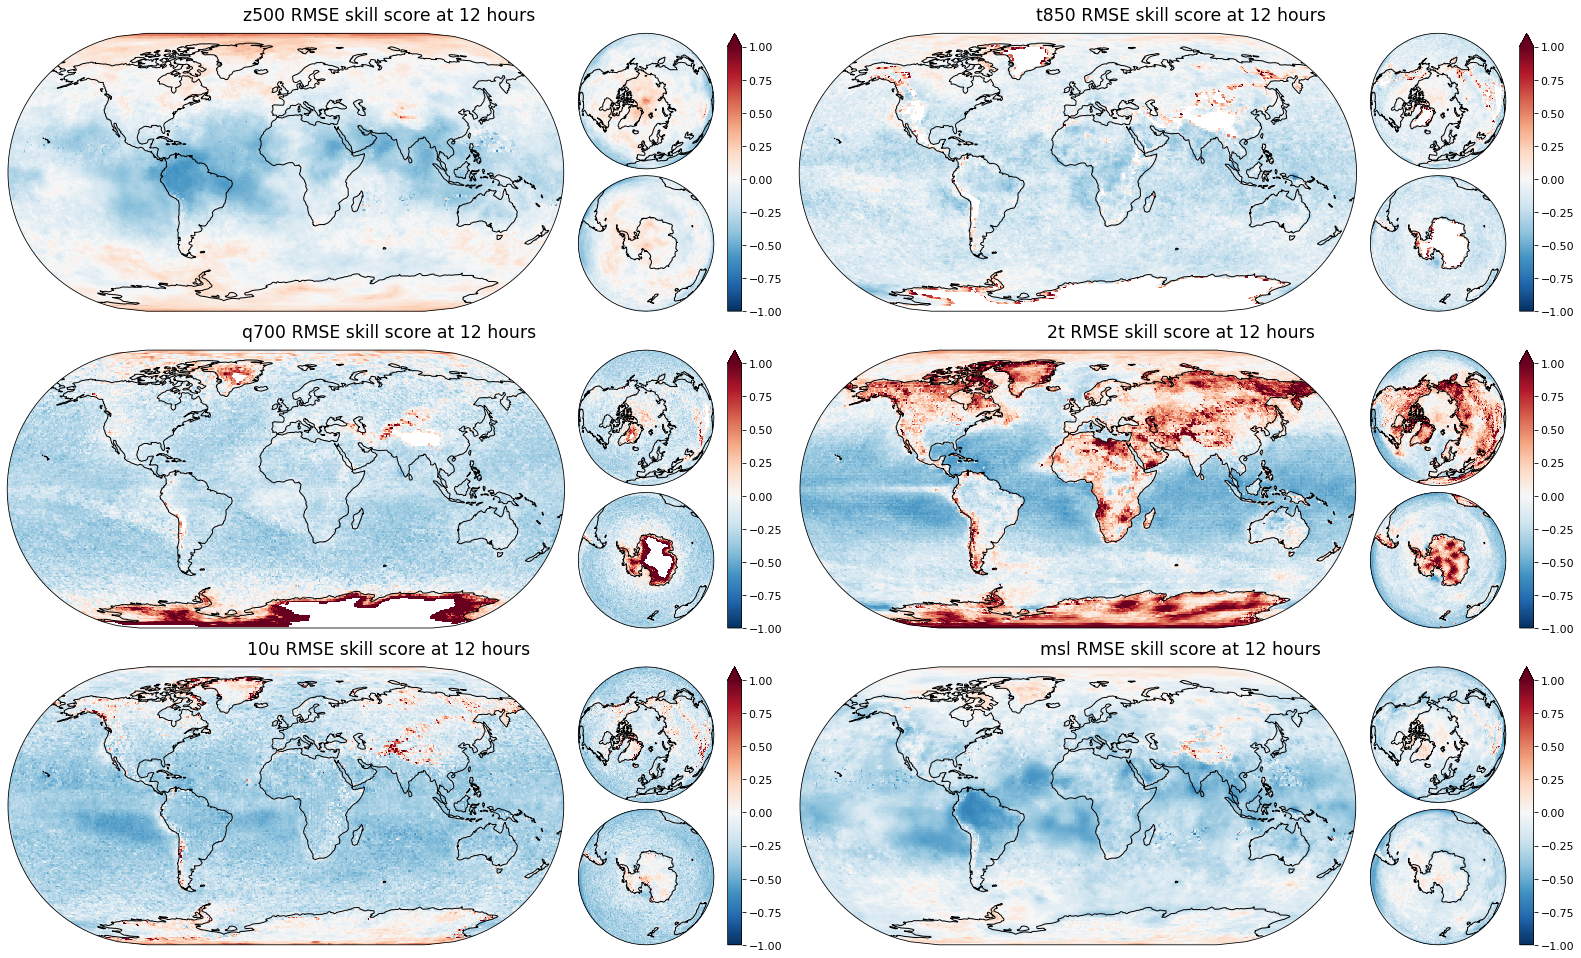
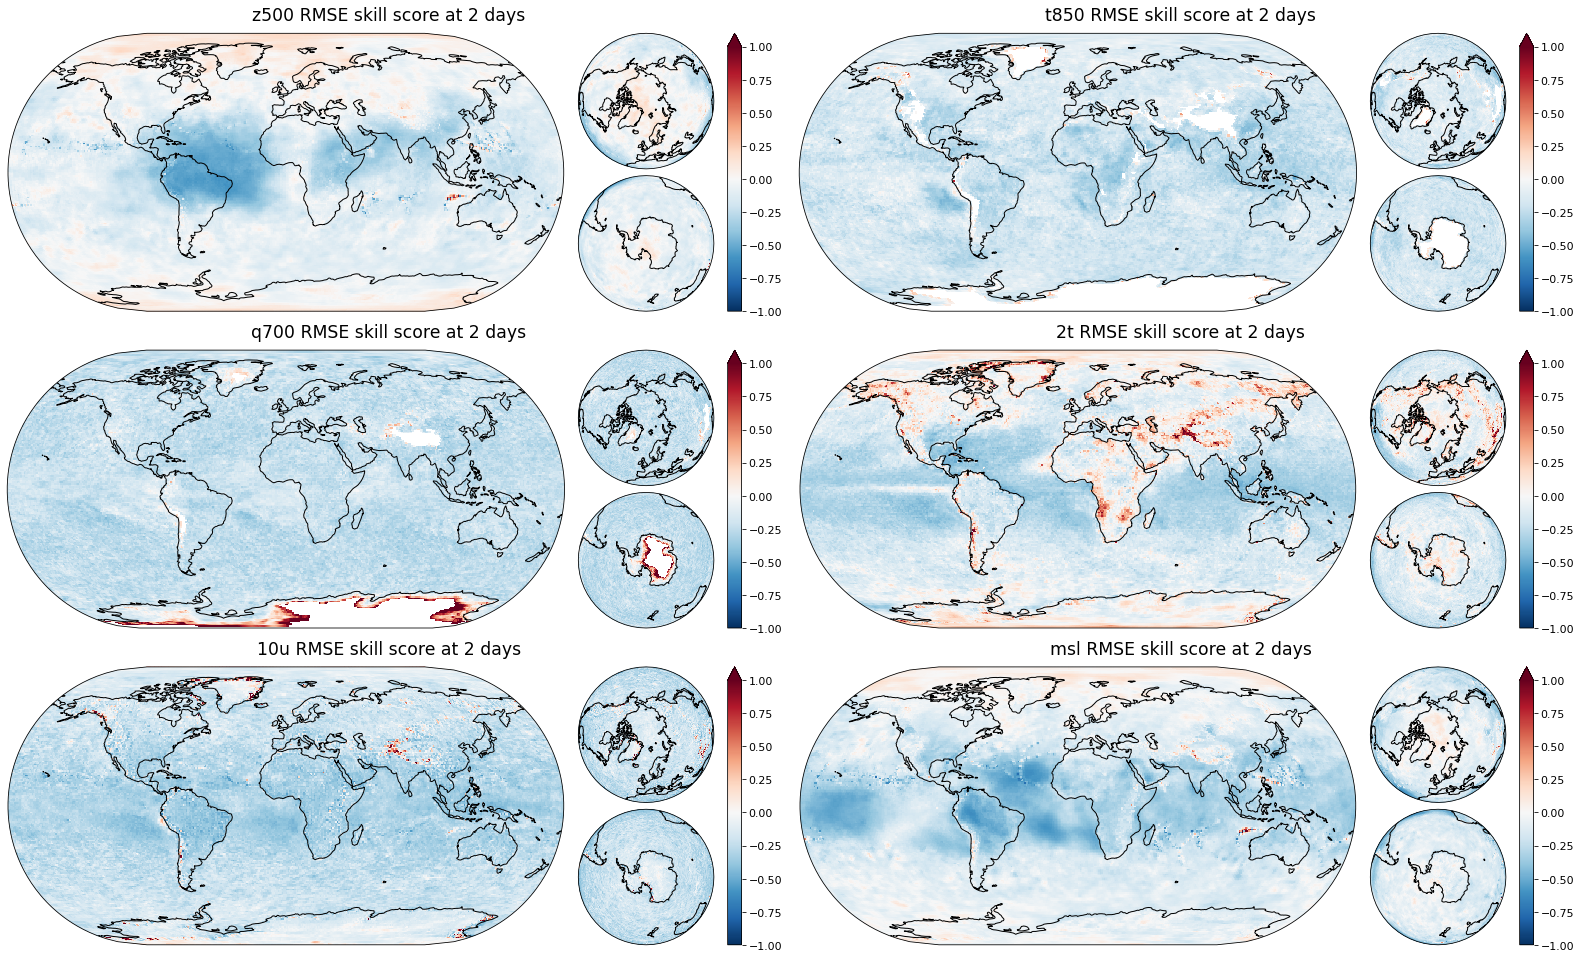
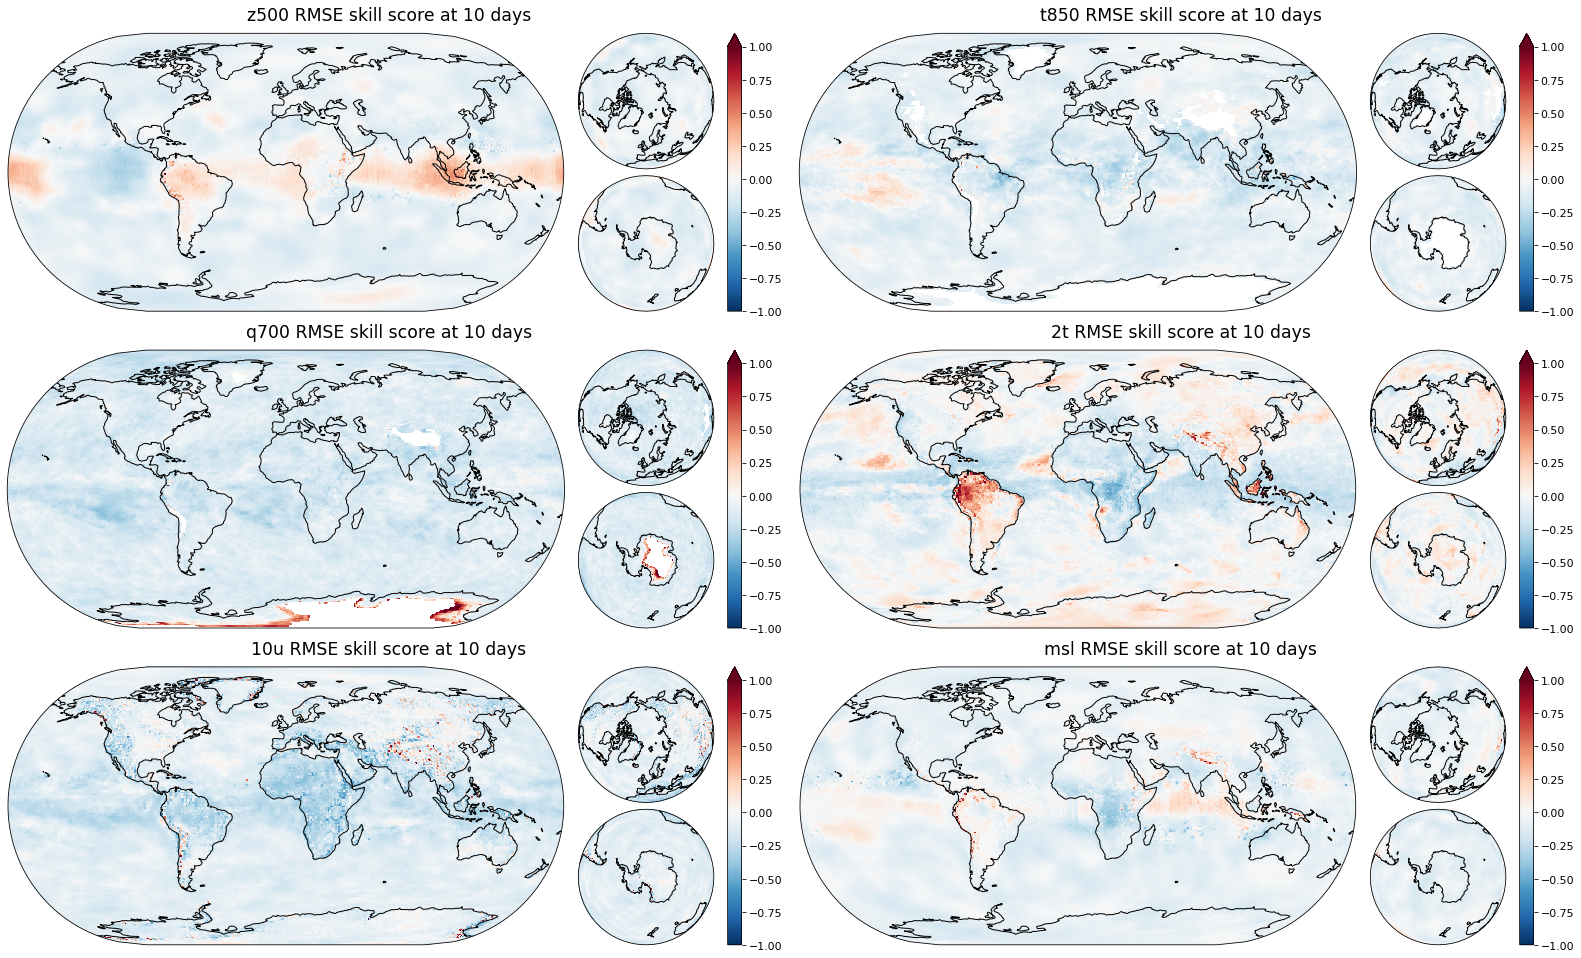
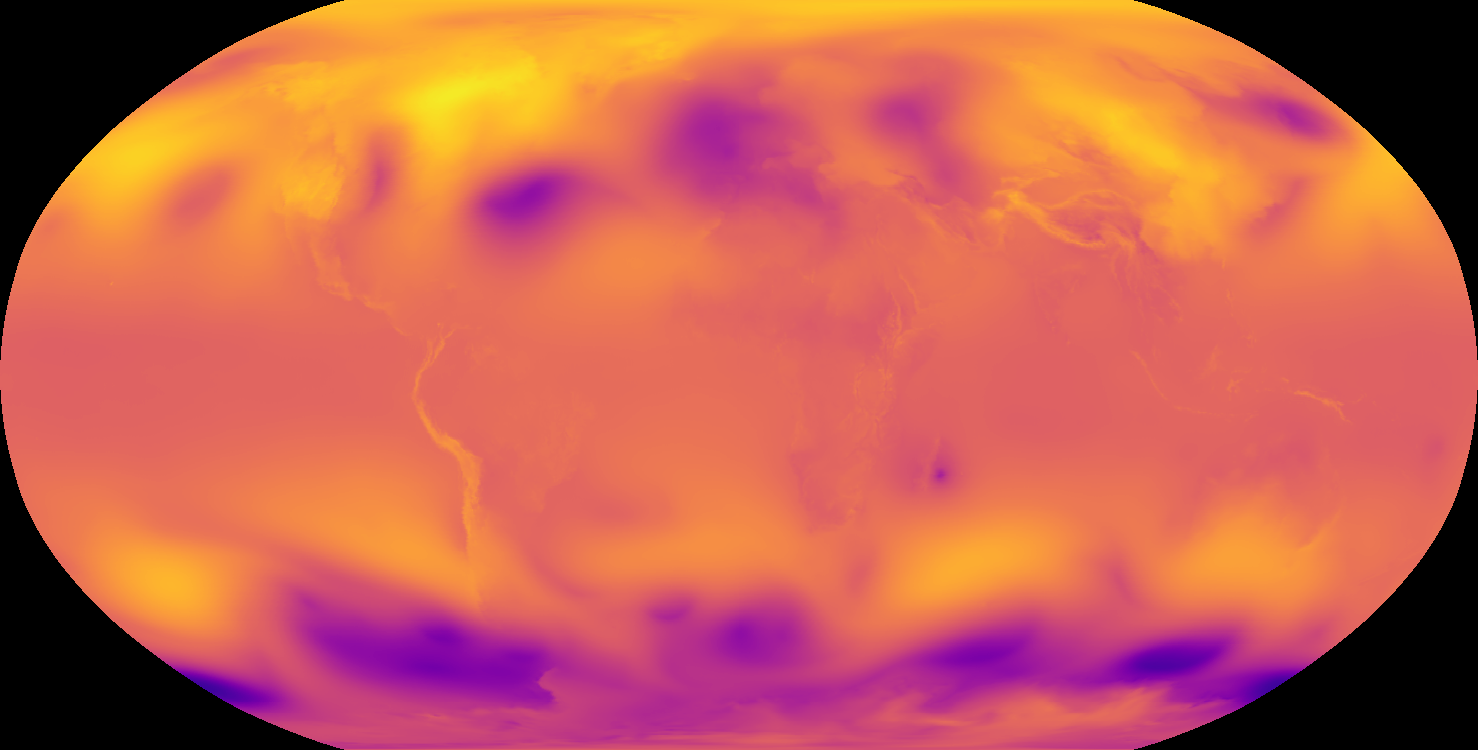
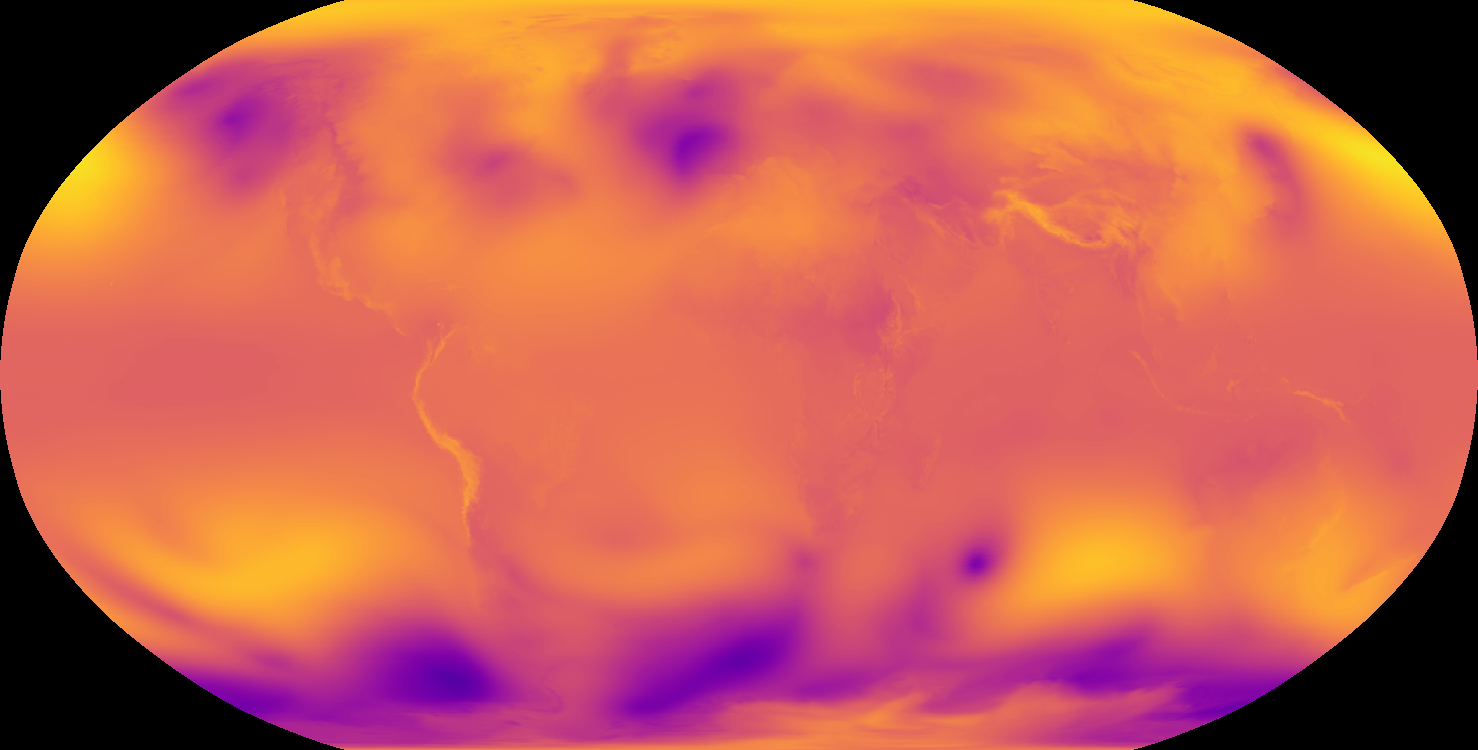
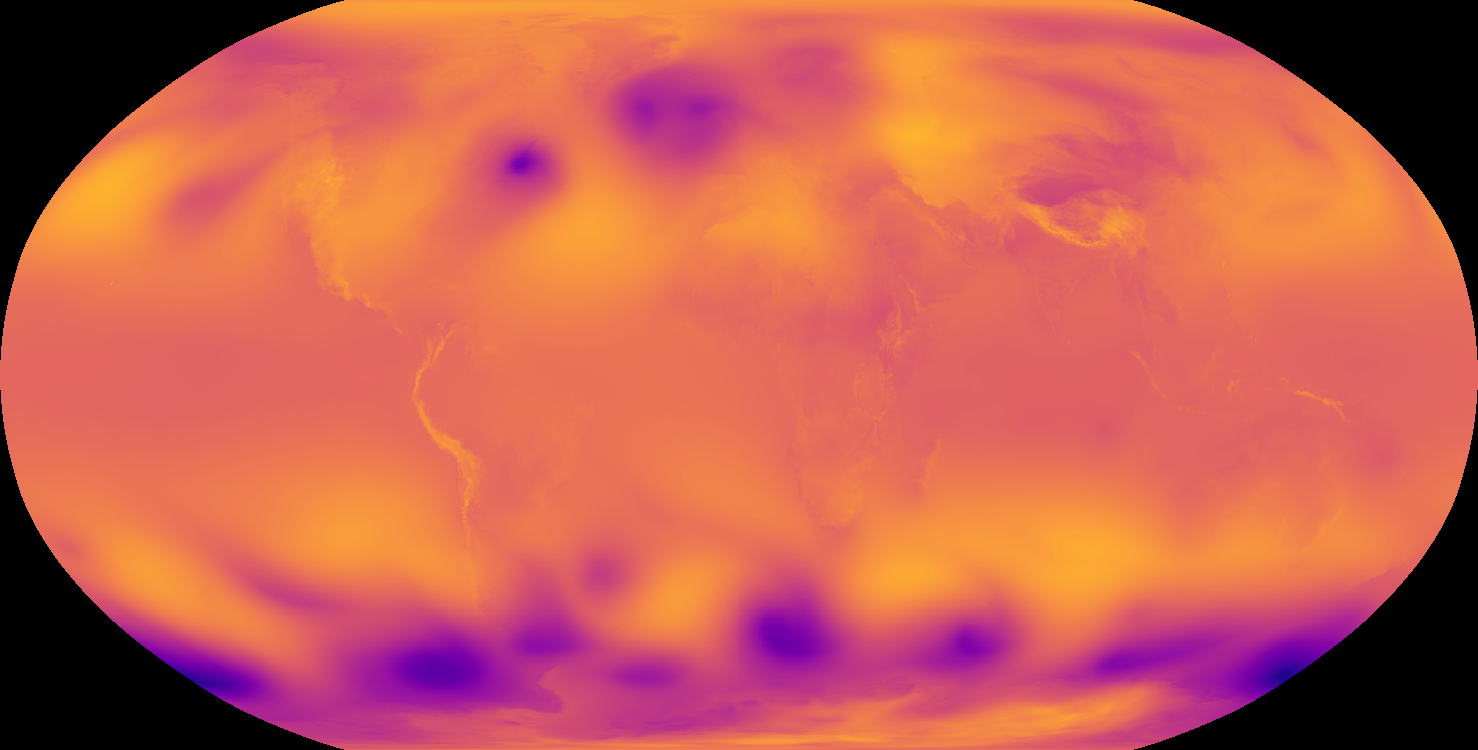
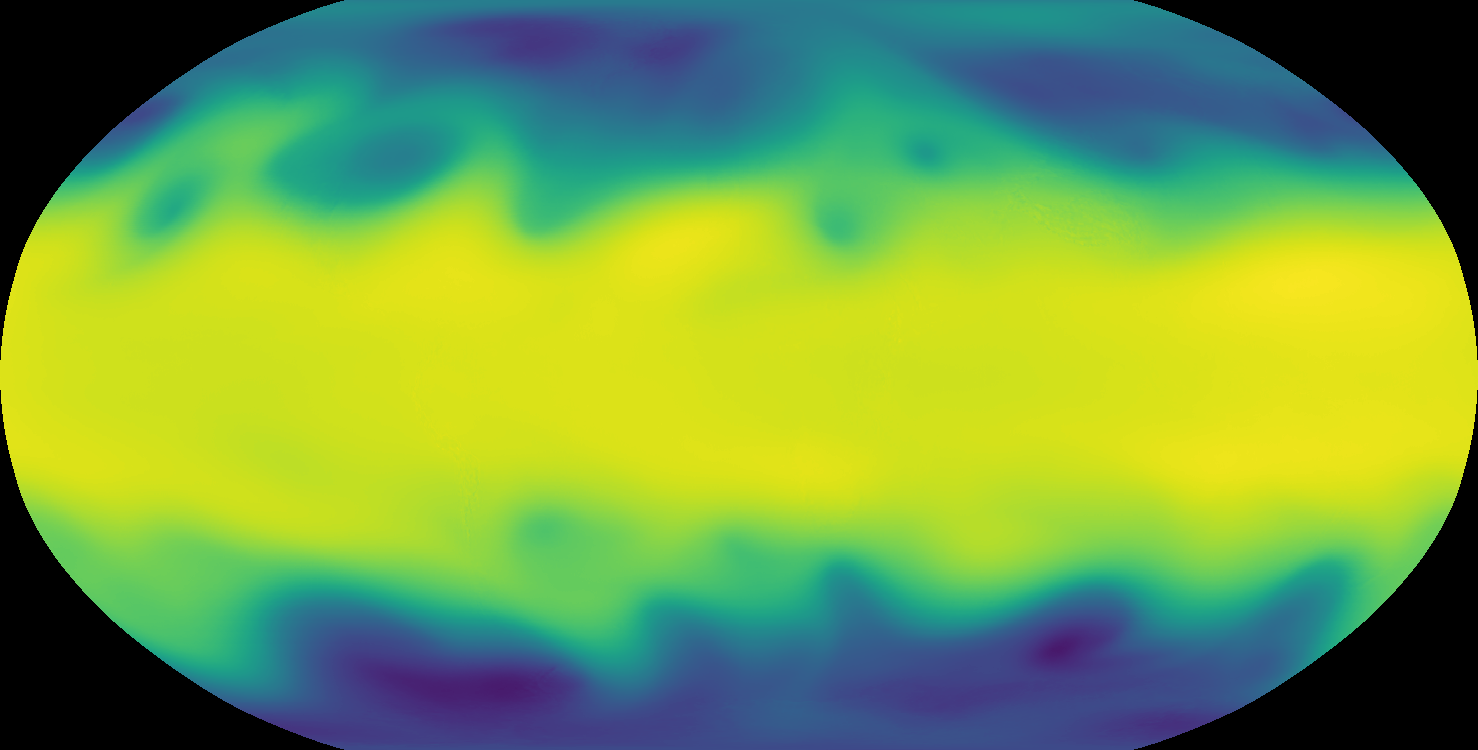
Verification
Claims the paper makes
9 Valid · 0 Not valid · 18 Not checked · 150 Own results and interpretations
The cited sources support only part of this claim — read each source’s verdict below.
In the paper
“Generally, verifying a model against its own analysis gives the best skill estimates [45].”
§ 5. Verification methods > 5.2. Comparing GraphCast to HRES
What the sources say
- Partly supportedcites [45] [45] Richard Swinbank, Masayuki Kyouda, Piers Buchanan, Lizzie Froude, Thomas M Hamill, Tim D Hewson, Julia H Keller, Mio Matsueda, John Methven, Florian Pappenberger, et al. The TIGGE project and its achievements. Bulletin of the American Meteorological Society, 97(1):49–67, 2016. sourceExperimental — accuracy not yet measured
The Verification section reports an example in low-level tropical regions where the model verified against its own analysis appeared most accurate. It does not establish this as a general rule; instead, it warns that skill rankings depend strongly on the analysis used and recommends verifying against more than one analysis. (LLM, conf=0.86)
plainstates a cause- Asserted: passes — The authors put it forward as true.
- Checkable: passes — It can be checked against evidence.
- Load-bearing: passes — The paper’s conclusions depend on it.
- Based: passes — The paper gives a reason why it holds.
- Partly supported
The cited sources support only part of this claim — read each source’s verdict below.
In the paper
“For the HRES baseline, we used the TIGGE archive, which provides cyclone tracks estimated with the operational tracker, from HRES's forecasts at 0.1° resolution [8, 46].”
§ 1. Datasets > 1.3. Tropical cyclone datasets
What the sources say
- Partly supportedcites [8] [8] Philippe Bougeault, Zoltan Toth, Craig Bishop, Barbara Brown, David Burridge, De Hui Chen, Beth Ebert, Manuel Fuentes, Thomas M Hamill, Ken Mylne, et al. The THORPEX interactive grand global ensemble. Bulletin of the American Meteorological Society, 91(8):1059–1072, 2010. sourceExperimental — accuracy not yet measured
The Applications of TIGGE section says TIGGE providers supplied tropical cyclone tracks and that the archive centers would distribute them. It does not establish that those tracks came from HRES forecasts at 0.1° resolution or were estimated with the operational tracker; the examples instead describe ECMWF and UKMO ensemble tracks. (LLM, conf=0.85)
- Partly supportedcites [46] [46] Richard Swinbank, Masayuki Kyouda, Piers Buchanan, Lizzie Froude, Thomas M. Hamill, Tim D. Hewson, Julia H. Keller, Mio Matsueda, John Methven, Florian Pappenberger, Michael Scheuerer, Helen A. Titley, Laurence Wilson, and Munehiko Yamaguchi. The TIGGE project and its achievements. Bulletin of the American Meteorological Society, 97(1):49 – 67, 2016. sourceExperimental — accuracy not yet measured
The TIGGE Project and Its Achievements describes TIGGE as an archive of ensemble forecasts, and its Dynamics and Predictability section reports cyclone tracks derived from TIGGE data using a tracking method employed operationally by ECMWF. It does not establish that the archive provides tracks from HRES forecasts at 0.1° resolution; the tracking passage concerns global ensembles, not HRES. (LLM, conf=0.85)
plain- Asserted: passes — The authors put it forward as true.
- Checkable: passes — It can be checked against evidence.
- Load-bearing: passes — The paper’s conclusions depend on it.
- Based: passes — The paper gives a reason why it holds.
- Partly supported
Every source the paper cites for this claim was checked and supports it.
In the paper
“Because extreme prediction is by definition an imbalanced classification problem, we base our analysis on precision-recall plots which are well-suited for this case [42].”
§ 1 2 3 4 5 6 7 8 9 10 > 8.3. Extreme heat and cold
What the sources say
- Supportedcites [42] [42] Takaya Saito and Marc Rehmsmeier. The precision-recall plot is more informative than the ROC plot when evaluating binary classifiers on imbalanced datasets. PloS one, 10(3):e0118432, 2015. 101 https://confluence.ecmwf.int/display/FCST/202208+-+Heatwave+-+UK https://confluence.ecmwf.int/display/FCST/202208+-+Heatwave+-+UK https://www.ecmwf.int/node/17262 https://www.ecmwf.int/node/17262 GraphCast: Learning skillful medium-range global weather forecasting source
The Summary of the re-evaluation says precision-recall plots show classifiers’ susceptibility to imbalanced datasets with clear visual cues. This supports using them to evaluate an imbalanced classification problem; the citing authors’ characterization of extreme prediction is their own framing. (LLM, conf=0.93)
boostedstates an association- Asserted: passes — The authors put it forward as true.
- Checkable: passes — It can be checked against evidence.
- Load-bearing: passes — The paper’s conclusions depend on it.
- Based: passes — The paper gives a reason why it holds.
- Supported
The cited sources support only part of this claim — read each source’s verdict below.
In the paper
“However, the HRES cyclone tracks in the TIGGE archive [8] are only initialized at 00z and 12z.”
§ 8. Additional severe event forecasting results > 8.1. Tropical cyclone track forecasting
What the sources say
- Partly supportedcites [8] [8] Philippe Bougeault, Zoltan Toth, Craig Bishop, Barbara Brown, David Burridge, De Hui Chen, Beth Ebert, Manuel Fuentes, Thomas M Hamill, Ken Mylne, et al. The THORPEX interactive grand global ensemble. Bulletin of the American Meteorological Society, 91(8):1059–1072, 2010. sourceExperimental — accuracy not yet measured
The Applications of TIGGE section says tropical cyclone tracks were to be distributed by TIGGE archive centers. Table 3 lists two daily forecast cycles for ECMWF’s ensemble, but the paper does not identify HRES cyclone tracks or state that their only initialization times are 00z and 12z. (LLM, conf=0.79)
plain- Asserted: passes — The authors put it forward as true.
- Checkable: passes — It can be checked against evidence.
- Load-bearing: passes — The paper’s conclusions depend on it.
- Based: passes — The paper gives a reason why it holds.
- Partly supported
Every source the paper cites for this claim was checked and supports it.
In the paper
“we can derive this quantity from the predicted atmospheric variables specific humidity, q, and horizontal wind, (u, v), via the relation [38]:”
§ 1 2 3 4 5 > 8.2. Atmospheric rivers
What the sources say
- Supportedcites [38] [38] Paul J Neiman, F Martin Ralph, Gary A Wick, Jessica D Lundquist, and Michael D Dettinger. Meteorological characteristics and overland precipitation impacts of atmospheric rivers affecting the West Coast of North America based on eight years of ssm/i satellite observations. Journal of Hydrometeorology, 9(1):22–47, 2008. source
In section c, “The link between SSM/I IWV plumes and atmospheric rivers” (page not provided), the paper defines IVT as vertically integrated horizontal water-vapor flux calculated from q and the horizontal wind components. It describes summing the flux components through pressure layers, which supports the cited relation; the paper uses reanalysis variables rather than predictions. (LLM, conf=0.92)
plainstates a cause- Asserted: passes — The authors put it forward as true.
- Checkable: passes — It can be checked against evidence.
- Load-bearing: passes — The paper’s conclusions depend on it.
- Based: passes — The paper gives a reason why it holds.
- Supported
65 more claims
Create a free account to see all 177 claims and to verify the 13 references still open.
- Probably not a substantial claim. 54
- It may state two separate claims as one. 70
- The quote only partly states this claim. 2
Claims other papers make about this one
Each is checked against this paper’s own text: does it say what the citing paper says it does?
The source backs part of the claim, not all of it — or backs it for a different population, condition or comparison.
In the citing paper
“Existing machine-learning models have focused on deterministic prediction, and surpass deterministic numerical weather prediction in terms of the aggregate metrics for which they are trained3,4.”
From Neural general circulation models for weather and climate (2024) · cites this paper as [3]
Experimental — accuracy not yet measuredThe source backs part of the claim, not all of it — or backs it for a different population, condition or comparison.
In the citing paper
“Most state-of-the-art machine learning models utilized in medium-range weather forecasting are built upon encoder-decoder84 architectures27–29,85.”
From A machine learning model that outperforms conventional global subseasonal forecast models (2024) · cites this paper as [27]
Experimental — accuracy not yet measuredThe source backs part of the claim, not all of it — or backs it for a different population, condition or comparison.
In the citing paper
“However, these advances have focused primarily on single, deterministic forecasts that fail to represent uncertainty and estimate risk.”
From Probabilistic weather forecasting with machine learning (2025) · cites this paper as [2]
Experimental — accuracy not yet measuredThe source backs part of the claim, not all of it — or backs it for a different population, condition or comparison.
In the citing paper
“They are typically trained to minimize the mean squared error (MSE) of their predictions and as a result tend to produce blurry forecasts, especially at longer lead times, rather than a specific realization of a possible weather state2.”
From Probabilistic weather forecasting with machine learning (2025) · cites this paper as [2]
Experimental — accuracy not yet measuredThe cited source says what the claim attributes to it.
In the citing paper
“Even so, these techniques are still fundamentally reliant on precise meteorological observations [1-3].”
From Advancing Data Quality Assurance with Machine Learning: A Case Study on Wind Vane Stalling Detection (2025) · cites this paper as [3]
10 more claims about this paper
Create a free account to see every claim other papers make about this one.
Self-check
Percentages, sums and reported differences re-computed from the paper’s own numbers.
Each contradiction between two passages listed here was confirmed by an independent check.
Rated minor: it would not touch a result — a value no result rests on, a p-value that stays on the same side of the significance level, or a conflict that is clerical, resolved elsewhere in the paper, or outside its own findings.
In the paper
§ 7. Additional forecast verification results > 7.1. Detailed results for additional variables
“The ACC skill score is the normalized ACC difference between model 𝐴 and baseline 𝐵 as (ACC𝐴 − ACC𝐵)/(1 − RMSE𝐵).”
§ 1 2 3 4 > 5.3. Evaluation metrics
“and the normalized ACC difference as (ACC𝐴 − ACC𝐵)/(1 − ACC𝐵).”
Rated minor: it would not touch a result — a value no result rests on, a p-value that stays on the same side of the significance level, or a conflict that is clerical, resolved elsewhere in the paper, or outside its own findings.
In the paper
§ 1 2 3 4 5 6 7
“The x-axis represents lead time, at 6-hour steps over 10 days.”
§ 6. Comparison with previous machine learning baselines
“Pangu-Weather[7] reports its 7-day forecast accuracy (RMSE and ACC) on: z500, t500, t850,”
Rated minor: it would not touch a result — a value no result rests on, a p-value that stays on the same side of the significance level, or a conflict that is clerical, resolved elsewhere in the paper, or outside its own findings.
In the paper
§ Conclusions
“because of the ERA5 training data's native 0.25° resolution”
§ 102 103 104
“the native resolution of ERA5 is 0.28125◦ corresponding to a shortest wavelength of 62km”
Citations
Cites
Vaswani, A., Shazeer, N., Parmar, N., Uszkoreit, J., Jones, L., Gomez, A. N., Kaiser, L., & Polosukhin, I. (2017) · arXiv · doi:10.48550/arxiv.1706.03762 · Cited by 120,404
Adam: A Method for Stochastic Optimization
Kingma, D. P., & Ba, J. (2014) · arXiv · doi:10.48550/arxiv.1412.6980 · Cited by 98,946
Exploiting Generative AI to Scale up Intelligent Tutoring Systems
Jakubův, J., Chvalovský, K., Goertzel, Z., Kaliszyk, C., Olšák, M., Piotrowski, B., Schulz, S., Suda, M., & Urban, J. (2023) · DROPS (Schloss Dagstuhl – Leibniz Center for Informatics) · doi:10.4230/lipics.itp.2023.19 · Cited by 76,658
Hersbach, H., Bell, B., Berrisford, P., Hirahara, S., Horányi, A., Muñoz‐Sabater, J., Nicolas, J., Peubey, C., Radu, R., Schepers, D., et al. (2020) · Quarterly Journal of the Royal Meteorological Society · doi:10.1002/qj.3803 · Cited by 31,882
Decoupled Weight Decay Regularization
Loshchilov, I., & Hutter, F. (2017) · arXiv · doi:10.48550/arxiv.1711.05101 · Cited by 12,522
Veličković, P., Cucurull, G., Casanova, A., Romero, A., Liò, P., & Bengio, Y. (2017) · arXiv · doi:10.48550/arxiv.1710.10903 · Cited by 12,107
Saito, T., & Rehmsmeier, M. (2015) · PLOS ONE · doi:10.1371/journal.pone.0118432 · Cited by 5,309
SGDR: Stochastic Gradient Descent with Warm Restarts
Loshchilov, I., & Hutter, F. (2016) · arXiv · doi:10.48550/arxiv.1608.03983 · Cited by 5,309
Backpropagation through time: what it does and how to do it
Werbos, P. J. (1990) · Proceedings of the IEEE · doi:10.1109/5.58337 · Cited by 4,879
Knapp, K. R., Kruk, M. C., Levinson, D. H., Diamond, H. J., & Neumann, C. J. (2010) · Bulletin of the American Meteorological Society · doi:10.1175/2009bams2755.1 · Cited by 3,237
Research works printed but not linked: 3
- D. H. Levinson, H. J. Diamond, K. R. Knapp, M. C. Kruk, E. J. Gibney, Toward a homogenous global tropical cyclone best-track dataset. Bull. Am. Meteorol. Soc. 91, 377–380 (2010).
- ECMWF IFS Documentation CY45R1 – Part II: Data assimilation (European Centre for Medium-Range Weather Forecasts 2018); .10.21957/a3ri44ig4 · doi:10.21957/a3ri44ig4
- T. Haiden M. Janousek F. Vitart L. Ferranti F. Prates “Evaluation of ECMWF forecasts including the 2019 upgrade ” ECMWF Technical Memorandum No. 853 (European Centre for Medium-Range Weather Forecasts 2019); .10.21957/mlvapkke · DOI
Cited by
Kolmogorov-Arnold Networks Meet Science
Liu, Z., Tegmark, M., Ma, P., Matusik, W., & Wang, Y. (2025) · Physical Review X · doi:10.1103/4t7t-v19l · Cited by 286
ClimaX: A foundation model for weather and climatePreprint
Nguyen, T. T., Brandstetter, J., Kapoor, A., Gupta, J. K., & Grover, A. (2023) · arXiv (Cornell University) · doi:10.48550/arxiv.2301.10343 · Cited by 798
Neural general circulation models for weather and climate
Kochkov, D., Yuval, J., Langmore, I., Norgaard, P., Smith, J., Mooers, G., Klöwer, M., Lottes, J., Rasp, S., Düben, P., et al. (2024) · Nature · doi:10.1038/s41586-024-07744-y · Cited by 454
“Specifically, we diagnose precipitation minus evaporation (Supplementary Information section H.5) rather than directly predicting these as in machine-learning-based approaches 3 .”
BackgroundMethodInfluentialSelf-citationProbabilistic weather forecasting with machine learning
Price, I., Sanchez-Gonzalez, A., Alet, F., Andersson, T. R., El-Kadi, A., Masters, D., Ewalds, T., Stott, J., Mohamed, S., Battaglia, P., et al. (2025) · Nature · doi:10.1038/s41586-024-08252-9 · Cited by 434
Self-citationNeural operators for accelerating scientific simulations and design
Azizzadenesheli, K., Kovachki, N., Li, Z., Liu-Schiaffini, M., Kossaifi, J., & Anandkumar, A. (2024) · Nature Reviews Physics · doi:10.1038/s42254-024-00712-5 · Cited by 314
Metadata
- Authors
- Lam, R., Sanchez-Gonzalez, A., Willson, M., Wirnsberger, P., Fortunato, M., Alet, F., Ravuri, S., Ewalds, T., Eaton-Rosen, Z., Hu, W., Merose, A., Hoyer, S., Holland, G., Vinyals, O., Stott, J., Pritzel, A., Mohamed, S., & Battaglia, P.
- Affiliations
- Google DeepMind, London, UK.
- Google DeepMind (United Kingdom) (GB)
- Google (United States) (US)
- Corresponding author
- Willson, Matthew
- Wirnsberger, Peter
- Fortunato, Meire
- Alet, Ferran
- Ravuri, Suman
- Mohamed, Shakir
- Battaglia, Peter
- ORCID
- Venue
- Science
- Published
- 2023-12-22
- Volume
- 382
- Issue
- 6677
- Pages
- 1416-1421
- ISSN
- 0036-8075 (ISSN-L)
- 1095-9203
- OpenAlex
- W4388654737
- Cited by
- 1,466
- References
- 48
- Citations by year
- 2026: 599 · 2025: 522 · 2024: 319 · 2023: 25
- FWCI
- 161.54
- Type
- journal article
- Language
- en
- Open access
- hybrid
- doi.org
- Licence
- cc-by
- Locations
- Science (publishedVersion, cc-by)
- PubMed (publishedVersion)
- Topics
- Physical Sciences › Earth and Planetary Sciences › Atmospheric Science › Meteorological Phenomena and Simulations
- Physical Sciences › Environmental Science › Environmental Engineering › Hydrological Forecasting Using AI
- Social Sciences › Transportation › Traffic Prediction and Management Techniques
- Keywords
- medium-range weather forecasting, GraphCast, reanalysis data, machine learning weather prediction, deterministic forecasting, tropical cyclone tracking, atmospheric rivers, severe weather forecasting
About these checks
Registry, retraction, Cites and statistics results are computed, not judged, with one exception: a printed reference that no index lists is read once by a model before it counts as a citation error. Claims are extracted by a model and kept only when their quote appears verbatim in the text; each cited source is then checked, with a model’s help, for whether it says what the claim relies on. Those verdicts can be wrong — read the claim’s quote and the cited source before relying on one.
The claim verdicts this report counts are experimental: their accuracy is not yet measured.
A language model drew the claims from the paper on 2026-11-08, under version 3 of the claim definition (model deepseek-v4.1-flash, prompt extract-v3).
A second model labelled each claim on 2026-11-08 (model jev-1.13-20260917, definition revision gold-guideline-v0.2).
Cited sources are checked with a language model’s help (gpt-6-sol).
Statistics and arithmetic are recomputed, not judged.
Confidence bands are shown only for fields calibrated on our annotated test set. None is calibrated yet, so no band is shown.
What counts as a claim ›How we measure confidence ›How we check this ›
Are you an author, or do you see a problem with this page? Request a review
How to cite
Cite CoChat for the checks on this page, and the paper for its own findings.
- This page
- CoChat. (2026). Citation check: Learning skillful medium-range global weather forecasting. https://app.cochat.ai/papers/10.1126/science.adi2336
- The paper
- Lam, R., Sanchez-Gonzalez, A., Willson, M., Wirnsberger, P., Fortunato, M., Alet, F., Ravuri, S., Ewalds, T., Eaton-Rosen, Z., Hu, W., Merose, A., Hoyer, S., Holland, G., Vinyals, O., Stott, J., Pritzel, A., Mohamed, S., & Battaglia, P. (2023). Learning skillful medium-range global weather forecasting. Science. https://doi.org/10.1126/science.adi2336
Data sources
Bibliographic data: Semantic Scholar, OpenAlex, Crossref.
Contains information from the Semantic Scholar Academic Graph Datasets, made available under the ODC Attribution License (ODC-BY 1.0).
Semantic Scholar’s data is described in: Kinney, R., et al. (2023). The Semantic Scholar Open Data Platform. arXiv:2301.10140.
